Churn Rate by Industry: 2026 Benchmarks That Actually Help
Customer churn costs U.S. businesses $168 billion per year. The average customer churn rate sits at 21%. Yet benchmark numbers for the same vertical vary wildly across sources because they're mixing B2B with B2C, logo churn with revenue churn, and monthly with annual without telling you.
We reconciled multiple datasets - including a study covering 10,214 firms - so you can compare churn rate by industry without second-guessing the methodology. Below: a multi-source benchmark table, the math most articles get wrong, and what to actually do about your number. If you need a refresher on definitions, start with churn.
2026 Benchmarks by Industry
We standardized everything to annual churn and reconciled multiple datasets. Where sources disagree, ranges reflect the spread.
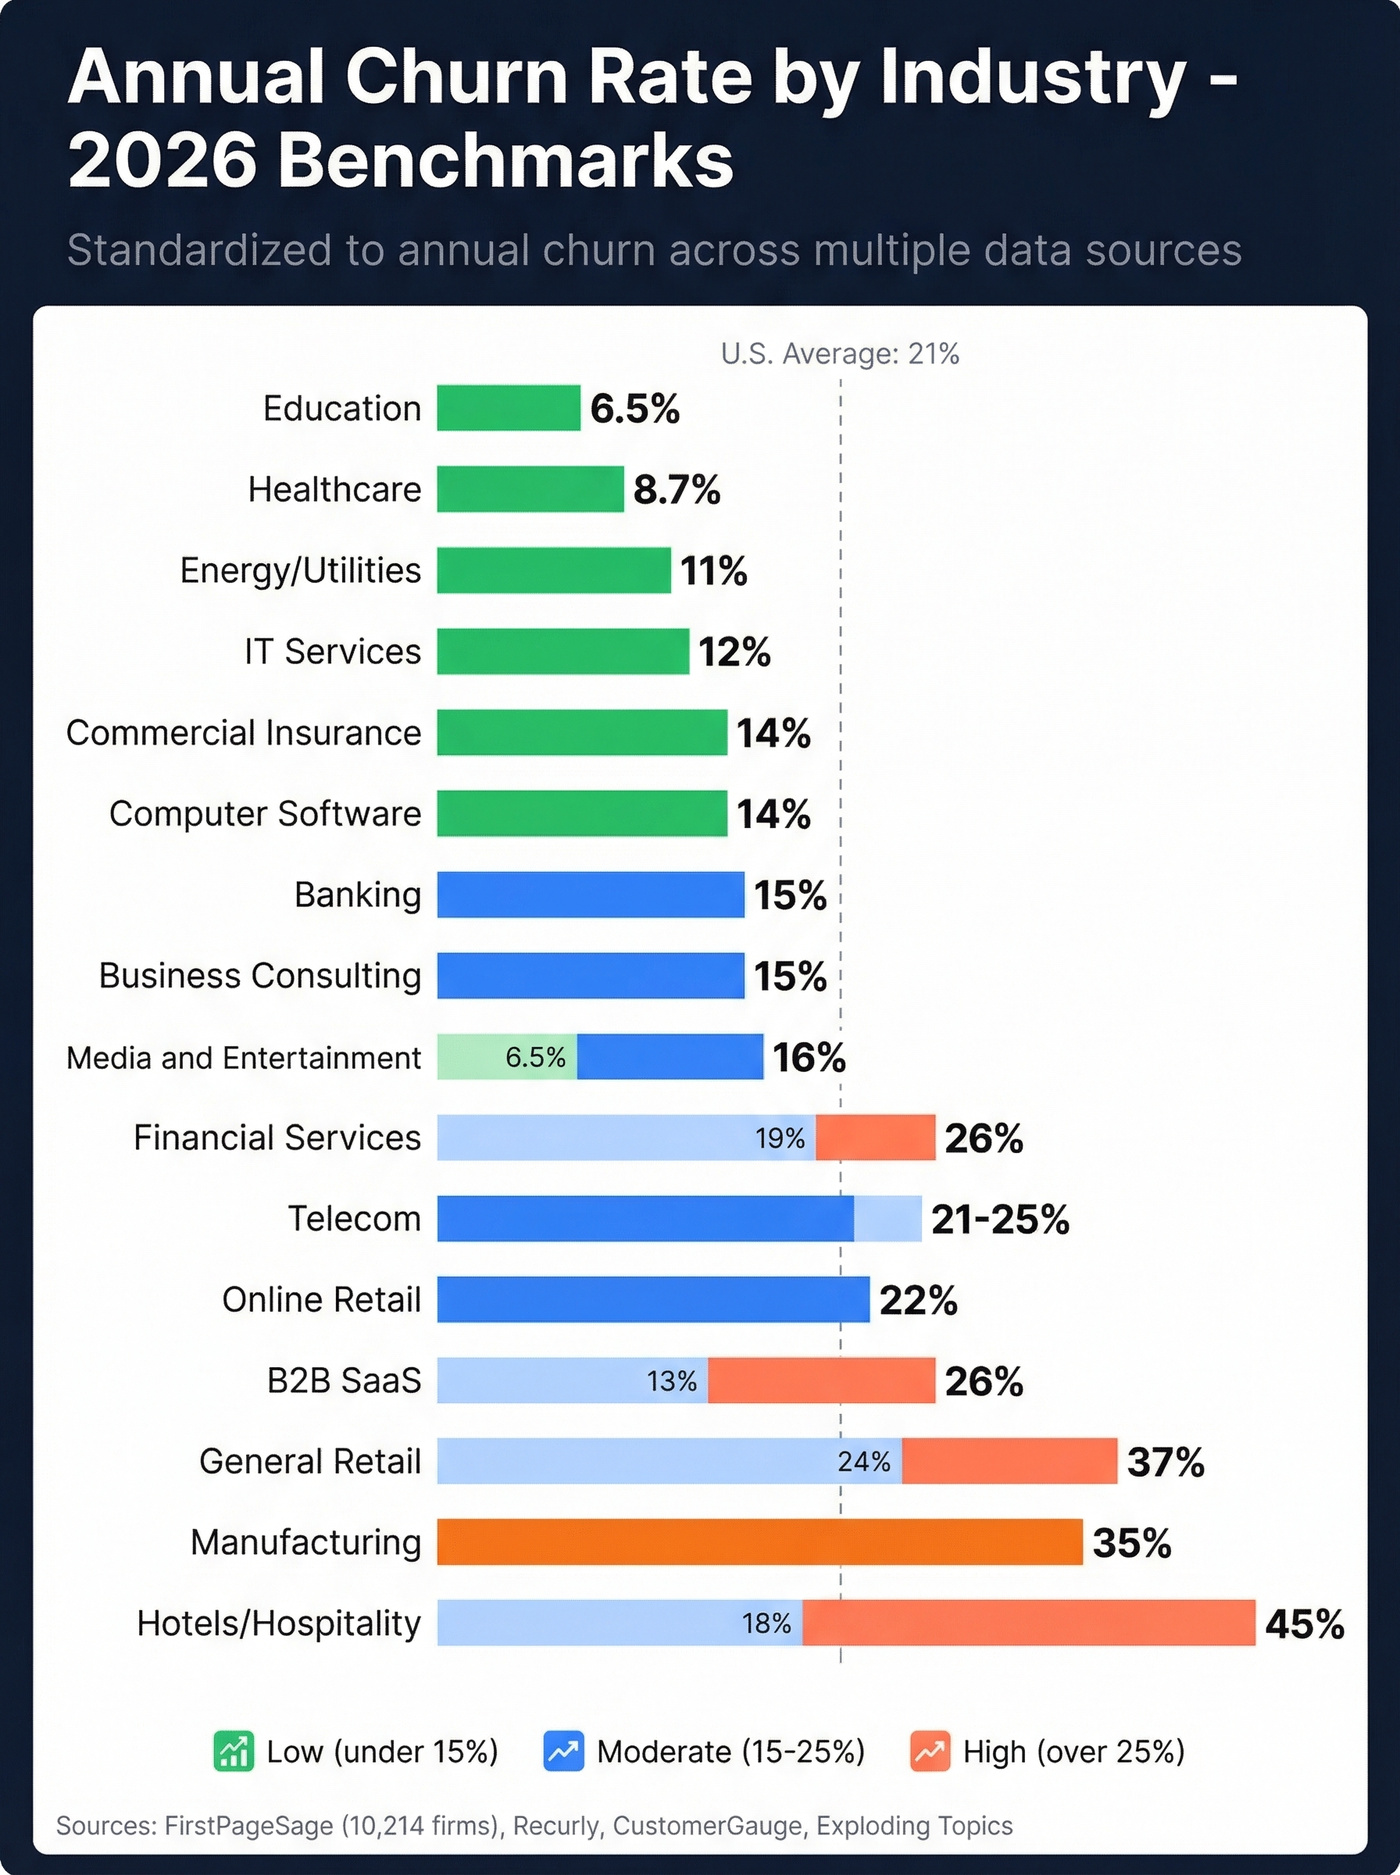
| Industry | Annual Churn | Primary Source |
|---|---|---|
| Energy / Utilities | ~11% | CustomerGauge |
| IT Services | ~12% | CustomerGauge |
| Commercial Insurance | ~14% | FirstPageSage |
| Computer Software | ~14% | CustomerGauge |
| Banking | ~15% | Growth-onomics |
| Business Consulting | ~15% | FirstPageSage |
| Professional Services | ~16% | Exploding Topics |
| Media & Entertainment | 6.5-16% | Recurly / Exploding Topics |
| Education | ~6.5% | Recurly |
| Healthcare | ~8.7% | Growth-onomics |
| Financial Services | 19-26% | CustomerGauge / FirstPageSage |
| B2B SaaS | 13-26% | Growth-onomics / FirstPageSage |
| Telecom | 21-25% | Exploding Topics / FirstPageSage |
| Online Retail | ~22% | Qualtrics |
| General Retail | 24-37% | Exploding Topics / Qualtrics |
| Hotels / Hospitality | 18-45% | FirstPageSage / Qualtrics |
| Manufacturing | ~35% | CustomerGauge |
Sources: FirstPageSage (10,214 firms), Exploding Topics, CustomerGauge, Growth-onomics, Recurly.
A few notes on the outliers. Media & Entertainment splits dramatically: DTC digital media churns around 6.5% annually per Recurly, while broader media/entertainment runs ~16%. Regional variation matters too - energy/utilities churn runs 30-35% in the U.S. but just 12-15% in parts of Europe.
Most teams obsess over where they fall on this table. The number that actually matters is whether your churn is improving quarter over quarter relative to your own baseline. A 22% rate that was 30% six months ago tells a better story than a 12% rate that's been climbing. If you want a more rigorous approach, run a proper churn analysis.
Healthcare & Insurance
Healthcare churn is the most misunderstood number on any benchmark list. Medicaid churns ~20% annually, ACA exchange plans lose ~26% of enrollees each year, and employer-sponsored insurance ranges 12-22%. Medicare Advantage - covering 54% of Medicare beneficiaries - sees 18% plan-switching annually. Lumping all of that into a single "healthcare: 8.7%" figure is borderline misleading.
Telecom: Prepaid vs. Postpaid
Prepaid churn runs up to 70% annually in some markets. Postpaid sits at 10-20%. T-Mobile reported 0.90% monthly postpaid churn in Q2 2025; AT&T came in at 0.87%. Those are elite numbers, and they only apply to contract subscribers. If someone tells you "telecom churn is 21%," ask which telecom.
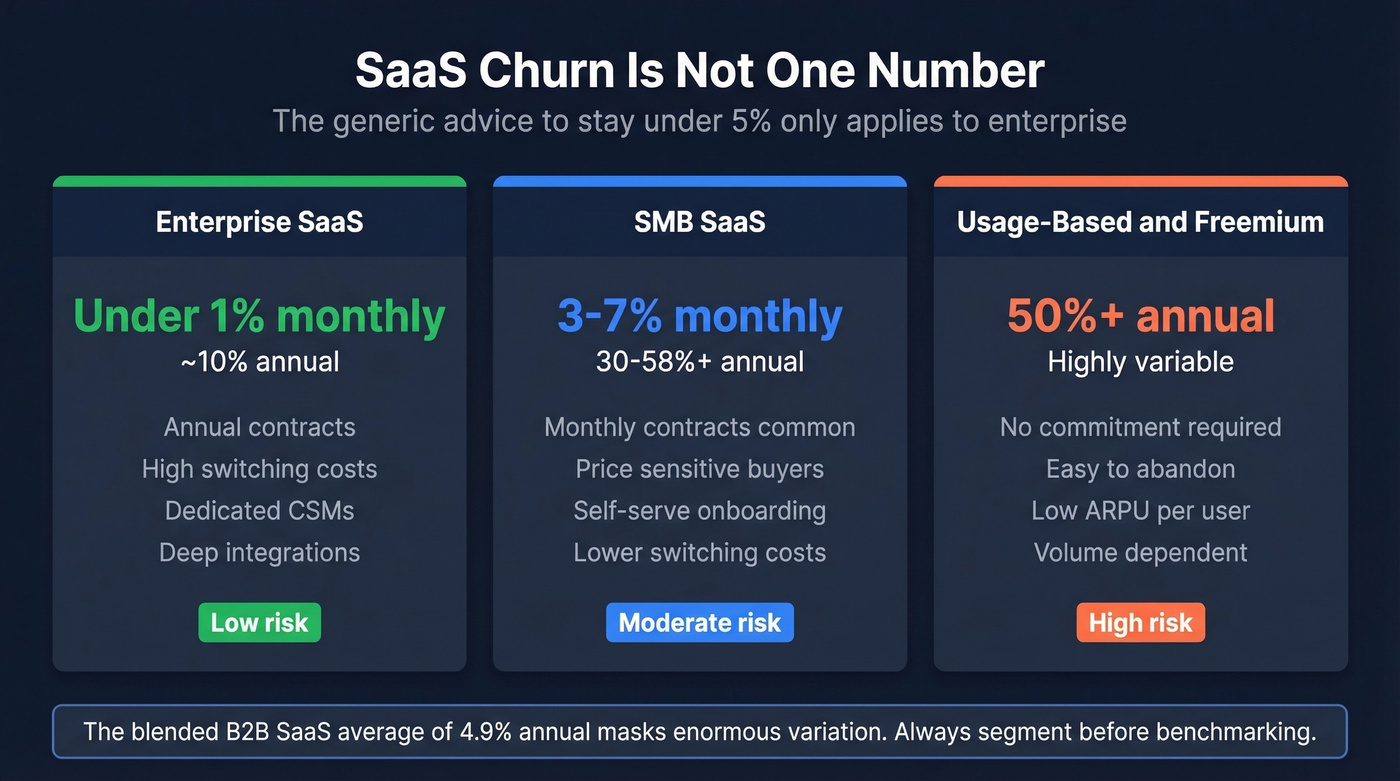
SaaS Churn by Segment
Here's the thing: the "SaaS churn should be under 5%" advice floating around the internet is enterprise SaaS advice. SMB SaaS typically runs 3-7% monthly, compounding to 30-58%+ annual. Enterprise SaaS stays at or below 1% monthly, roughly 10% annual. Usage-based and freemium models? North of 50% annually. The overall B2B average sits around 4.9% annual, though that number masks enormous variation between segments and contract lengths. (If you're benchmarking against acquisition efficiency too, pair this with your cost to acquire customer.)
Monthly to Annual Conversion
Most articles get this math wrong. You can't multiply monthly churn by 12. Churn compounds - each month's base shrinks. The correct formula:
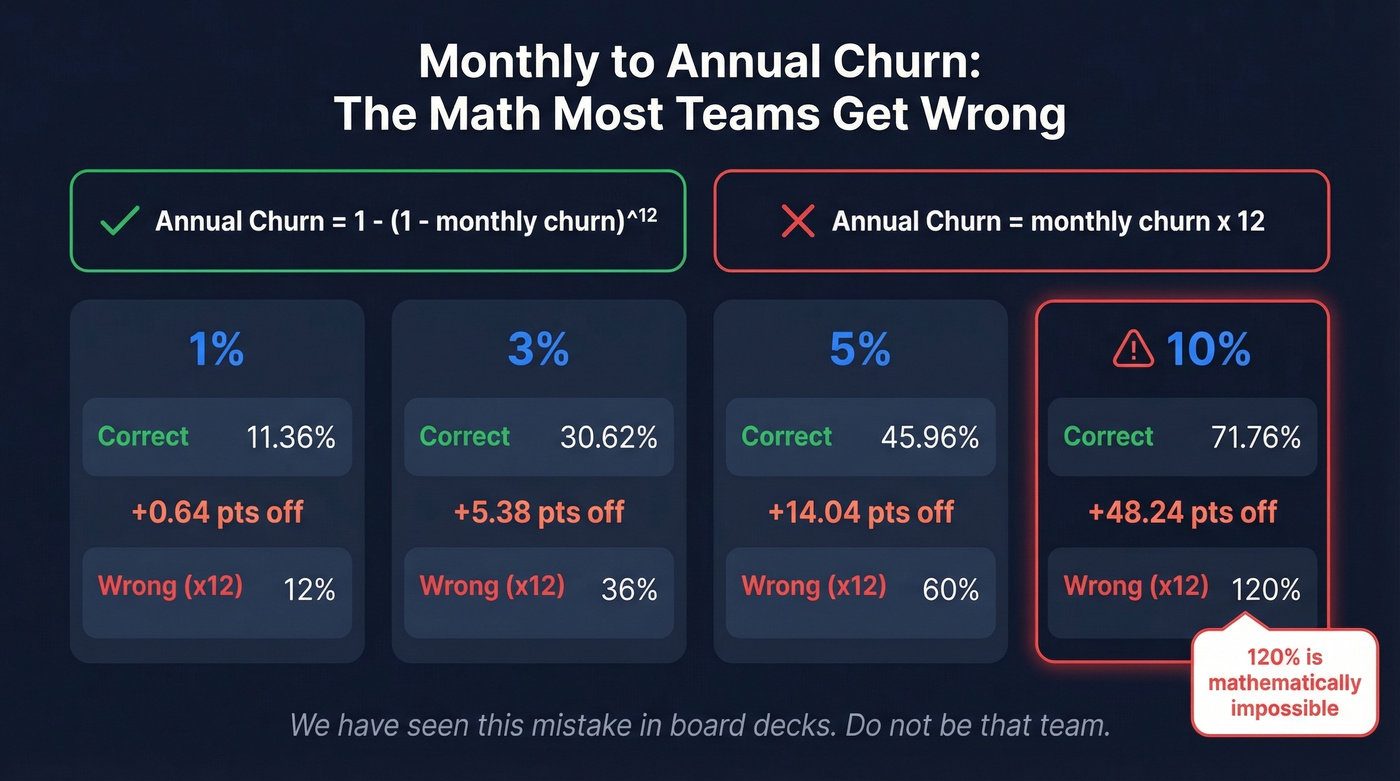
Annual churn = 1 - (1 - monthly churn)^12
| Monthly | Annual (correct) | Annual (x12, wrong) |
|---|---|---|
| 1% | 11.36% | 12% |
| 3% | 30.62% | 36% |
| 5% | 45.96% | 60% |
| 10% | 71.76% | 120% (!) |
At 5% monthly, the naive calculation overstates annual churn by 14 percentage points. At 10% monthly, multiplying by 12 gives you a mathematically impossible 120%. We've seen this mistake in board decks. Don't be that team.
20-40% of churn is involuntary - failed payments, expired cards, and bounced emails. If your renewal reminders bounce because contact data decayed, you're losing revenue no one even fights for. Prospeo refreshes every record every 7 days with 98% email accuracy, so your dunning sequences and CS outreach actually reach the inbox.
Fix your contact data before you blame your product for churn.
Voluntary vs. Involuntary Churn
Not all churn is a product problem. Recurly breaks overall churn (3.27%) into voluntary (2.41%) and involuntary (0.86%). That means involuntary churn - failed payments, expired cards, bounced dunning emails - accounts for 20-40% of total churn in subscription businesses. They also find churn drops as ARPU rises, another reason aggregate benchmarks mislead.
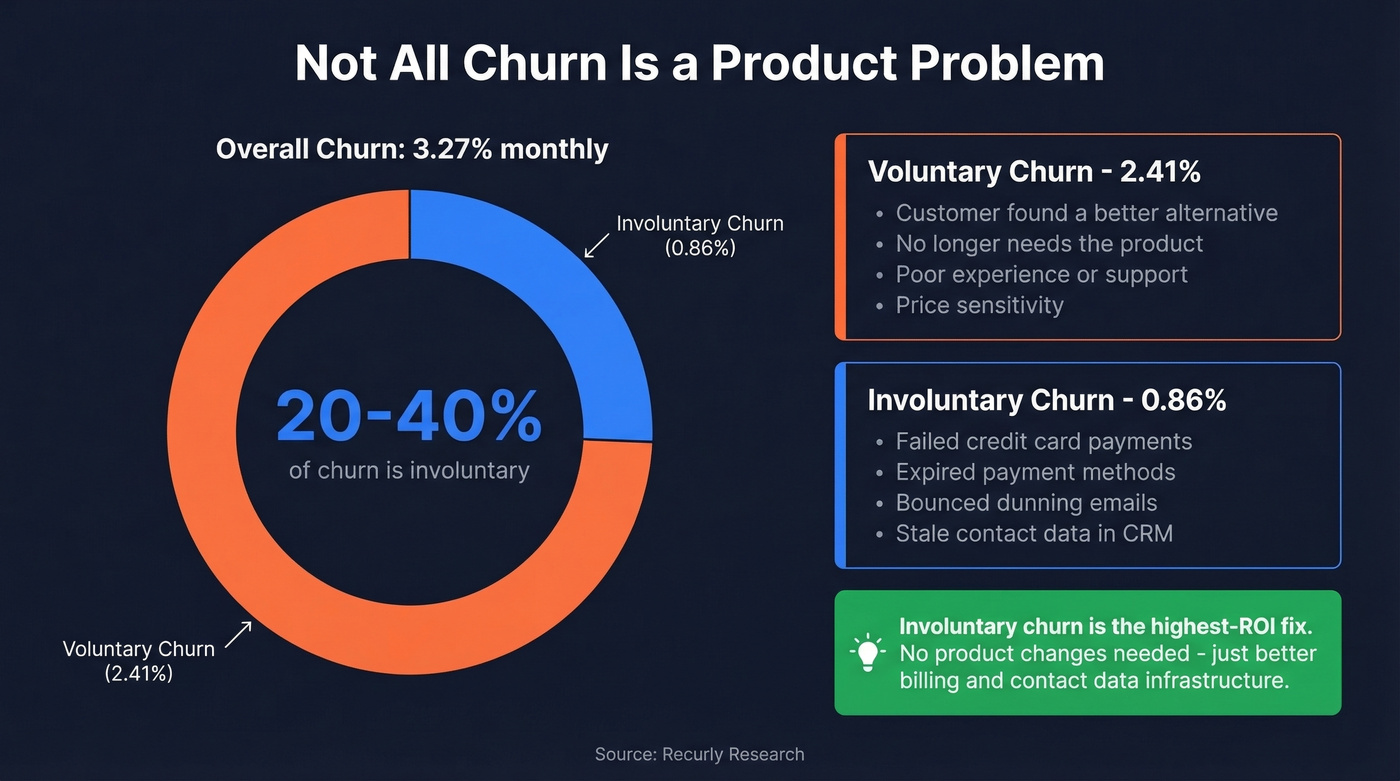
Let's be honest: if a quarter of your churn is just broken payment flows, you don't have a retention problem. You have a billing infrastructure problem.
When Churn Isn't a Problem
A Reddit thread on r/SaaS captured this perfectly: an operator running 15% annual churn, profitable, and growing. The consensus? That's fine. We've seen CS teams panic over a 15% number that's perfectly healthy for their segment.
Churn only matters relative to LTV:CAC, payback period, and growth rate. Understanding your customer acquisition cost is just as important as knowing your attrition - if acquisition is cheap relative to lifetime value, a higher churn rate can still yield strong unit economics. When net revenue retention is healthy, a "high" logo churn rate is sometimes the right tradeoff. Skip the panic and run the full unit economics first. (If you're operationalizing this, track it alongside your funnel metrics.)
How to Actually Reduce Churn
A 5% reduction in churn can boost revenue 25-95%. Four tactics that move the needle:
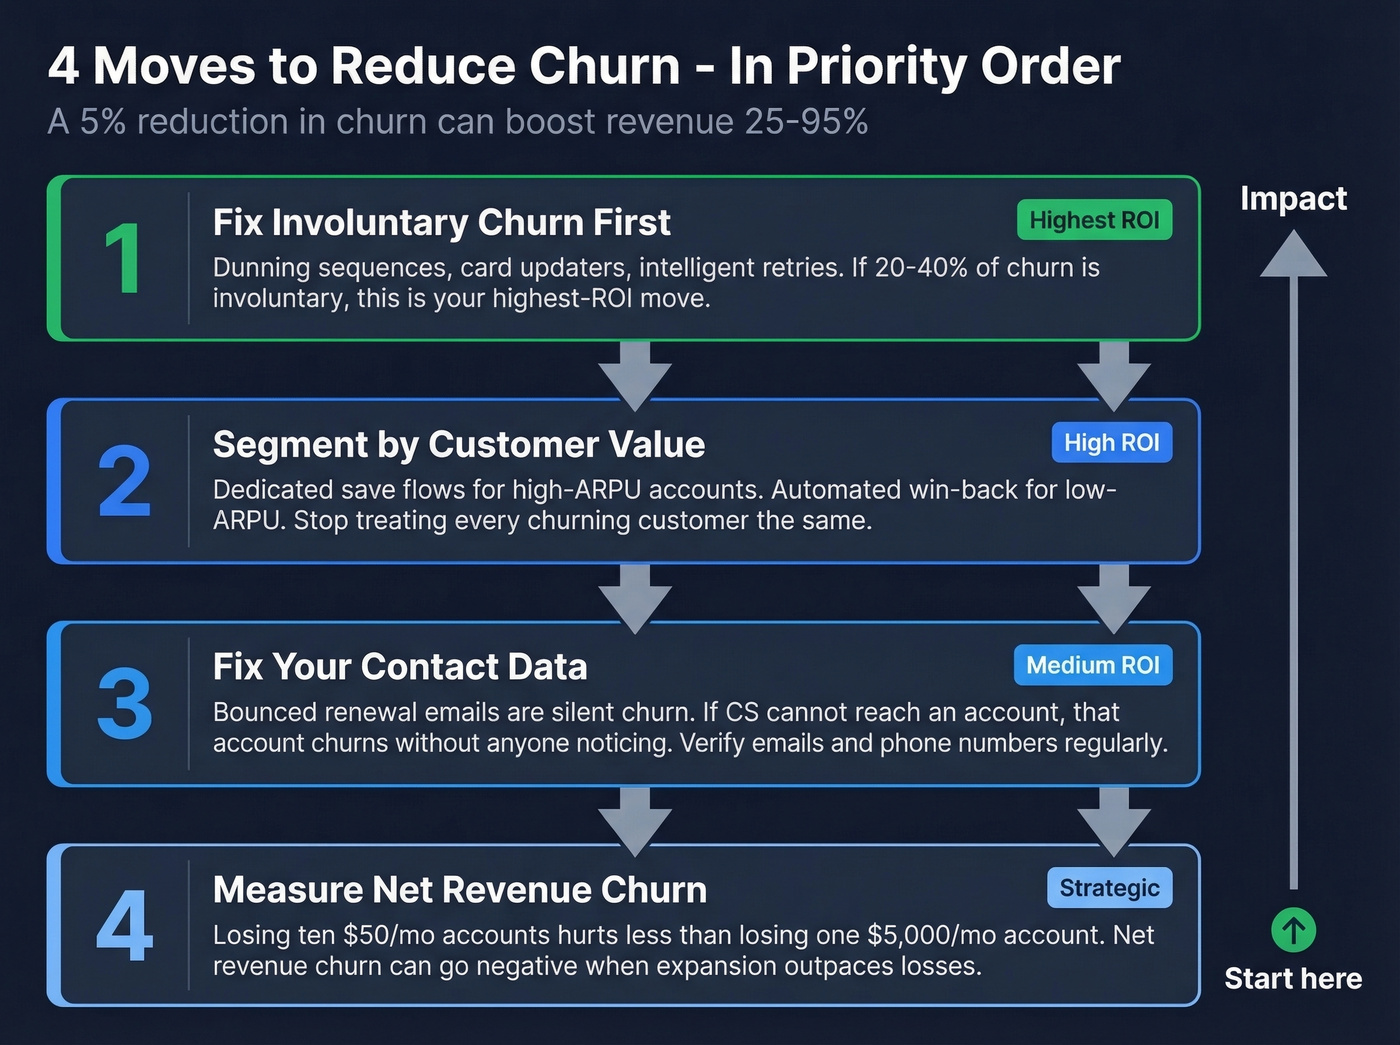
Fix involuntary churn first. Dunning sequences, card updaters, and intelligent retries are the highest-ROI retention investment. If 20-40% of your churn is involuntary, this is where you start. Everything else is secondary until you've plugged this hole.
Segment by customer value. Don't spend the same effort saving a $29/mo account as a $2,900/mo account. Your highest-value accounts deserve dedicated save flows, personal outreach, and executive escalation paths - while low-ARPU accounts get automated win-back sequences. The math isn't complicated, but a surprising number of teams treat every churning customer identically. (This is also where a tighter ideal customer profile helps.)
Fix your contact data. Bounced renewal emails are silent churn. If your CS team can't reach an account because the email's dead, that account churns without anyone noticing. Prospeo's 98% email accuracy and 7-day refresh cycle means renewal outreach actually lands instead of bouncing off stale addresses. If you're evaluating vendors, compare data enrichment services and best contact management software.

Measure net revenue churn. Losing ten $50/mo accounts hurts less than losing one $5,000/mo account. Net revenue churn - which accounts for expansion revenue - can actually go negative, meaning existing customers grow faster than lost ones shrink your base. That's the number your finance team cares about, and it's the one that should drive your retention strategy. (Related: renewal rate.)
You just calculated your real churn rate. Now ask: how many of those lost accounts simply never received your save attempt? Stale CRM data means renewal emails bounce, CSMs call dead numbers, and accounts churn silently. Prospeo enriches your CRM with 50+ data points per contact at a 92% match rate - for roughly $0.01 per email.
Enrich your CRM before your next renewal cycle starts.
FAQ
What's a good churn rate by industry?
Enterprise SaaS should target under 10% annual; SMB SaaS commonly runs 30-58%+. Subscription retail benchmarks sit under 25%, while telecom postpaid averages 10-20%. "Good" only makes sense relative to your unit economics, deal size, and growth rate - not a generic benchmark table.
How do you convert monthly churn to annual?
Use the compounding formula: Annual churn = 1 - (1 - monthly churn)^12. Never multiply by 12. A 5% monthly rate equals 46% annual, not 60%. At 10% monthly, the naive method gives an impossible 120%.
What's a typical B2B churn rate?
Enterprise B2B companies with annual contracts typically see 5-10% annual churn, while SMB-focused B2B businesses run 30%+ annually due to shorter contracts and higher price sensitivity. The blended B2B average of ~4.9% masks this gap entirely.
How does bad contact data increase churn?
When renewal emails bounce or phone numbers are dead, customers leave because you couldn't reach them - not because they wanted to. Verifying contact data eliminates this silent churn driver before it hits your retention numbers.