Cost Per Lead: The Most Misunderstood Metric in Marketing
Your CMO walks into the quarterly review and asks why CPL went up 40%. The room gets quiet. Nobody mentions that close rates doubled in the same period, or that the "cheap" leads from last quarter converted at 2%.
This is the problem with cost per lead - everyone tracks it, almost nobody tracks it correctly.
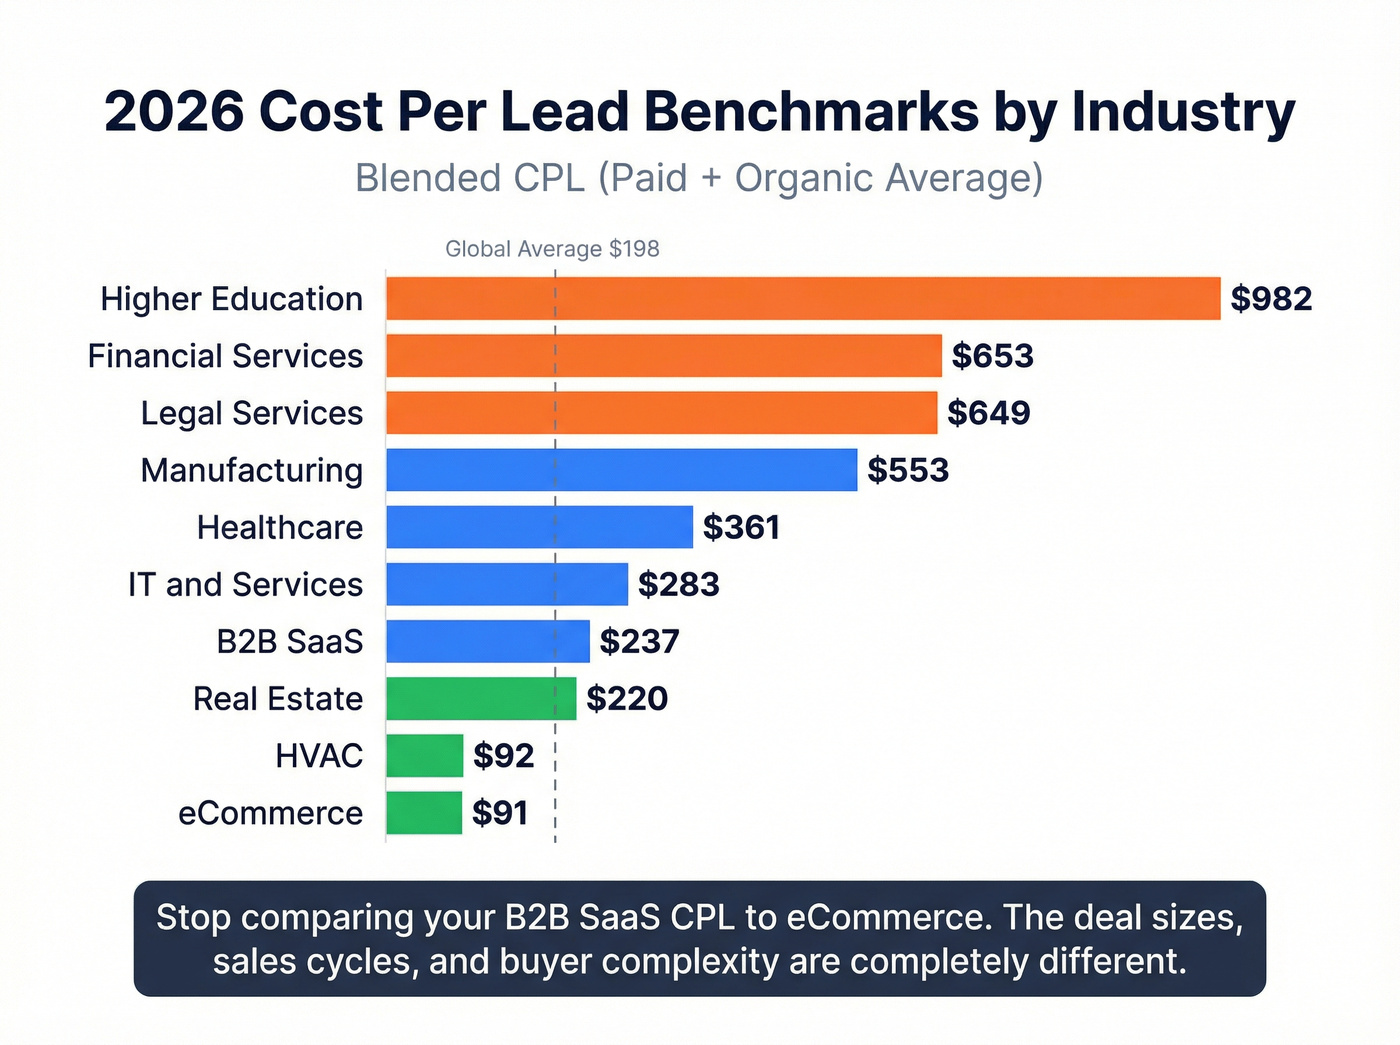
The global average CPL sits around $198, but that number is nearly useless on its own. Industry variance runs 10x or more: eCommerce averages $91, higher education averages $982. The real question isn't "what's my CPL?" It's "does my CPL connect to revenue?"
The Quick Version
The formula: Total marketing spend / total leads generated = CPL.
The benchmark: $198 global average, but your industry and channel matter far more than any cross-industry number. B2B SaaS blended CPL runs about $237. eCommerce sits under $100.
The question that actually matters: Does your CPL, multiplied through your funnel math, produce a healthy LTV:CAC ratio of 3:1 or better? If yes, your lead acquisition cost is fine - even if it looks "high" on paper.
What Is Cost Per Lead?
CPL measures how much you spend to generate one lead. Not a page view. Not a click. A person who raised their hand and gave you their email, phone number, or booked time with your team.
This metric pulls double duty. It's a performance indicator and an ad pricing model. When you buy leads on a CPL model, you pay a fixed price per lead delivered regardless of impressions or clicks. When you use it as a metric, you're dividing spend by leads. Don't confuse the two.
Every CPL conversation should start with defining what counts as a "lead." A gated whitepaper download and a demo request are both "leads," but they're not remotely equal - and treating them the same way in your reporting will mislead everyone who reads the dashboard.
How CPL Works
Basic Formula
CPL = Total Marketing Spend / Total Leads Generated
Spend $10,000 on a campaign, generate 200 leads, your CPL is $50. Simple. That's where most teams stop. The useful version breaks this down by channel:
CPL by Channel = Channel-Specific Spend / Leads from That Channel
Your Google Ads CPL and your organic content CPL will look completely different - and they should, because the lead quality profiles are different too. Quick example: your LinkedIn campaign costs $5,000 and generates 45 leads. That's a $111 CPL. Expensive? Only if those leads don't close.
Cost per MQL and Cost per SQL
CPL gets more honest when you push it deeper into the funnel.
Cost per MQL = Total Marketing Spend / Number of MQLs. So $5,000 spend with 40 MQLs = $125 per MQL.
Cost per SQL = Total Marketing + Sales Spend / Number of SQLs. That's $10,000 combined spend with 50 SQLs = $200 per SQL.
The gap between CPL and cost per SQL is where most marketing teams lose the plot. A $20 CPL that produces $400 SQLs isn't cheap. It's just hiding the cost downstream.
"True CPL": What Most Calculations Miss
Most CPL calculations only count ad spend. They ignore labor, tools, data subscriptions, and infrastructure. That's like calculating your restaurant's food cost without including rent.
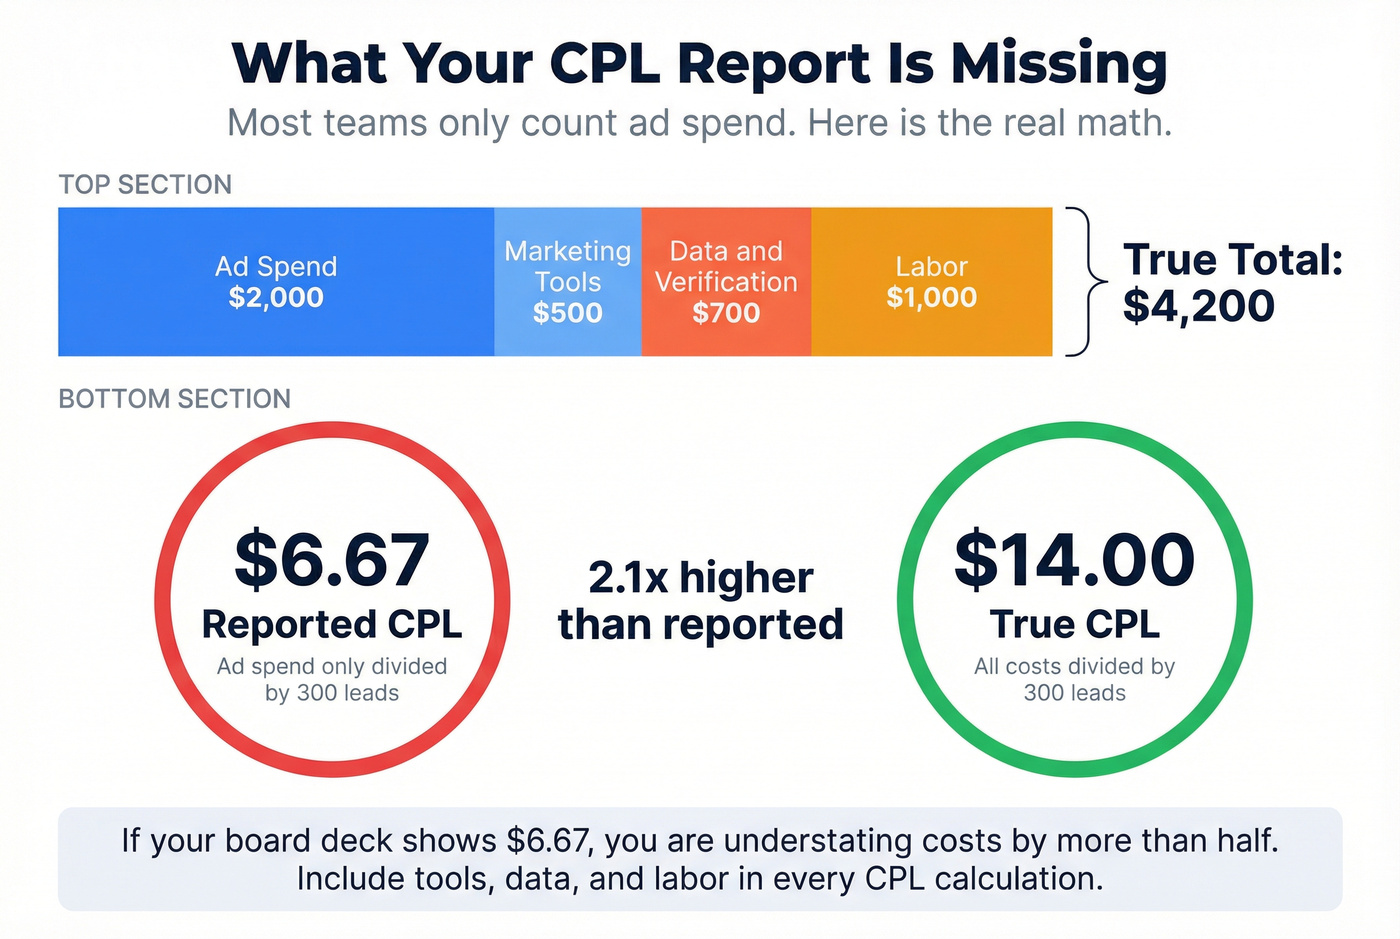
A more honest calculation: $2,000 in ad spend + $500 in marketing tools + $700 in data and contact verification + $1,000 in labor = $4,200 true total cost. Divide by 300 leads and your true CPL is $14 - not the $6.67 you'd get from ad spend alone. More than double. And most teams are running the $6.67 version in their board decks.
Average CPL by Industry (2026 Benchmarks)
Industry is the single biggest variable. The First Page Sage benchmark report covering 30 industries makes this clear. Organic CPL runs lower than paid across most verticals, which is why content marketing keeps getting budget even when attribution is messy.
| Industry | Paid CPL | Organic CPL | Blended CPL |
|---|---|---|---|
| Higher Education | $1,261 | $705 | $982 |
| Financial Services | $761 | $555 | $653 |
| Legal Services | $784 | $516 | $649 |
| Manufacturing | $691 | $415 | $553 |
| Oil & Gas | $505 | $345 | $425 |
| Healthcare | $401 | $320 | $361 |
| IT & Services | $370 | $196 | $283 |
| Cybersecurity | $345 | $198 | $272 |
| Telecom | $315 | $190 | $253 |
| B2B SaaS | $310 | $164 | $237 |
| Real Estate | $280 | $160 | $220 |
| HVAC | $115 | $69 | $92 |
| eCommerce | $98 | $83 | $91 |
Stop comparing your B2B SaaS CPL to an eCommerce benchmark. The deal sizes, sales cycles, and buyer complexity are completely different. A $237 blended CPL in B2B SaaS is normal. If you're hitting $91, you're either in eCommerce or you're not counting everything.
Remember that "true CPL" calculation above - where data and contact verification added $700 to your real costs? Prospeo cuts that line item to near zero waste. At $0.01 per email with 98% verified accuracy, your leads actually reach inboxes instead of inflating bounce rates and destroying your funnel math.
Stop paying for leads that bounce. Start with 75 free verified emails.
CPL by Channel
Channel choice drives lead acquisition costs as much as industry does. But raw CPL by channel is misleading without considering lead intent - a $15 Facebook lead and a $200 LinkedIn lead aren't the same animal.
| Channel | CPL Range | Lead Intent | Best For |
|---|---|---|---|
| Google Ads | ~$70 avg B2B, up to $819 | High | Capturing active demand |
| Facebook/Meta | $10-$50+ | Low-Medium | Awareness, retargeting |
| LinkedIn Ads | $50-$200+ (~$110+ avg B2B) | Medium-High | B2B targeting by title |
| Email (warm list) | $5-$25 | Medium-High | Nurture, re-engagement |
| SEO/Content | Typically below paid over time | Medium-High | Long-term compounding |
| Events/Trade Shows | $200-$1,000+ | High | Enterprise, relationship |
Google Ads CPL swings wildly by vertical - B2C leisure can run $70 while B2B manufacturing hits $819. LinkedIn is the most expensive mainstream digital channel, and it's often worth it. Inbound leads convert at roughly 14.6%, while cold outreach converts at about 1.7%. That $110 CPL looks a lot different when you factor in close rates.
SEO and content marketing produce the lowest CPL over time, but they take months to ramp. Expect 3-6 months for meaningful traction and 6-12 months to compound. If you need leads next month, organic isn't the answer. If you need leads next year at scale, it's the best investment you'll make.
CPL vs CPA vs CAC
These three get confused constantly. Here's the clean version.
| CPL | CPA | CAC | |
|---|---|---|---|
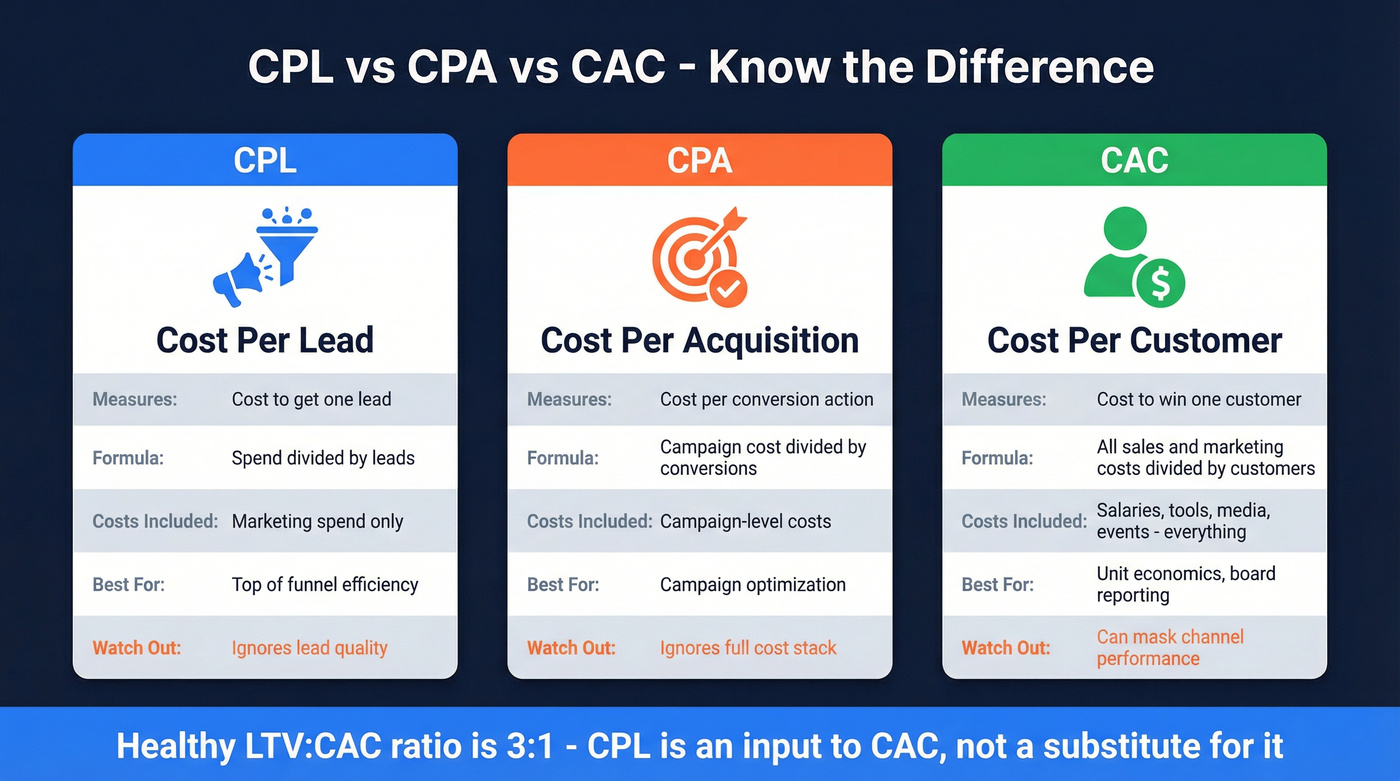
| Measures | Cost per lead | Cost per conversion | Cost per customer |
| Formula | Spend / leads | Campaign cost / conversions | All S&M costs / customers |
| Costs included | Marketing spend | Campaign-level costs | Salaries, tools, media, events |
| When to use | Top-of-funnel efficiency | Campaign optimization | Unit economics, board reporting |
| Limitation | Ignores lead quality | Ignores full cost stack | Can mask channel performance |
The critical relationship: a healthy LTV:CAC ratio is 3:1. If your customer lifetime value is $12,000, your CAC should stay under $4,000. CPL is an input to CAC, not a substitute for it.
What Is a "Good" Cost Per Lead?
There's no universal answer. There's only CPL that makes your funnel math work.
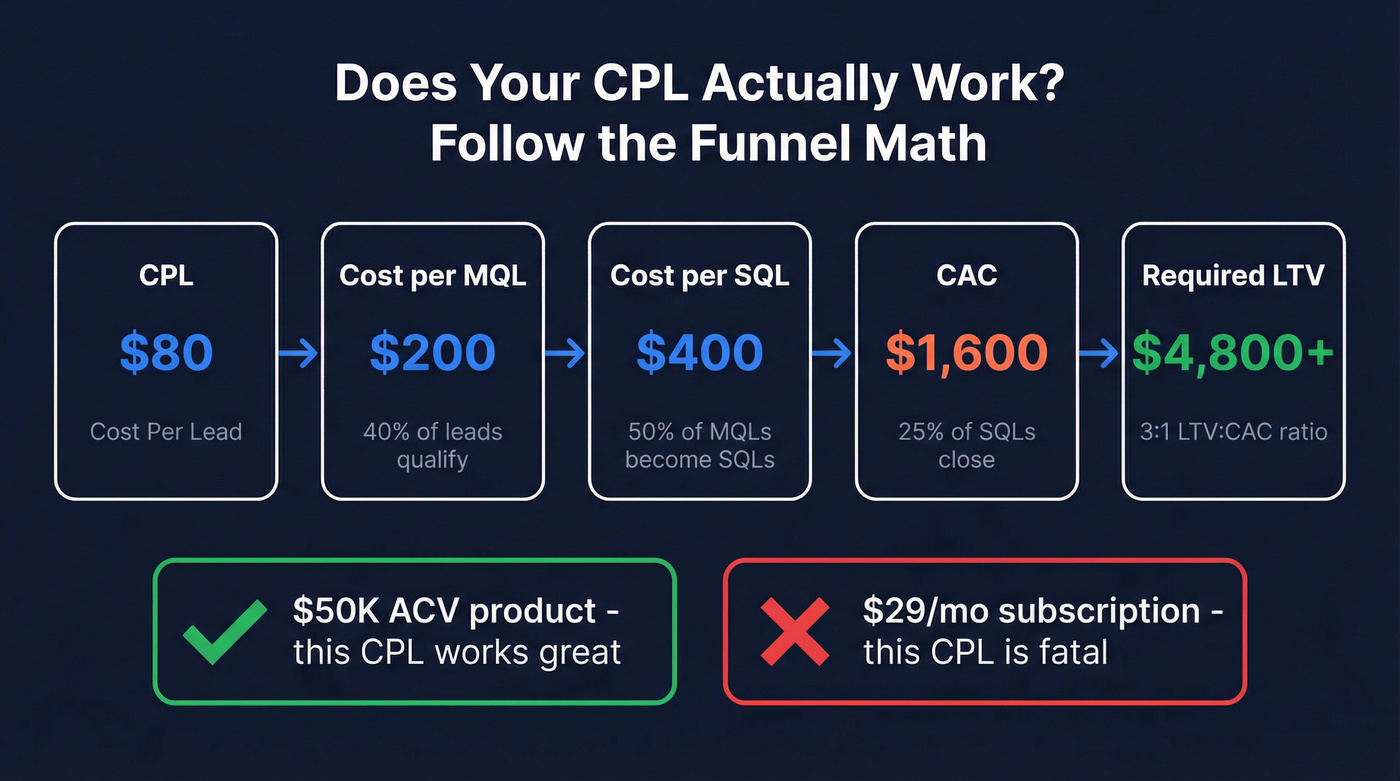
Start with an $80 CPL. If 40% of those leads qualify as MQLs, your cost per MQL is $200. If 50% of MQLs become SQLs, you're at $400 per SQL. If 25% of SQLs close, your CAC is $1,600. To hit a 3:1 LTV:CAC ratio, you need at least $4,800 in customer lifetime value. For a $50K ACV product, that's easy. For a $29/month subscription, it's fatal.
Here's the thing: if your annual contract value is under five figures, you probably don't need to obsess over CPL at all. At that deal size, the conversion rate from lead to customer matters 5x more than the price of acquiring the lead. A team with a $50 CPL and 15% close rate crushes a team with a $15 CPL and 2% close rate. Every single time.
A $200 CPL is excellent if your deal size supports it. A $15 CPL is garbage if those leads never convert.
The Cheap Lead Trap
The most dangerous CPL is a low one that makes everyone feel good while the pipeline quietly dies.
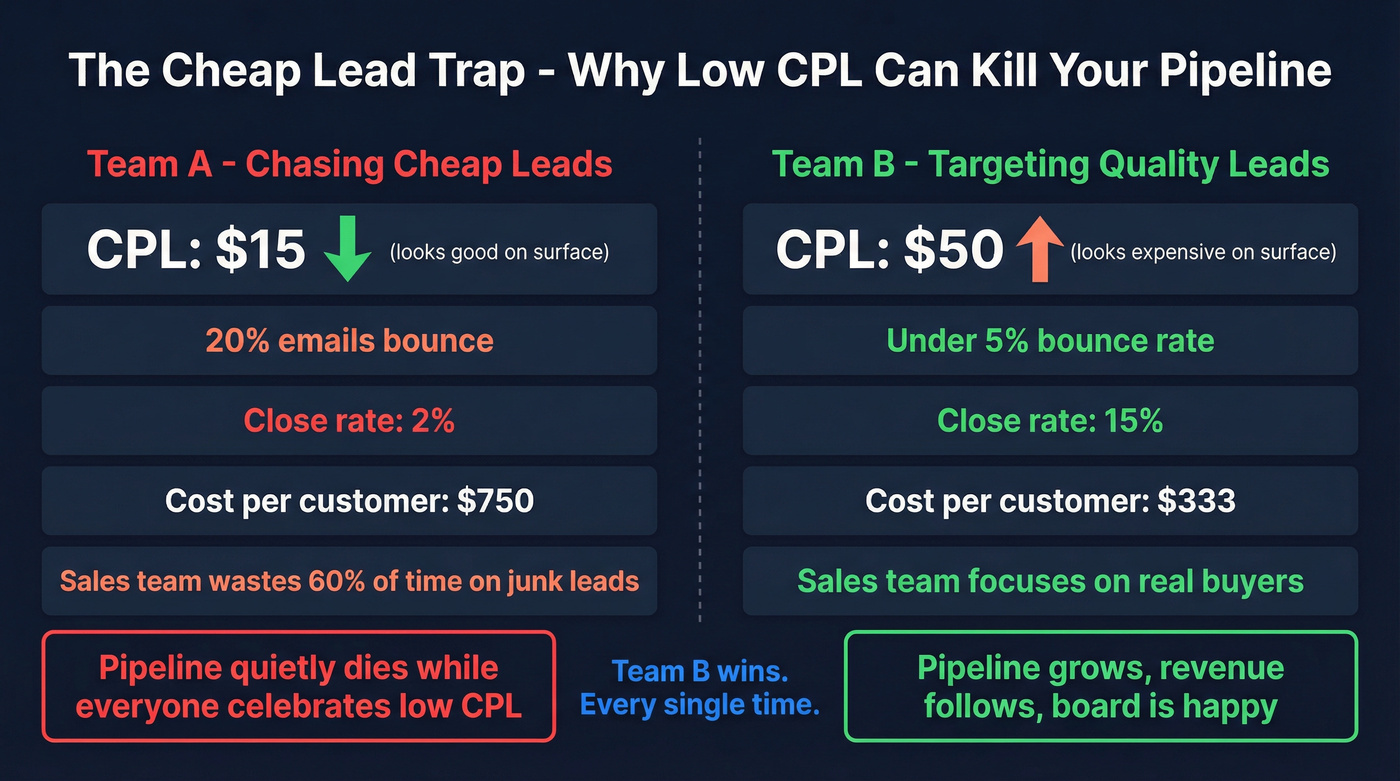
We've watched this play out repeatedly. A team optimizes for volume, drives CPL down to $15, and celebrates. Then the SDRs report that half the emails bounce and the other half are people who downloaded a whitepaper with zero buying intent. The $15 CPL is actually $30 when you account for the bad data - and the cost per qualified opportunity is through the roof.
This is a constant debate in sales and marketing communities on Reddit, and the practitioner consensus has shifted hard: CPL without downstream qualification data is a vanity metric. The data backs it up. Narrowing targeting from broad segments to specific ICP criteria produces a 45% increase in lead-to-opportunity conversion. If your Sales Acceptance Rate is consistently below 75%, your lead definitions are probably wrong.
Data quality is the hidden CPL multiplier. If 20% of captured emails are invalid - typos, spam traps, abandoned inboxes - your effective CPL is 25% higher than reported, and your sender reputation takes the hit. Snyk's 50-AE team cut bounce rates from 35-40% to under 5% after switching to Prospeo for verified contact data, effectively reducing their true CPL by a third overnight.
Let's be honest: stop obsessing over CPL. Track cost per qualified opportunity instead. That's the number that actually predicts revenue.
How to Reduce CPL Without Killing Quality
Cutting CPL is easy. Cutting it while maintaining lead quality is the actual challenge.
Tighten your audience, not your budget. Broad targeting is the #1 CPL inflator. Narrow by job title, company size, technographics, and intent signals. You'll get fewer leads at a higher CPL, but your cost per opportunity will drop. We've seen teams panic over a rising CPL number while their pipeline value doubled because they were finally reaching the right people.
Fix your landing pages. Most landing pages lose the majority of paid clicks before conversion. A 20% lift in conversion rate cuts CPL by roughly 17% without touching ad spend. That's $100 down to about $83 for free.
Audit your attribution model. Bad attribution inflates CPL on some channels and hides it on others. One documented example: email influenced 13% of closed deals but received credit for only 4% - a 9-point visibility gap. Add "how did you hear about us?" to your intake forms. You might discover your "expensive" channel is actually your most efficient one.
Rebuild your MQL scoring from revenue data. Audit your last 50 closed-won deals and map their touchpoints. Most MQL models are built on assumptions, not patterns from actual buyers. Rebuilding scoring from closed-won data often surfaces lead sources you've been undervaluing for months.
Go long-tail on keywords. Broad keywords in Google Ads drive up CPC and attract low-intent clicks. "ERP software for mid-market manufacturing" beats "ERP software" every time - lower cost, higher conversion.
Refresh creative and test bid strategies together. Ad fatigue kills CPL silently. If you're repeatedly serving the same ads to the same audience, swap creative. At the same time, run 2-week bid strategy tests comparing manual CPC, target CPA, and maximize conversions. Teams often cut CPL just by switching bid strategies on the same campaigns.
Verify your contact data before launching campaigns. If 20% of emails bounce, your real CPL is 25% higher than reported and your domain reputation takes the hit. Email verification before you send is the simplest fix. Prospeo verifies emails in real time with 98% accuracy, so every lead you pay for is actually reachable. At roughly $0.01 per verified email, it's the cheapest CPL reduction lever available.
The gap between your CPL and cost per SQL widens every time bad data kills a conversation. Prospeo's 300M+ profiles, refreshed every 7 days, mean your outbound connects with real buyers - not dead emails. Teams using Prospeo book 35% more meetings than Apollo users at a fraction of the cost.
Fix the data layer and your CPL-to-revenue math fixes itself.
FAQ
What is cost per lead?
Cost per lead is the total marketing spend divided by the number of leads generated. It serves as both a top-of-funnel efficiency metric and a pricing model for paid media campaigns. The global average sits around $198, but meaningful benchmarks vary dramatically by industry, channel, and how you define "lead."
What's a good CPL for B2B?
Average B2B CPL is $84 across channels, but "good" depends entirely on deal size and close rate. A $200 CPL is fine if your average contract is $50K; it's fatal for a $29/month product. Benchmark against your LTV:CAC ratio, not industry averages.
How is CPL different from CPC?
CPC measures what you pay per click. CPL measures what you pay for a lead who provides contact information. Many clicks never become leads, so CPL is always higher. A $2.69 average CPC on Google Ads translates to roughly $70 CPL once you factor in landing page conversion rates.
Should I optimize for CPL or CAC?
CAC. CPL is a top-of-funnel input; CAC tells you what a paying customer actually costs. A team with a $15 CPL and 2% close rate pays more per customer than a team with a $50 CPL and 15% close rate. Optimize CPL as a lever, but report on CAC.
How does data quality affect CPL?
Directly. If 20% of captured emails are invalid, your effective CPL is 25% higher than reported. Verifying contacts before campaigns launch eliminates this hidden cost and protects your sender reputation at the same time.