Customer Acquisition Metrics That Actually Matter (and the Benchmarks to Prove It)
Your CAC didn't double because your team got worse. It doubled because every channel got more expensive, attribution got murkier, and most teams are still measuring the wrong customer acquisition metrics. CAC rose 40-60% from 2023 to 2025 across B2B, and the teams panicking about it are usually the ones reporting a single blended number to the board without any channel breakdown.
You don't have a CAC problem. You have a measurement problem. Fix the measurement, and the "problem" often shrinks by 20-30% on its own.
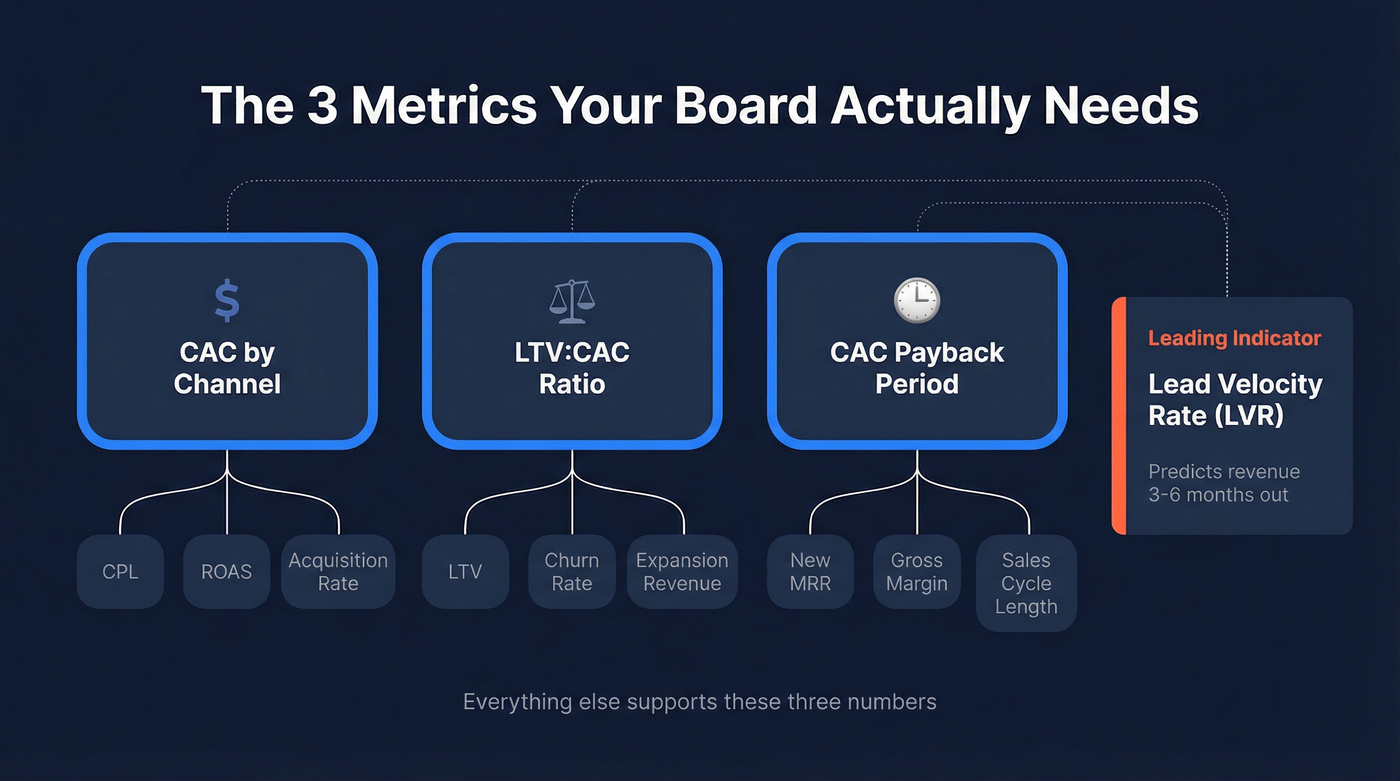
The Three Numbers Your Board Actually Needs
CAC by channel, LTV:CAC ratio, and CAC payback period. Everything else supports those three. If you only track one leading indicator, make it Lead Velocity Rate - it predicts revenue 3-6 months out and almost nobody on your team is watching it. These benchmarks skew toward companies in the $10M-$1B revenue range (78% of the dataset). Sub-$10M? Expect higher CAC and longer payback periods.
10 Metrics to Measure Customer Acquisition
Here's the quick-scan version before we break each one down:
| Metric | Formula | B2B SaaS Benchmark |
|---|---|---|
| CAC | S&M spend / new customers | ~$300 blended |
| CPL | S&M spend / leads | $327 organic / $458 paid |
| LTV | (MRR x Gross Margin) / Churn | Varies by vertical |
| LTV:CAC | LTV / CAC | 4:1 median; 6:1 top performers |
| CAC Payback | S&M / (New MRR x GM) | <12mo SMB; <18 MM; <24 Ent |
| LVR | MoM qualified lead growth | 10-20% MoM |
| Conversion (Lead to Win) | Won deals / total leads | 3.7% |
| Churn | Lost customers / total | 8.5% annual (overall B2B) |
| Acquisition Rate | New customers / prospects contacted | Varies by channel |
| ROAS | Revenue / ad spend | Often inflated |
Customer Acquisition Cost (CAC)
Everyone calculates this. Almost nobody calculates it correctly.
Total sales and marketing spend divided by new customers acquired in the same period - but "total spend" is where teams cheat. Optifai's Sales Ops Benchmark (N=939 companies, Q1-Q3 2025) puts average blended CAC at $300. That sounds manageable until you realize your referral channel runs $150 while outbound costs up to $1,980. Those aren't the same number, and blending them together hides the channels bleeding you dry. The CAC figure alone tells you what you spent - pairing it with LTV tells you whether that spend was worth it.
Cost Per Lead (CPL)
Skip this metric if you aren't pairing it with downstream conversion data. A $50 CPL that converts at 1% is worse than a $500 CPL that converts at 15%.
Across 140+ B2B campaigns, organic CPL averages $327 and paid runs $458. The number only matters in context of what those leads actually become.
Customer Lifetime Value (LTV)
For recurring revenue businesses: (MRR x Gross Margin) / Churn Rate.
LTV varies wildly by vertical and contract structure, which is exactly why it matters - it's the denominator that makes CAC meaningful. The single highest-leverage move for improving LTV isn't acquiring better customers. It's reducing churn by even one or two percentage points, because the compounding effect on your unit economics is enormous. We've seen a 2-point churn reduction turn a borderline-unprofitable segment into the company's best cohort.
LTV:CAC Ratio
The commonly cited floor is 3:1. The benchmark from 140+ B2B campaigns is 4:1, and top SaaS companies hit 6:1 while fintech reaches 7:1.
Below 1:1 means you're losing money on every customer. Above 6:1 sounds great until you realize it often signals you're under-investing in growth and leaving revenue on the table. Early-stage companies still finding product-market fit often operate below 3:1 - that's expected, not alarming. Aim for 4:1 to 6:1 as a healthy operating range. (If you want a deeper breakdown, see our CAC LTV Ratio guide.)
Lead Velocity Rate (LVR)
Here's the thing: this is the single best leading indicator of future revenue, and it's the metric nobody talks about. Month-over-month growth in qualified leads.
For early-stage B2B SaaS, target 10-20% MoM growth in qualified pipeline. If LVR is flat or declining, your revenue will follow in 3-6 months - regardless of what your CAC looks like today. If your exec team reviews CAC monthly but has never discussed LVR, your reporting is backward. Lagging indicators tell you what happened. LVR tells you what's about to happen.
CAC Payback Period
The BVP formula: prior quarter S&M expense divided by (net new MRR x gross margin).
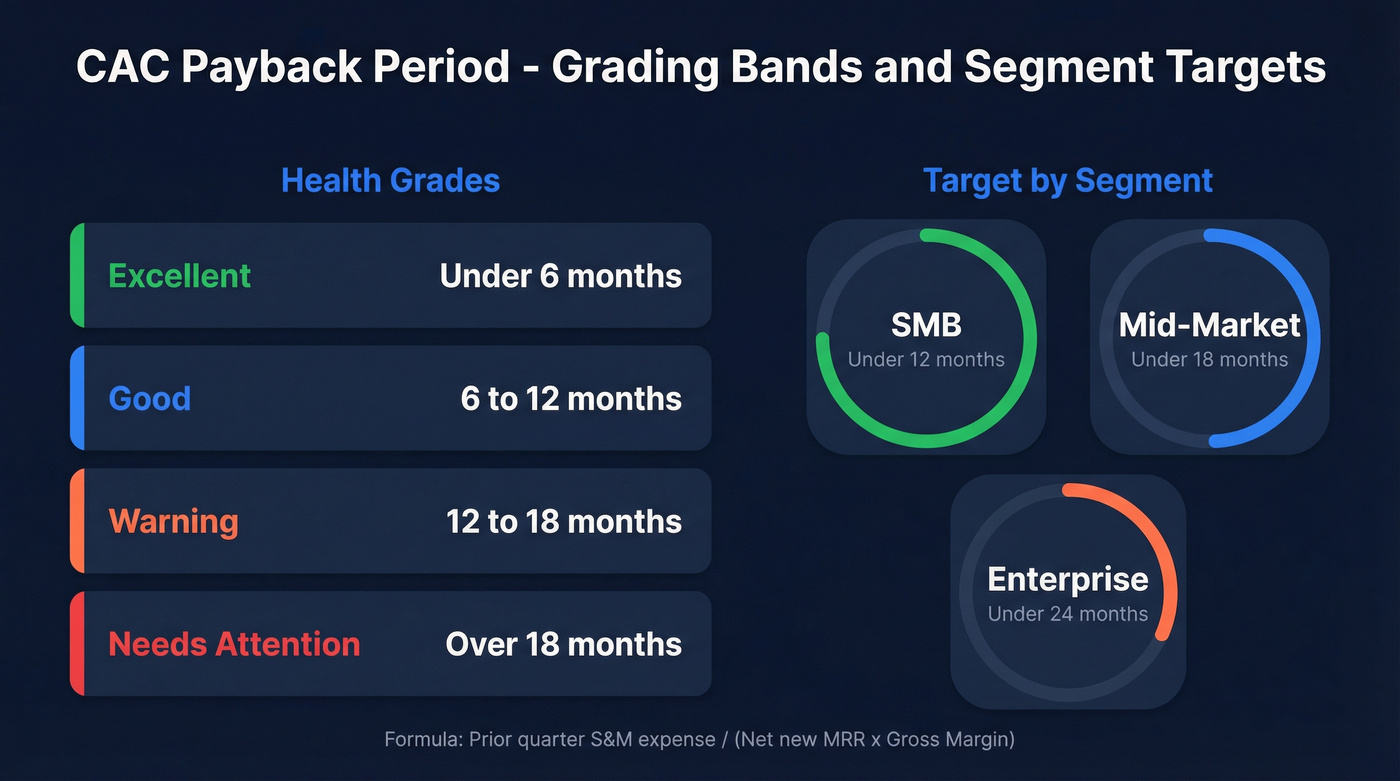
Target benchmarks by segment: SMB under 12 months, mid-market under 18, enterprise under 24. The grading bands we use internally: excellent is under 6 months, good is 6-12, warning is 12-18, and anything over 18 months needs immediate attention. Sales cycle length matters here too. If your average deal takes 90 days but your CAC calculation uses monthly periods, you're misattributing costs and the payback number is fiction.
Conversion Rate (by Funnel Stage)
Stage-by-stage benchmarks from 140+ B2B campaigns:
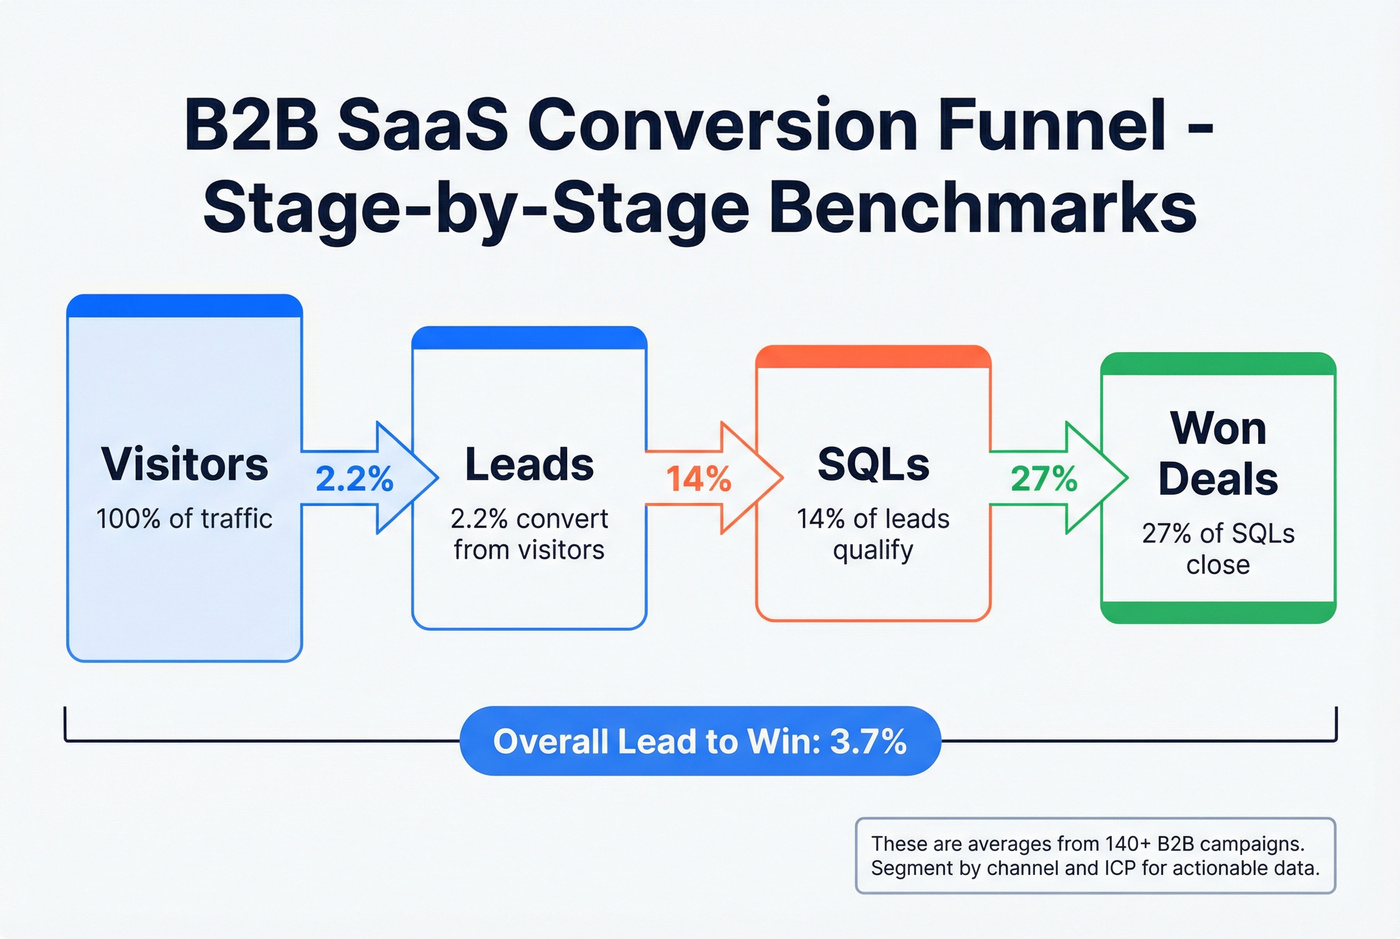
- Visitor to Lead: 2.2%
- Lead to SQL: 14%
- SQL to Win: 27%
- Lead to Win: 3.7%
These are averages - your numbers should be segmented by channel and ICP. A 3.7% lead-to-win rate from inbound content and a 3.7% rate from cold outbound represent very different economics. Multi-touch attribution makes this messier, but even imperfect stage-by-stage tracking beats a single top-of-funnel number. (If you need a clean setup, start with CRM lead source tracking.)
Churn Rate
Annual B2B benchmark: 8.5% overall. SaaS runs around 6%, and fintech and cybersecurity both sit at roughly 4%.
If your churn is above 10% annually, improving it will do more for your unit economics than any acquisition optimization. We've watched teams obsess over CAC while losing 15% of their base annually out the back door. Net revenue retention is the more sophisticated version of this metric - it accounts for expansion revenue, not just logos lost.
Customer Acquisition Rate
New customers divided by total prospects contacted. This metric pairs with CAC to tell you whether you're efficient, not just cheap. A low CAC with a terrible acquisition rate means you're just not spending enough - not that you've cracked the code.
ROAS / Return on Ad Spend
Revenue generated divided by ad spend. Only 25% of marketers measure incrementality. The other 75% optimize toward inflated ROAS numbers because they're counting conversions that would've happened anyway. If you aren't running holdout tests, treat your ROAS with skepticism.
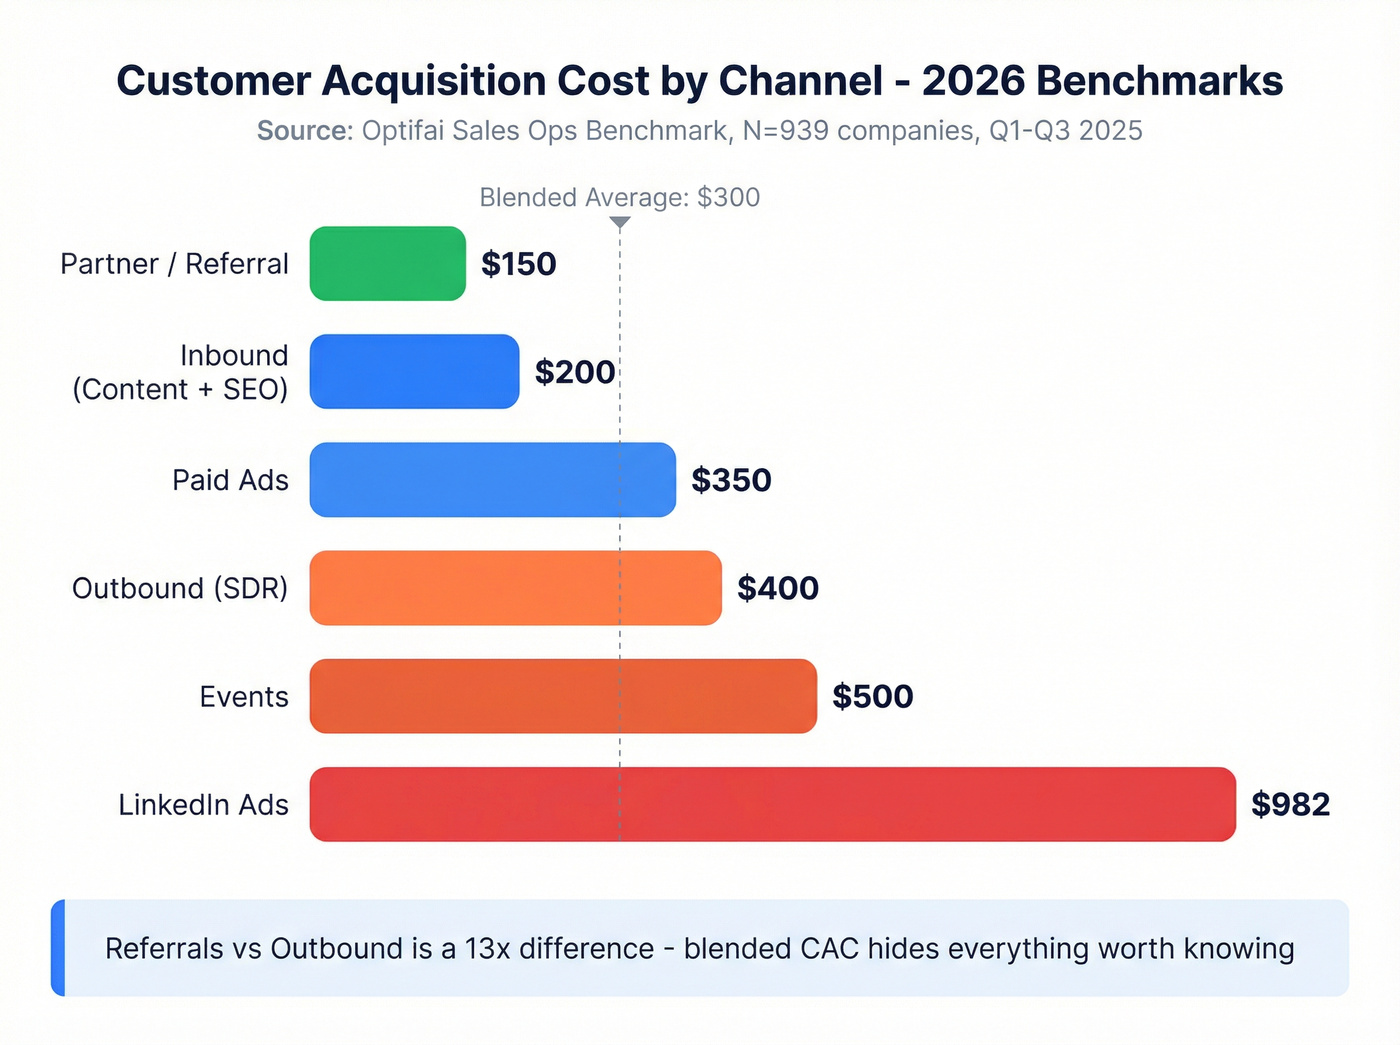
CAC by Channel - 2026 Benchmarks
Channel-level CAC is where the real story lives. Blended numbers hide everything worth knowing about your acquisition engine.
| Channel | Optifai (N=939, Q1-Q3 2025) | Phoenix Strategy (SEO/paid specific) |
|---|---|---|
| Inbound (content + SEO) | $200 | $480-$942 (organic SEO only) |
| Outbound (SDR) | $400 | Up to $1,980 |
| Partner / Referral | $150 | $150 |
| Paid Ads | $350 | $802 (search) |
| Events | $500 | - |
| LinkedIn Ads | - | $982 |
| Facebook Ads | - | $230 |
The spread between channels is massive. Referrals at $150 versus outbound at $1,980 is a 13x difference - and that's exactly why blended CAC is a vanity metric. It hides the channels that are working and subsidizes the ones that aren't.
Segment ranges tell a similar story: SMB SaaS runs $150-250, mid-market $300-500, and enterprise $800-1,500. For a balanced acquisition engine, we typically recommend roughly 30% inbound, 25% partnerships, 20% paid, 15% outbound, and 10% events - though your mix should follow your data, not a template. (For a practical framework, see sales by channel.)
Outbound CAC hits $1,980 when your data bounces. Prospeo's 98% email accuracy and 30% mobile pickup rate cut wasted spend from every outbound touch. Teams using Prospeo book 35% more meetings than Apollo users - that's a direct hit to your CAC payback period.
Fix your data and your CAC fixes itself.
CAC by Industry
Industry context matters because a $700 CAC is catastrophic in eCommerce and perfectly normal in financial services.
| Industry | Organic CAC | Inorganic CAC | Combined |
|---|---|---|---|
| B2B SaaS | $205 | $341 | $239 |
| Legal Services | $584 | $1,245 | $749 |
| Financial Services | $644 | $1,202 | $784 |
| Manufacturing | $662 | $905 | $723 |
| Education | $862 | $1,985 | $1,143 |
This data comes from First Page Sage's B2B dataset, covering Jan 2022-Aug 2025, weighted 75% organic and 25% inorganic. It excludes email, events, and direct mail channels - adjust if your channel split looks different.
The B2B versus B2C gap is worth flagging for startups: SaaS B2B CAC runs $273 versus $166 for B2C. Financial services is even more dramatic - $923 B2B versus $173 B2C. If you're benchmarking against "industry averages" without specifying B2B or B2C, your numbers are meaningless.
5 Mistakes That Wreck Your KPIs
Reporting Blended CAC
When you report one number to the board, you lose the ability to make allocation decisions. Break it down by channel, every time. The consensus on r/SaaS is that blended CAC is the metric lazy finance teams love and growth teams hate - and they're right.
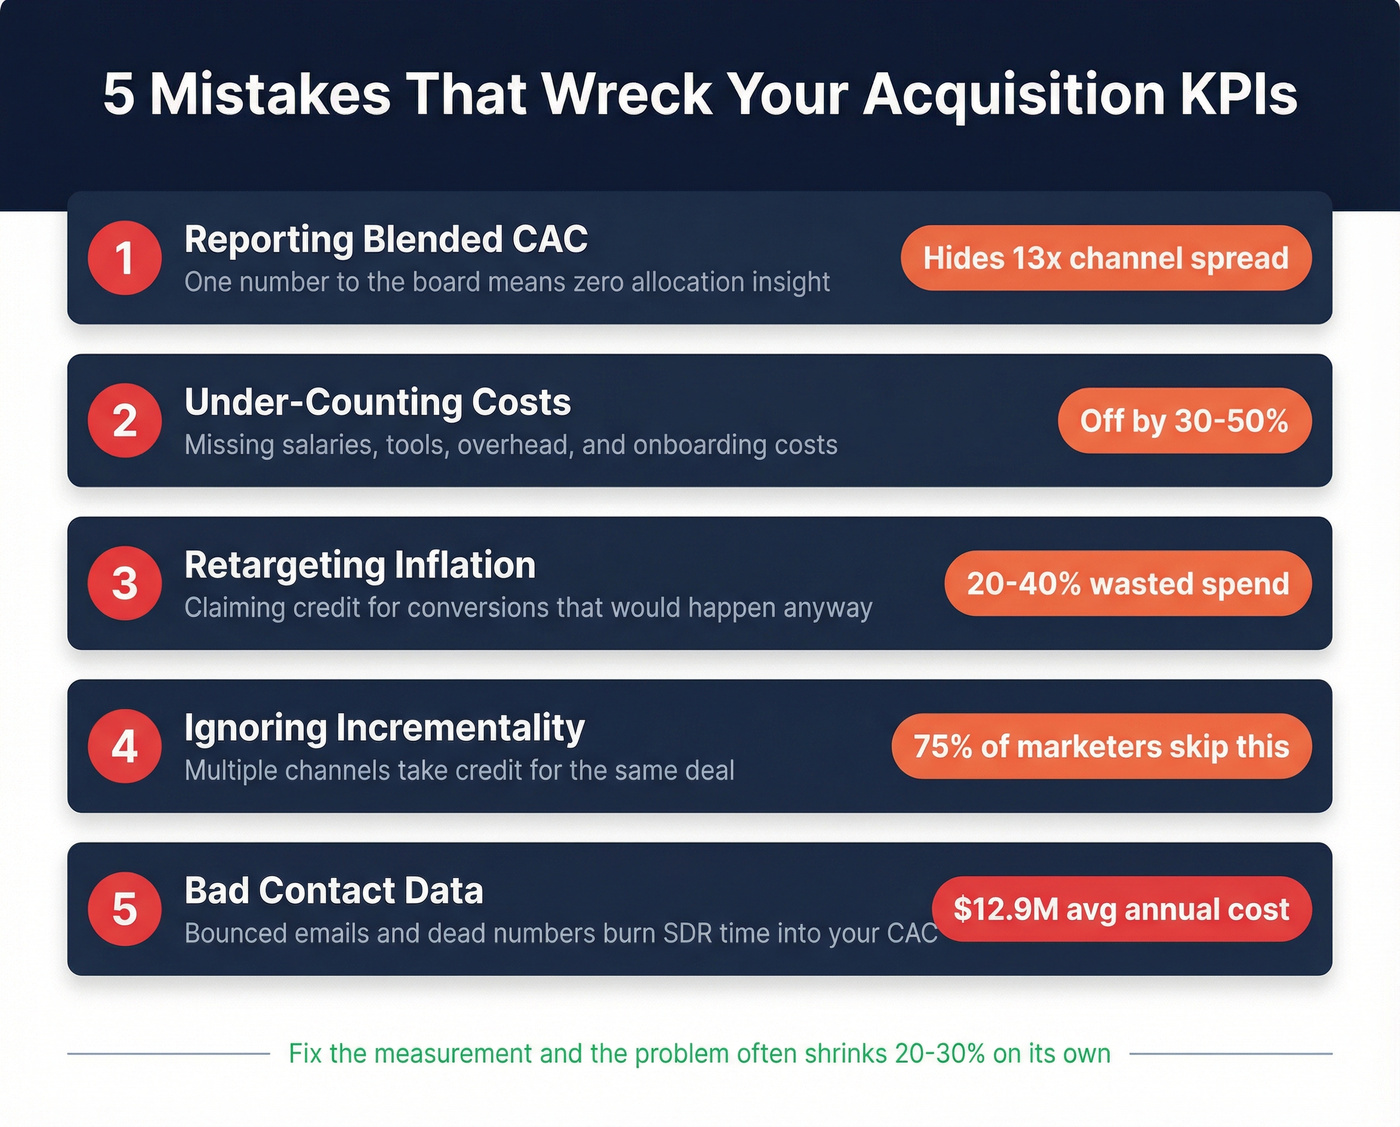
Under-Counting Costs by 30-50%
Most teams exclude salaries, tool subscriptions, overhead, and onboarding costs from their CAC calculation. If your SDRs cost $80k/year fully loaded and your sales tools run $15k/year per seat, that's real acquisition cost that belongs in the formula. We've audited CAC calculations that were off by 40% just from missing headcount. (To pressure-test your assumptions, use a cost of sales tech stack model.)
The perennial argument in finance teams is whether to include fully-loaded headcount. The answer is yes - always. If your CFO disagrees, ask them whether they'd exclude salaries from COGS.
Retargeting Inflation
Retargeting campaigns often contain 20-40% wastage within 30 days - campaigns claiming credit for conversions that would've happened organically. If your "prospecting" media buys have retargeting baked in, you're inflating performance numbers and making bad allocation decisions.
Ignoring Incrementality
Only 25% of marketers measure incrementality, per HubSpot's State of Marketing report. The other 75% optimize toward inflated ROAS because multiple channels claim credit for the same conversion. If you aren't running holdout tests or cohort analysis, your channel-level CAC numbers are wrong.
Bad Contact Data Inflating Outbound CAC
Every bounced email and disconnected phone number is wasted SDR time baked directly into your CAC. Gartner estimates the average cost of poor data quality at $12.9M per year. (If you want to quantify this, start with B2B contact data decay benchmarks.)
A healthy SDR books 5-25 meetings per month with a 60-80% show rate. If your reps are below those ranges, bad data is the most likely culprit - they're spending time on dead contacts instead of live conversations. Prospeo addresses this with 98% email accuracy and a 7-day data refresh cycle versus the 6-week industry average. Snyk's 50-person sales team saw bounce rates drop from 35-40% to under 5% after switching, and AE-sourced pipeline jumped 180%. That's not a data quality improvement. That's a CAC reduction. (If you're auditing your database, use a CRM hygiene checklist.)
LTV:CAC ratio stuck below 4:1? The fastest fix isn't spending less - it's reaching the right buyers. Prospeo's intent data tracks 15,000 topics so you target prospects already in-market, and 7-day data refresh means you're never burning budget on stale contacts.
Stop subsidizing dead channels with bad data.
How to Actually Track These KPIs
Let's be honest: most marketing dashboards fail. Nearly half of users rate theirs 3/5 or lower, and 72% end up exporting to Excel anyway. The problem isn't the tool - it's building dashboards around metrics instead of decisions.
The cadence that works: review channel-level CAC weekly, LTV:CAC monthly, and payback period quarterly. Weekly is too frequent for LTV:CAC because the inputs don't change fast enough. Quarterly is too slow for channel CAC because you'll miss spend problems for months.
Your tool stack doesn't need to be complicated. GA4 covers web analytics and conversion tracking. Your CRM tracks pipeline and closed-won attribution. For contact data quality, add a verification layer before records hit your CRM - otherwise you're tracking metrics built on dirty inputs. (A good starting point is CRM verify.) Companies with strong channel tracking see 15-20% marketing ROI improvement just from better allocation. (If you're rebuilding reporting, use an ABM reporting structure to keep it decision-first.)
FAQ
What's a good LTV:CAC ratio?
The median benchmark across B2B SaaS is 4:1, with top performers hitting 6:1 and fintech reaching 7:1. Below 1:1 means you're losing money per customer; above 6:1 often signals under-investment in growth. Aim for 4:1 to 6:1 as a healthy operating range.
How do you calculate CAC by channel?
Divide all sales and marketing costs attributable to a specific channel - ad spend, salaries, tools, overhead - by the number of customers acquired through that channel in the same period. Track blended and channel-level CAC separately; the channel-level view is where you'll find actionable optimization opportunities.
How does data quality affect acquisition costs?
Bad contact data inflates outbound CAC by wasting SDR time on bounced emails and disconnected numbers. If your bounce rate exceeds 5%, fixing your data source is the fastest path to lower costs.
Which acquisition KPIs should I report to the board?
Lead with three numbers: CAC by channel, LTV:CAC ratio, and CAC payback period. Add Lead Velocity Rate as a forward-looking indicator - it predicts revenue 3-6 months out. Boards don't need ten metrics; they need three that connect spend to sustainable growth.
The teams that win on acquisition economics aren't the ones with the lowest CAC. They're the ones who know exactly what each channel costs, track the right customer acquisition metrics, and cut the channels that don't earn their keep.