Demand Generation Metrics: Benchmarks and Framework for 2026
You're in a QBR. The CMO pulls up a slide with 14 KPIs, half of them green. Pipeline is flat. Nobody can explain why the numbers look good but revenue doesn't.
This is the measurement problem - and it's more common than anyone admits. If you could only track three demand generation metrics, make them pipeline velocity, marketing-sourced pipeline %, and CAC payback period. Everything else is a supporting detail.
Why Most Demand Gen Metrics Are Broken
92% of B2B buyers already have a vendor in mind before they start formal evaluation. First contact with sales doesn't happen until 61% of the buying journey is over. The average B2B buying cycle runs 10.1 months, the pre-contact favorite wins roughly 80% of deals, and the winning vendor sits on the buyer's "Day One shortlist" 95% of the time.
If your metrics are still anchored to MQL volume and website traffic, you're measuring a world that doesn't exist anymore.
B2B organizations waste 32% of their marketing spend on ineffective demand gen tactics. That's not a tools problem or a budget problem - it's a measurement problem. Teams track KPIs that make dashboards look healthy while pipeline stalls. Misaligned strategies lead to 47% longer sales cycles. That's the difference between closing in Q3 and closing in Q1 of next year - if you close at all.
So if your reporting doesn't measure whether you're making it onto that shortlist through brand awareness, content authority, and community presence, you're optimizing for the wrong thing entirely.
Pick 5-7 KPIs, Not 15
Most demand gen guides list 10-15 KPIs. When everything's a priority, nothing is. We've watched teams build dashboards with 20 metrics and still not know why pipeline dropped 30% last quarter.
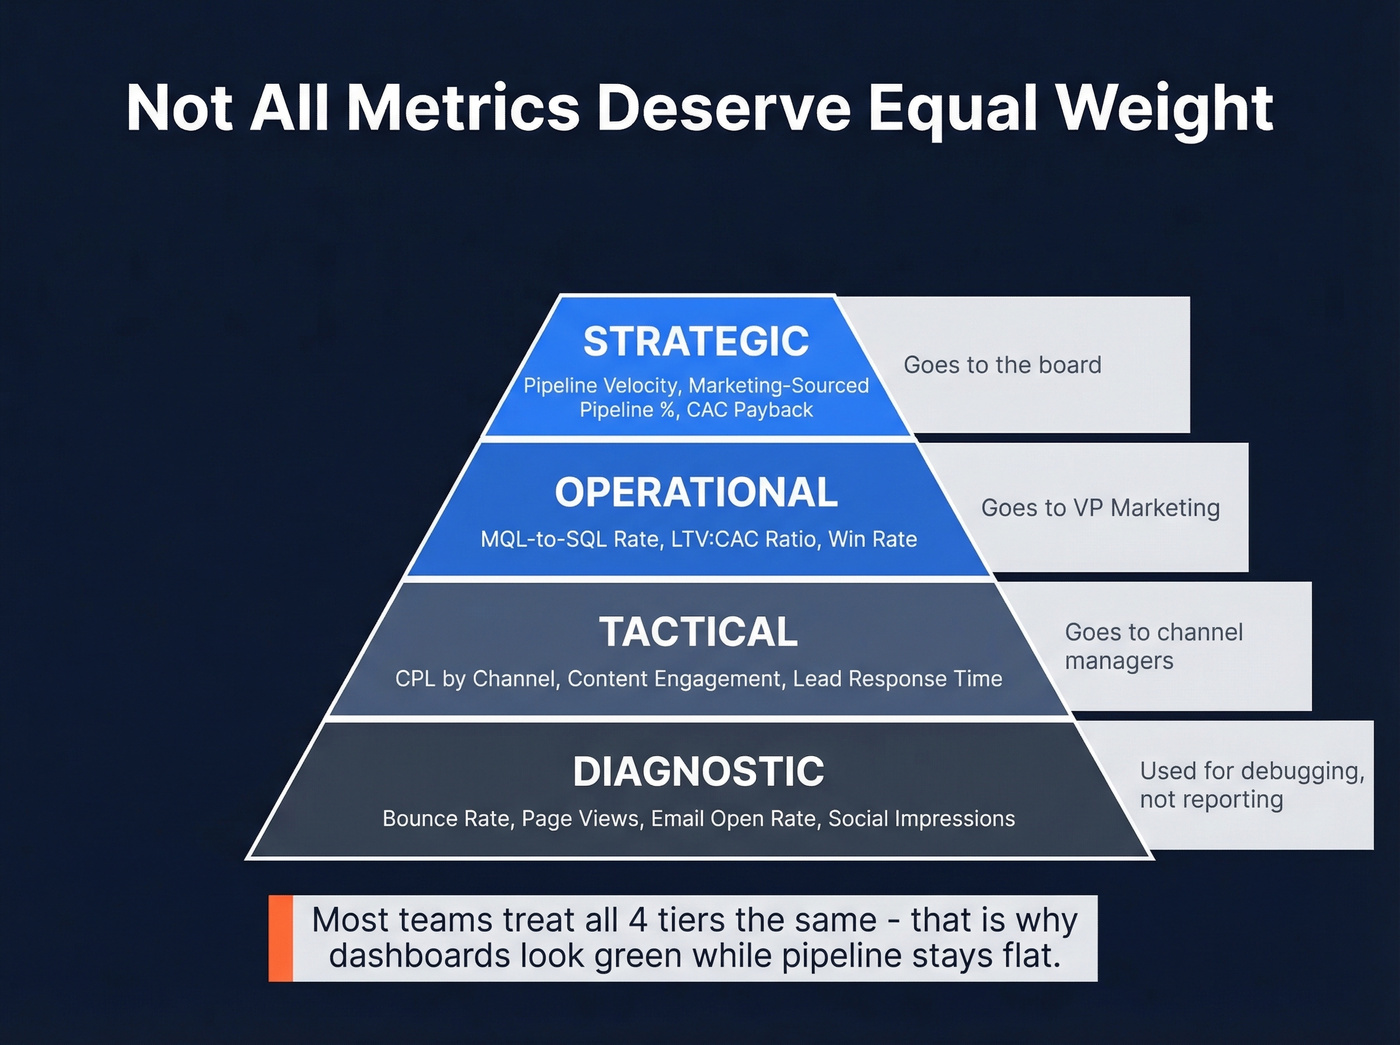
Organize metrics into four tiers: strategic, operational, tactical, and diagnostic. Strategic metrics go to the board. Tactical metrics go to channel managers. The mistake is treating them all with equal weight.
Your company stage determines which KPIs matter most. A Series A company with one SDR and a founder doing demos needs pipeline velocity, CAC, and conversion rate - full stop. A $100M ARR org with a 40-person marketing team needs attribution modeling, channel-level CPL, and LTV:CAC by segment. Trying to run the enterprise playbook at seed stage is how you end up with a beautiful dashboard and zero pipeline.
B2B Demand Generation Metrics by Funnel Stage
Top of Funnel: Myth vs. Reality
Myth: Total website traffic is a meaningful KPI. Reality: It isn't. We've seen teams celebrate a 200% traffic spike from a viral blog post that generated zero pipeline because none of those visitors matched the ICP. Vanity metrics feel good in Slack. They don't close deals.
What actually matters up top:
| Metric | Formula | Benchmark |
|---|---|---|
| ICP-qualified traffic | Sessions from target personas | 30-50% of total |
| Content engagement rate | Engaged sessions / total | 40-60% for gated |
| Brand search volume | Branded queries/month | Trending up QoQ |
Brand search volume is the sleeper metric here. If your demand gen is working, more people should be Googling your company name every quarter. Flat branded search means your "awareness" campaigns aren't creating awareness - they're creating impressions that evaporate.
Mid-Funnel Marketing Metrics
MQLs convert to SQLs about 13% of the time. If you're measuring success by MQL volume alone, you're celebrating a metric that fails 87% of the time.
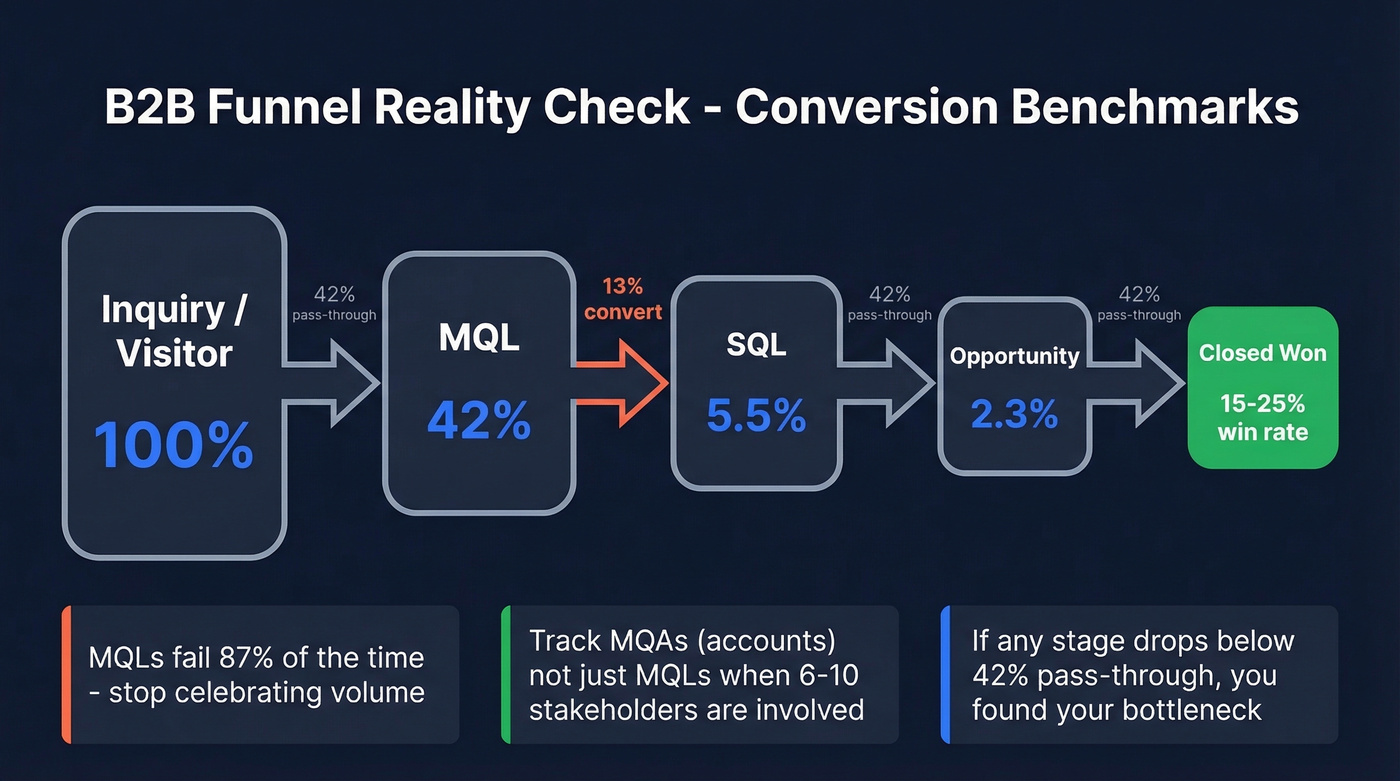
The smarter move is tracking conversion rates between stages. The average pass-through rate sits at 42% per stage from inquiry to close. If any stage drops below that, you've found your bottleneck.
| Metric | Formula | Benchmark |
|---|---|---|
| MQL-to-SQL rate | SQLs / MQLs | ~13% average |
| CPL by channel | Spend / leads per channel | Up ~23% over the past two years |
| Lead response time | First touch - lead creation | Under 5 minutes ideal |
| Stage pass-through | Leads advancing / entering | ~42% per stage |
One concept worth adopting: MQAs (Marketing Qualified Accounts) instead of MQLs. In committee-based buying with 6-10 stakeholders per deal, qualifying an account matters more than qualifying an individual lead. (If you're still building your funnel definitions, start with a B2B sales funnel template and adapt it to your motion.)
Bottom of Funnel
This is where marketing and sales share ownership - and where finger-pointing usually starts. Here's the thing: marketing owns pipeline creation, sales owns close rate, and both own cycle length. Practitioners on r/marketing regularly debate whether being measured on downstream outcomes like "second meeting with sales" reflects sales process quality more than marketing effectiveness. They're right to push back.
| Metric | Formula | Benchmark |
|---|---|---|
| Win rate | Closed-won / total opps | 15-25% B2B average |
| Sales cycle length | Opp created to closed-won | 10.1 months avg |
| Avg deal size | Revenue / closed deals | Segment-dependent |
If your sales cycle is getting longer and nobody can explain why, the answer is almost always misalignment between what marketing promises and what sales delivers.
Revenue Metrics: A Worked Example
CAC isn't the same as CPA. CPA is your cost to acquire a conversion - whatever you define as the "acquisition." CAC is the fully loaded cost to acquire a paying customer, including SDR/AE time, tools, content production, and agency fees. Conflating these is one of the most common reporting mistakes we see, and it makes every downstream calculation wrong.
Walk through it: you spend $10,000/month on demand gen. That generates $40,000 in new revenue. ROI = ($40,000 - $10,000) / $10,000 x 100 = 300%. That's the floor for high-performing teams - 300-500% is the benchmark range worth targeting.
The metrics that matter here: CAC payback (6-18 months for SaaS is healthy), LTV:CAC ratio (3:1 minimum), and marketing-sourced pipeline % (target 30-50%). If your LTV:CAC is below 3:1, you're subsidizing growth with cash you'll never recoup.
Let's be honest: most B2B teams track too many top-of-funnel metrics and not enough revenue metrics. If your dashboard has five traffic widgets and zero CAC payback tracking, you've built a vanity dashboard. Flip the ratio.
Pipeline Velocity - The Most UnderrATED KPI
Pipeline velocity captures the health of your entire revenue engine in one number:
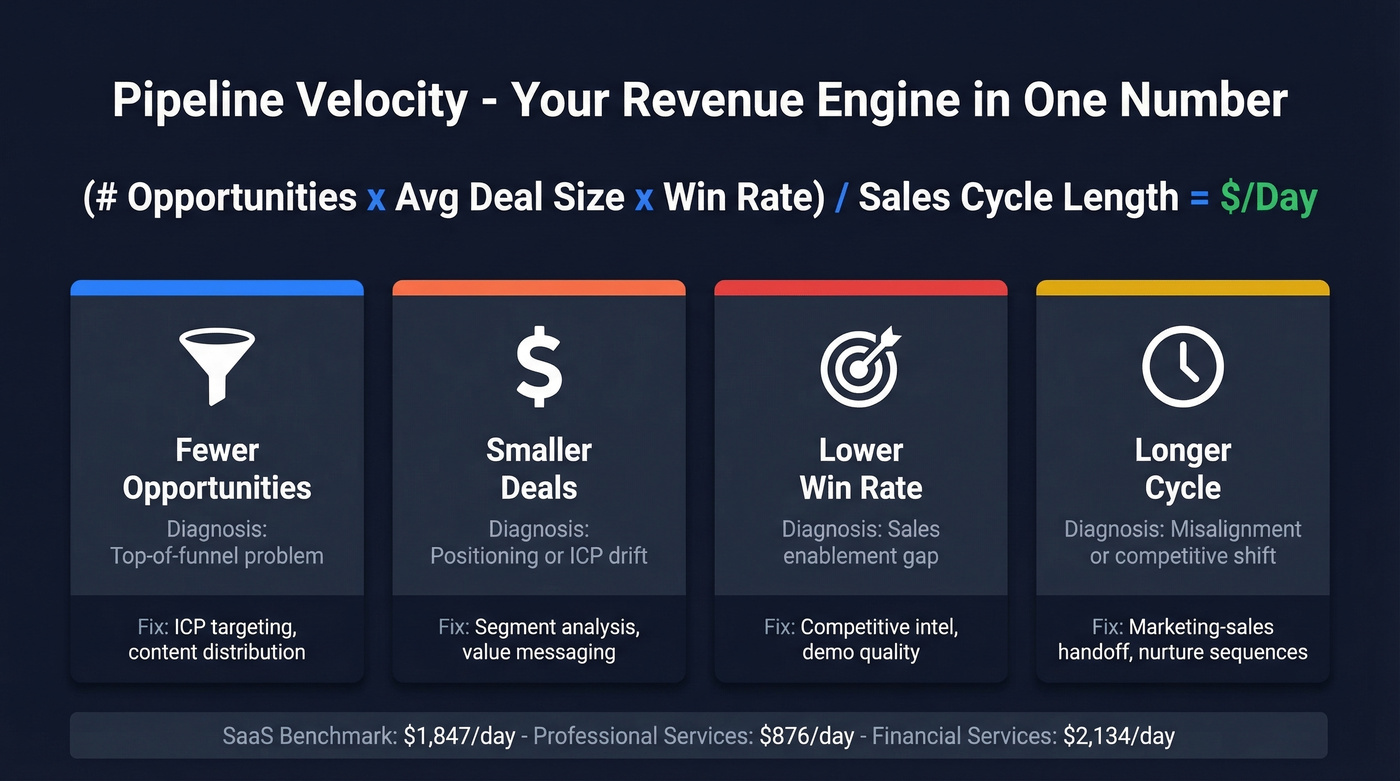
Pipeline Velocity = (# of Opportunities x Avg Deal Size x Win Rate) / Sales Cycle Length
If velocity drops, you can pinpoint which variable changed. Fewer opportunities? Top-of-funnel problem. Smaller deals? Positioning or ICP issue. Lower win rate? Sales enablement gap. Longer cycle? Misalignment or a competitive shift you haven't responded to.
A FirstPageSage study of 247 B2B organizations provides the most granular benchmarks available:
Pipeline Velocity by Industry
| Industry | $/Day | Median Deal | Win Rate | Cycle (Days) |
|---|---|---|---|---|
| SaaS & Technology | $1,847 | $12,400 | 22% | 67 |
| Financial Services | $2,134 | $31,200 | 18% | 89 |
| Healthcare & MedTech | $1,523 | $18,700 | 25% | 72 |
| Manufacturing | $1,289 | $47,800 | 19% | 124 |
| Professional Services | $876 | $8,900 | 28% | 51 |
| Real Estate & Construction | $2,456 | $89,300 | 16% | 147 |
| Marketing & Advertising | $743 | $15,200 | 24% | 58 |
Pipeline Velocity by Company Revenue
| Revenue Tier | Avg $/Day |
|---|---|
| $1M-$5M | $687 |
| $5M-$25M | $1,303 |
| $25M-$100M | $3,484 |
| $100M-$500M | $6,919 |
| $500M+ | $12,945 |
If you're a $10M SaaS company running $800/day in pipeline velocity, you're below the $1,303 benchmark for your revenue tier. That's a concrete signal to diagnose which lever is underperforming - not a reason to panic, but a reason to dig in. (For a broader view, compare against sales pipeline benchmarks and your own historical baselines.)
Your pipeline velocity formula is only as good as the data feeding it. Bad emails kill opportunities before they start - 35% bounce rates destroy sender reputation and inflate CAC. Prospeo delivers 98% email accuracy with a 7-day refresh cycle, so every opportunity in your pipeline connects to a real buyer.
Fix the input data and watch every demand gen metric improve downstream.
Attribution: How to Choose
| Model | How It Works | Best For | Limitation |
|---|---|---|---|
| First-touch | 100% to first touch | Short cycles, few touchpoints | Ignores nurture |
| Last-touch | 100% to final touch | Direct response campaigns | Ignores awareness |
| Linear | Equal across all touches | Simple multi-touch visibility | Overweights weak touches |
| Time-decay | More credit to recent touches | Long cycles, many touchpoints | Undervalues brand |
| U-shaped | 40/40/20 split | Balanced journey view | Arbitrary weighting |
| Algorithmic | ML-weighted by conversions | Enterprise with large datasets | Requires volume + tooling |
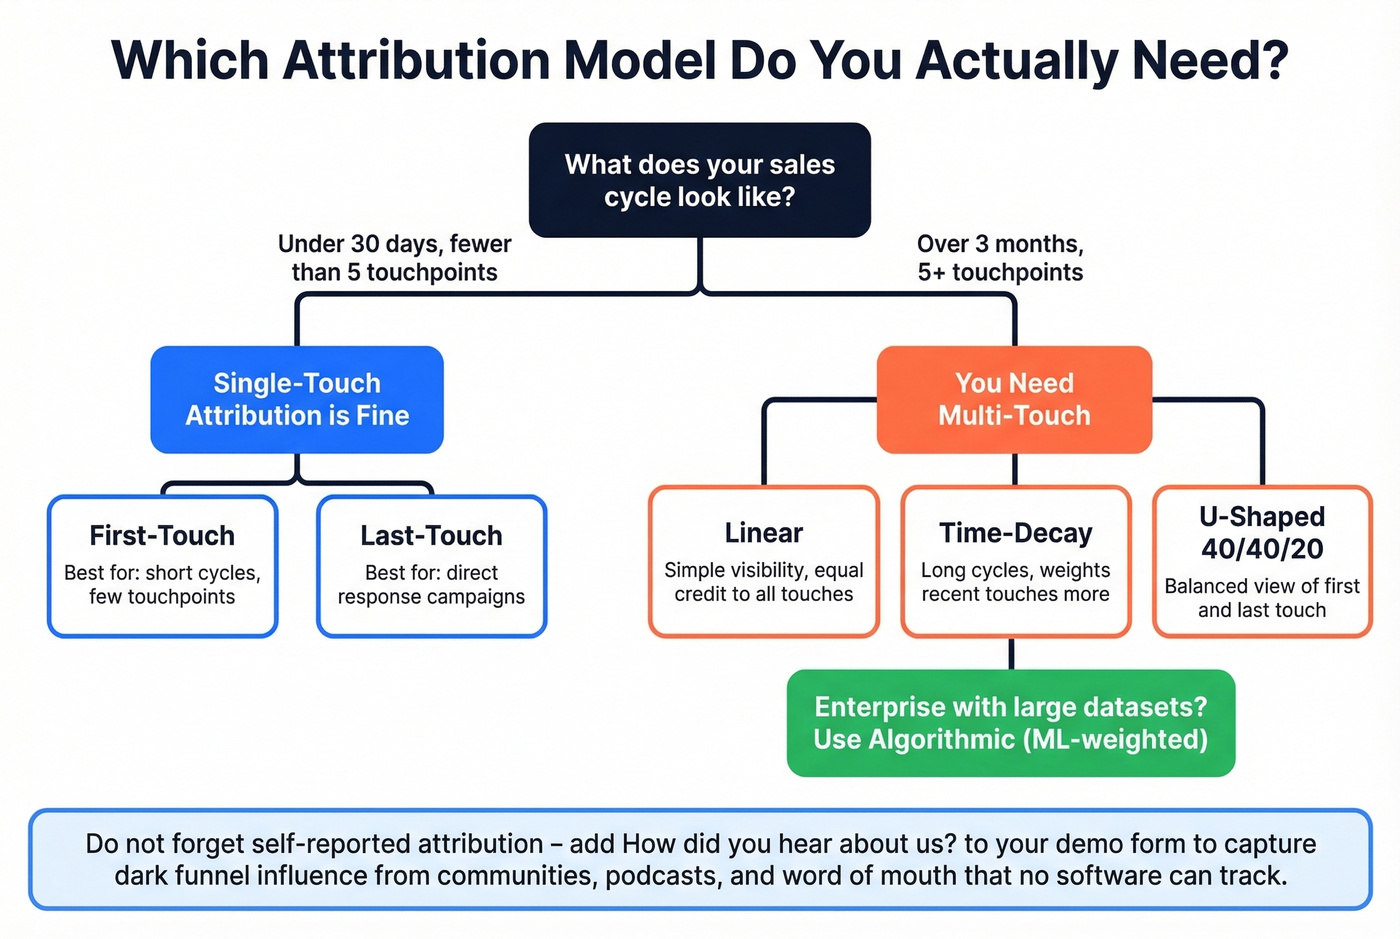
The practical decision rule: if your sales cycle is under 30 days with fewer than 5 touchpoints, single-touch attribution is fine. Past 3 months and 5+ touchpoints, you need multi-touch or you're flying blind.
Don't ignore self-reported attribution. Adding "How did you hear about us?" to your demo form captures dark funnel influence - communities, podcasts, AI search, word of mouth - that no software model can see. The consensus on r/marketing and r/sales is that measuring demand gen is nearly impossible when influence happens off-site. Self-reported data fills that gap imperfectly but usefully.
5 Measurement Mistakes That Corrupt Your Data
1. Treating all intent signals as equal. A prospect visiting your pricing page isn't the same as someone reading a blog post. Pricing, comparison, and review page visits should be weighted 3-5x higher than low-intent pages.
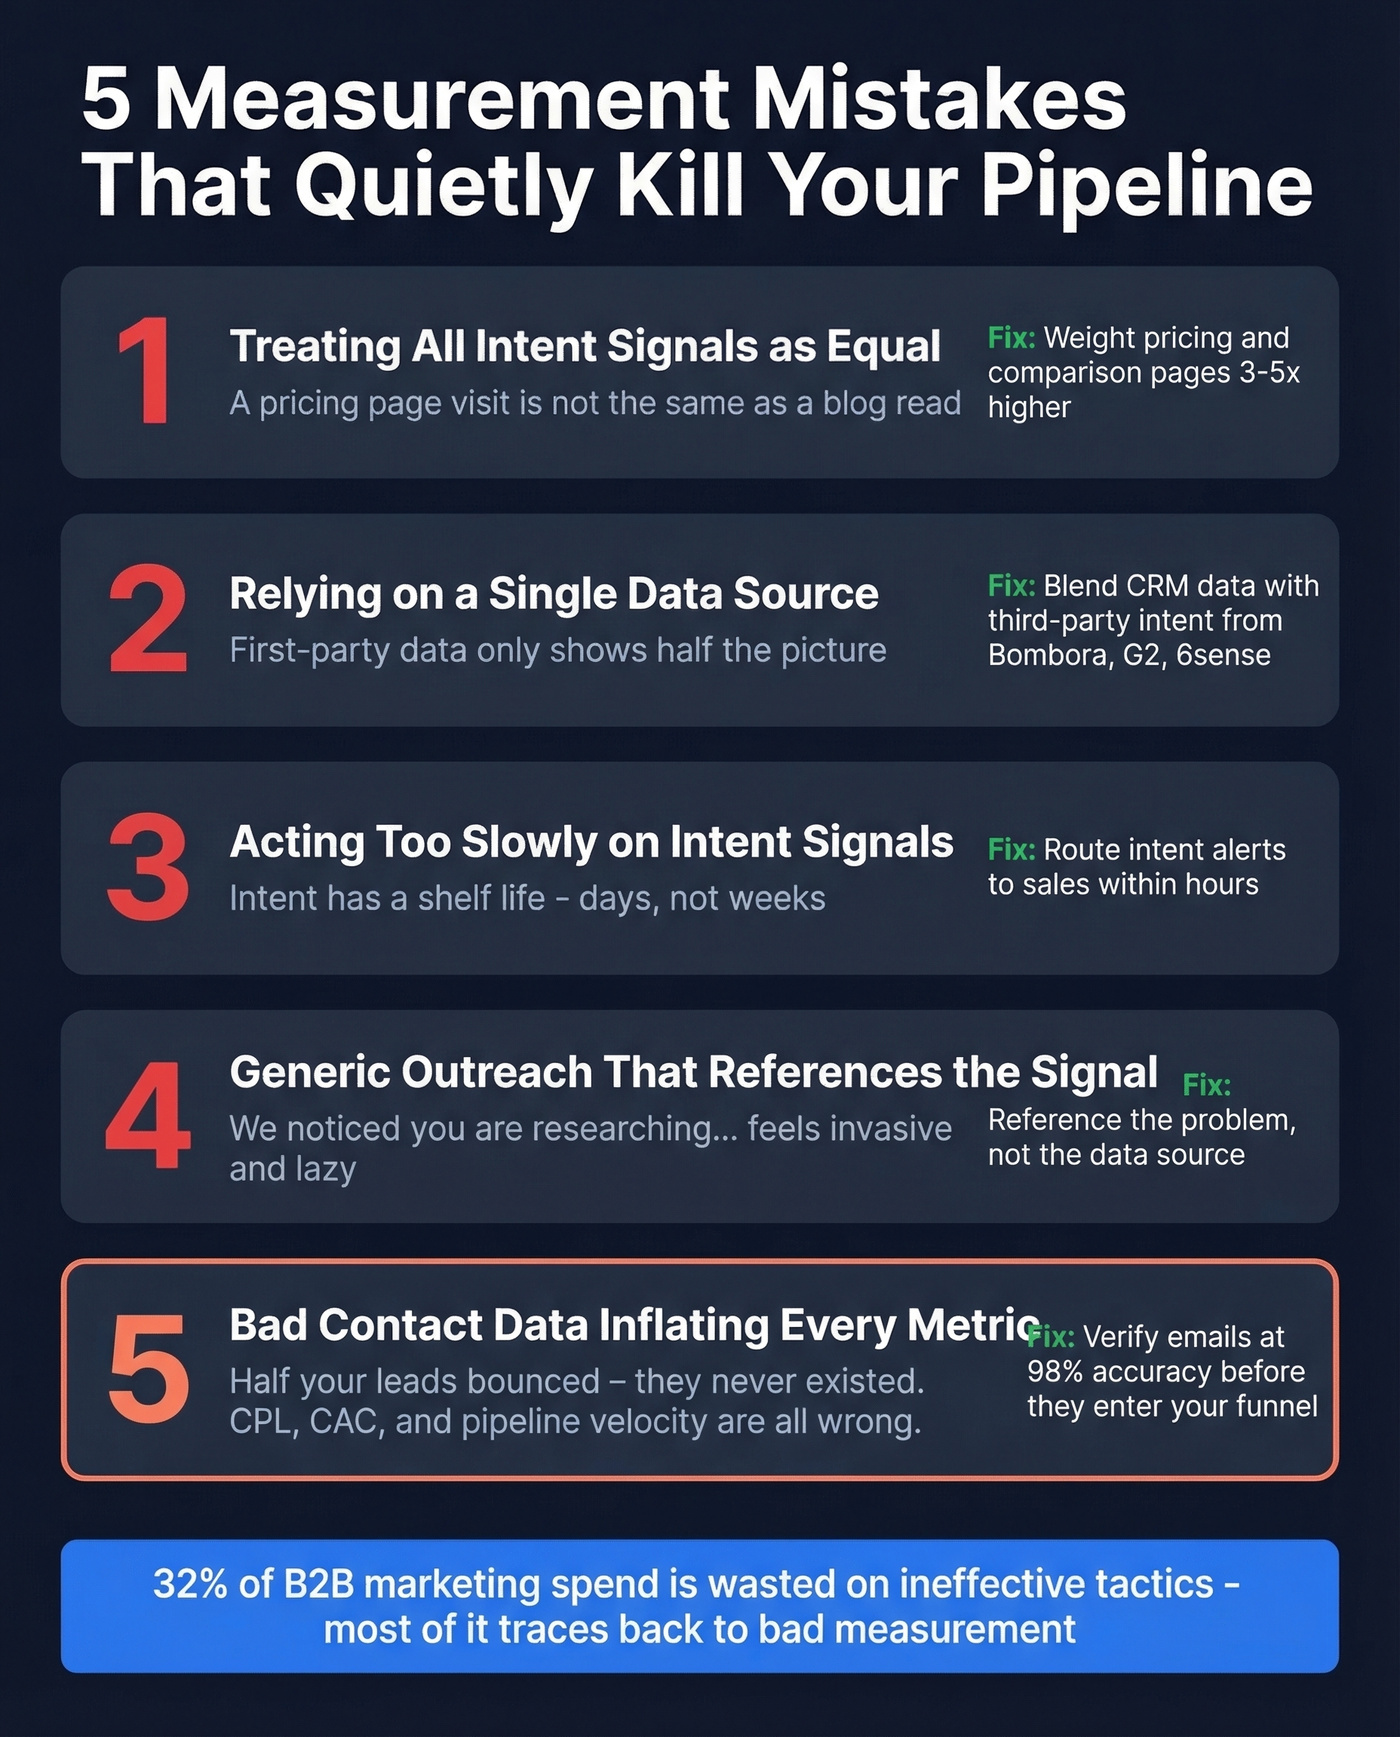
2. Relying on a single data source. First-party data like site analytics, CRM records, and product usage tells you what happened on your turf. Third-party intent data from providers like Bombora, G2, and 6sense tells you what's happening elsewhere. Blend both or you're seeing half the picture.
3. Acting too slowly on intent signals. Intent has a shelf life. A prospect researching your category today will sign with a competitor next week if you wait. Route intent alerts to sales within hours, not days.
4. Generic outreach that references the data source. "We noticed you're researching demand gen tools" feels invasive and lazy. Use intent to tailor the message - reference the problem, not the signal.
5. Bad contact data inflating every metric. This is the one that quietly corrupts everything. Your CPL dropped 30% last quarter - except half those emails bounced, meaning those leads never existed. Bad data inflates lead counts, distorts CAC, and tanks pipeline velocity because opportunities built on invalid contacts stall or disappear. Prospeo catches this with 98% email accuracy on a 7-day refresh cycle, so your CPL reflects real leads, not phantom ones. The free tier gives you 75 verifications per month to audit your current list before committing. (If you want a deeper dive, start with email bounce rate and email deliverability.)
Tracking marketing-sourced pipeline % means nothing if your team spends 15 hours a week building lists instead of running campaigns. Prospeo's 300M+ profiles with 30+ filters - including buyer intent across 15,000 topics - let you target ICP-qualified accounts in minutes, not days. Teams using Prospeo book 35% more meetings than Apollo users.
Spend less time list-building and more time generating pipeline that actually converts.
How Often to Review Each Metric
Teams that review pipeline metrics weekly see 34% revenue growth and 87% forecast accuracy. Ad-hoc trackers? 11% growth and 52% accuracy. The gap is enormous.
| Metric | Cadence | Why |
|---|---|---|
| Pipeline velocity | Weekly | Catches slowdowns early |
| CPL by channel | Weekly | Spend shifts fast |
| MQL-to-SQL conversion | Bi-weekly | Needs sample size |
| CAC & payback period | Monthly | Smooths out noise |
| LTV:CAC ratio | Quarterly | Long-tail metric |
| Marketing-sourced pipeline % | Monthly | Board-level reporting |
Skip the quarterly-only review cycle if you're spending more than $50K/month on demand gen. At that burn rate, waiting 90 days to spot a broken channel is expensive.
Build Your Dashboard in 30 Minutes
Teams spend 10-20 hours per week on manual reporting. Automated dashboards cut that by 80%+. Google Looker Studio is free and has a template gallery where you can copy existing demand gen dashboards, connect your data sources, and have something functional in under an hour. Non-Google connectors for HubSpot, Facebook, and similar platforms usually require paid tools like Supermetrics or Funnel.io.
Build role-specific views. Your CMO needs pipeline velocity and marketing-sourced revenue. Your channel manager needs CPL and conversion rate by source. Cramming both into one dashboard guarantees neither person gets what they need.
For contact data inputs, Prospeo's enrichment API and native CRM integrations return 50+ data points per contact at a 92% match rate - so your segmentation and attribution models run on complete records, not guesswork. (If you're evaluating vendors, compare data enrichment services and how they handle refresh cycles.)
FAQ
What's the difference between demand generation and lead generation metrics?
Demand gen metrics measure the full journey from awareness to revenue - pipeline velocity, CAC payback, marketing-sourced pipeline %. Lead gen metrics measure top-of-funnel capture only. You need both, but demand generation metrics predict revenue. That's the line that separates revenue-focused teams from vanity-metric teams.
How many demand gen KPIs should I track?
Five to seven, chosen by company stage. Start with pipeline velocity, marketing-sourced pipeline %, and CAC payback period. A Series A startup and a $100M ARR enterprise shouldn't run the same dashboard - scale complexity with your team's capacity to act on the data.
How do I measure demand gen when attribution is unreliable?
Combine software attribution with self-reported attribution on demo forms. Software captures digital touchpoints; self-reported captures dark funnel influence like communities, podcasts, and word of mouth. Neither is perfect alone. Together they cover roughly 80% of buyer influence.
Can bad contact data skew demand generation metrics?
Absolutely. Invalid emails and outdated records inflate lead counts, distort CPL, and create phantom pipeline that never converts. Verification tools that catch bad records before they enter your CRM are the cheapest insurance against corrupted reporting. Audit at least a sample of your database quarterly.