Email Campaign Metrics to Track in 2026 (+ Formulas)
One practitioner on r/Emailmarketing watched their open rate crash from 35% to 18% overnight after a Gmail security update - with zero changes to their content, list, or sending cadence. They'd been reporting open rate as their primary KPI. Suddenly, the board deck looked like a disaster, and nothing had actually changed about subscriber engagement.
That's the problem with most advice on email campaign metrics to track: it treats open rate like it's 2019. Apple broke open tracking in 2021 with Mail Privacy Protection. Major inbox providers tightened sender requirements in 2024. Bot clicks are inflating click metrics. And 31% of marketers still report open rate as a top KPI - meaning nearly a third of teams are building strategy on a broken number.
If You Only Track Five Things
- Click rate (filtered for bots) - the closest thing to real engagement you've got (see the click rate breakdown)
- Conversion rate - the only metric that ties email to business outcomes
- Revenue per recipient - normalizes campaign performance regardless of list size
- Inbox placement rate - because "delivered" doesn't mean "seen"
- List churn rate - your list decays ~22.71% per year; if you're not measuring net growth, you're flying blind (use a simple churn analysis view)
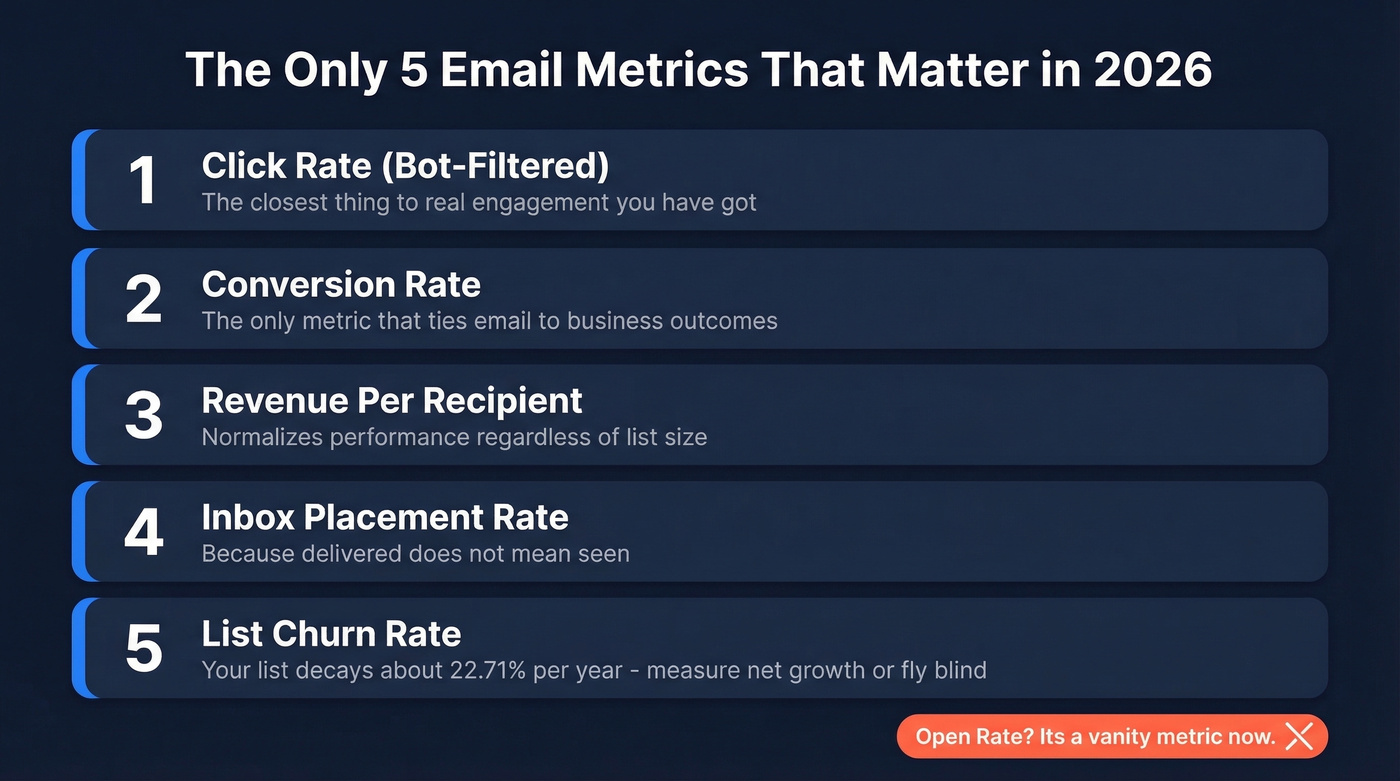
Open rate is a vanity metric in 2026. The rest of this guide explains why and gives you the formulas, benchmarks, and cadence to do it right.
Every Metric Worth Monitoring
Bookmark this table. It covers every metric in this guide with the formula, a 2026-relevant benchmark, and a reliability rating so you know which numbers to trust and which to squint at.
| Metric | Formula | 2026 Benchmark | Reliability |
|---|---|---|---|
| Open Rate | Opens / Delivered x 100 | 35-39% (inflated) | ⚠️ Noisy |
| Click Rate | Clicks / Delivered x 100 | 2.6-6.2% | ✅ Reliable* |
| CTOR | Clicks / Opens x 100 | Varies widely | ❌ Broken |
| Reply Rate | Replies / Delivered x 100 | 1-5% (B2B) | ✅ Reliable |
| Delivery Rate | Delivered / Sent x 100 | 95-99% | ⚠️ Noisy |
| Inbox Placement | Inbox / Delivered x 100 | Track monthly via seed tests | ✅ Reliable |
| Bounce Rate | Bounces / Sent x 100 | <2% target | ✅ Reliable |
| Spam Complaint | Complaints / Delivered | <0.1% target | ✅ Reliable |
| Conversion Rate | Conversions / Delivered x 100 | 1-5% | ✅ Reliable |
| Revenue/Recipient | Revenue / Recipients | Varies by vertical | ✅ Reliable |
| Email ROI | (Revenue - Cost) / Cost | ~36:1 average | ⚠️ Noisy |
| List Growth Rate | Net new / Total x 100 | Offset 22.71%/yr decay | ✅ Reliable |
| Unsubscribe Rate | Unsubs / Delivered x 100 | ~0.22% (all-users baseline) | ✅ Reliable |
| Active Sub Rate | Active / Total x 100 | 20-30% is common | ✅ Reliable |
*Click rate is reliable when bot-filtered. Without filtering, treat it as ⚠️.
Engagement Metrics
Open Rate (⚠️ Use With Caution)
Formula: Unique opens / Emails delivered x 100
Apple Mail Privacy Protection preloads tracking pixels via proxy servers - firing the open pixel even if the recipient never reads your email. When "Protect Mail Activity" is enabled, Apple masks IP addresses, timestamps, geolocation, and device type. Every Apple Mail user on your list inflates your open rate regardless of actual engagement.
The ActiveCampaign 2026 benchmarks report an average open rate of 39.26%. Mailchimp's data shows 35.63%. Both numbers are MPP-inflated. Here's the thing: open rate isn't completely useless. It still works for relative comparisons within the same list over short time windows - subject line A vs. subject line B, sent to the same segment on the same day. But as an absolute performance indicator? It's broken. Stop putting it on the executive dashboard.
If you still need open-rate context for stakeholders, it helps to pair it with a more stable reference like a standard email open rate by list type.
Click-Through Rate (✅ Primary Engagement KPI)
Formula: Unique clicks / Emails delivered x 100
Click rate is the engagement metric that actually survived the privacy apocalypse. Someone either clicked or they didn't. No proxy can fake that.
Mailchimp reports an all-users average of 2.62%. ActiveCampaign's 2026 data shows 6.21%, skewed by their customer mix of smaller, more engaged lists. The caveat is bots - and it's a big one.
If you're optimizing for clicks, your creative matters more than most teams think - especially the email call to action.
Bot Clicks: The Hidden CTR Inflator
Security scanners, email gateways, and privacy tools now click links in emails to check for malicious content before a human ever sees the message. These phantom clicks inflate your click rate and destroy A/B test validity.
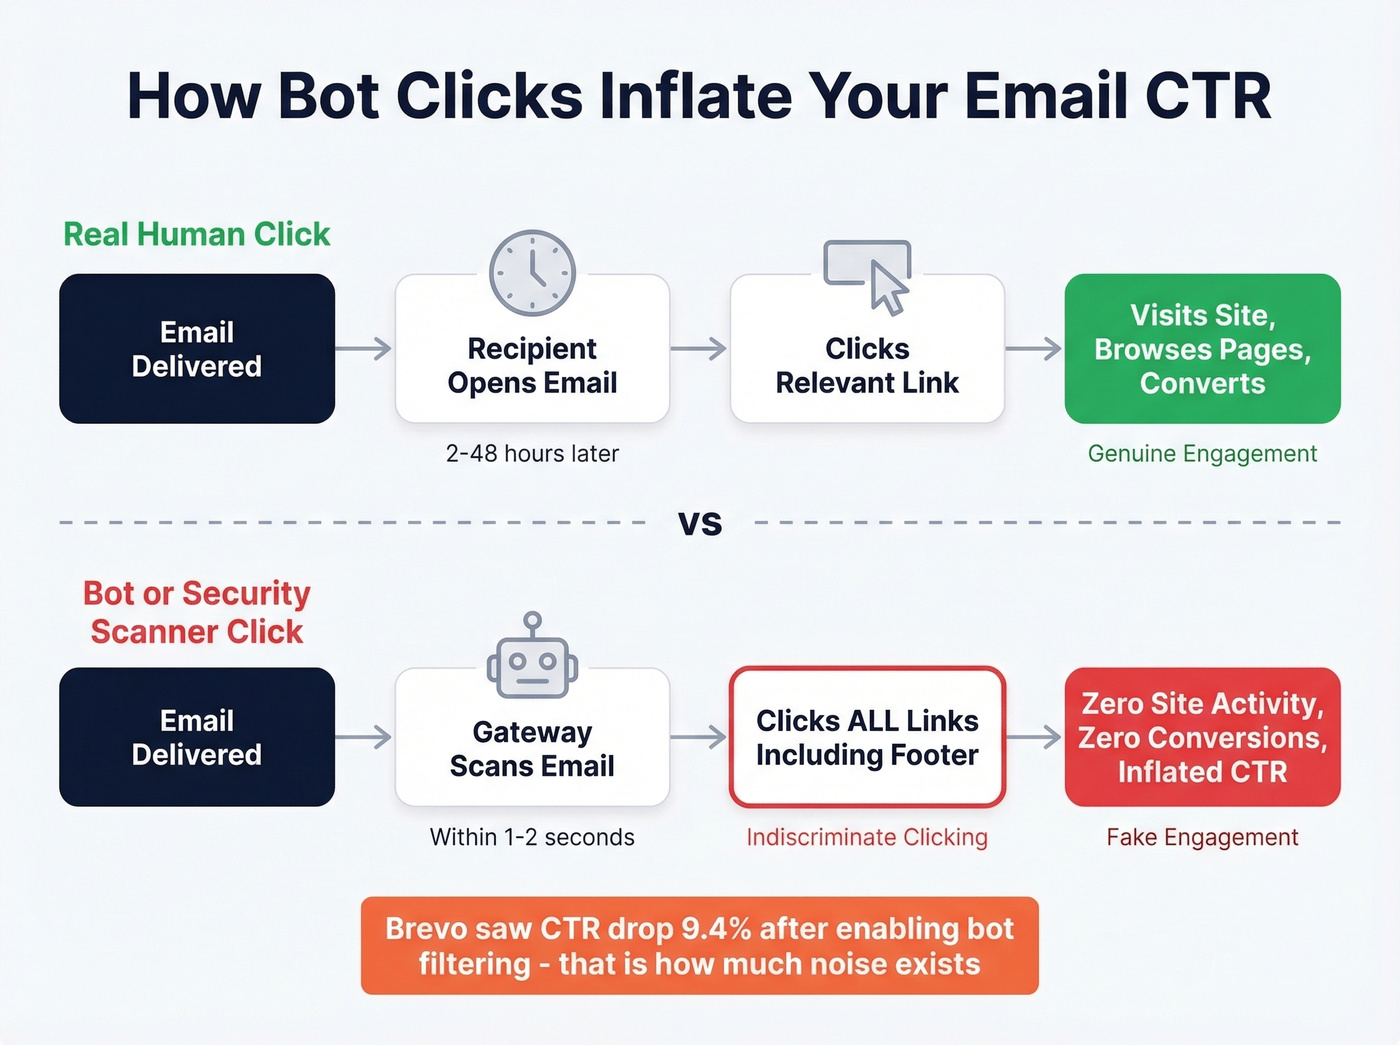
How to spot them: Look for clicks within one second of delivery, clicks on every link in the email including footer and legal links, and click spikes with no corresponding site traffic or conversions. When Brevo enabled bot filtering on their own newsletter, their reported CTR dropped 9.4%. That's the magnitude of noise we're talking about.
| ESP | Bot Filtering | Key Limitation |
|---|---|---|
| ActiveCampaign | BotSense (Pro+) | Doesn't filter workflow/automation triggers |
| Klaviyo | Separate reporting | Reporting vs attribution gap |
| HubSpot | Custom rules | Not retroactive |
| Brevo | Optional toggle | Must enable manually |
Add a time-to-click analysis to your reporting. If a large share of clicks happen within a couple seconds of delivery, you've got a bot problem.
Click-to-Open Rate: Skip It
Formula: Unique clicks / Unique opens x 100
CTOR divides a real number (clicks) by a fake number (MPP-inflated opens). It's doubly unreliable. If you still want to use it, isolate it to segments where you can confirm non-Apple Mail users. For everyone else, just use click rate.
Reply Rate and Forward Rate
No bot replies to your email. No proxy forwards it to a colleague. These are the engagement signals that can't be faked.
Reply rate is particularly valuable for B2B outbound and newsletters where you're trying to start conversations, not just drive clicks. Forward rate is harder to track - most ESPs don't surface it natively - but if yours does, it's the highest-intent engagement signal short of a purchase.
If replies are a core KPI for you, build your reporting around follow-up email reply rate by segment and sequence stage.
Post-Click On-Site Behavior
Most guides skip this entirely: what happens after the click. Pages viewed per session, time on site, and scroll depth from email traffic tell you whether your email attracted the right audience or just generated curiosity clicks.
Let's say your email click rate is 5% but average session duration from email traffic is 8 seconds. Your subject line is writing checks your content can't cash. Connect your ESP to GA4 and segment email traffic as its own channel to surface this data.
Deliverability Metrics
Delivery Rate vs. Inbox Placement
This is the most misunderstood distinction in email marketing. 88% of senders confuse the two - and both Mailjet and Litmus have published guides specifically to address this gap.
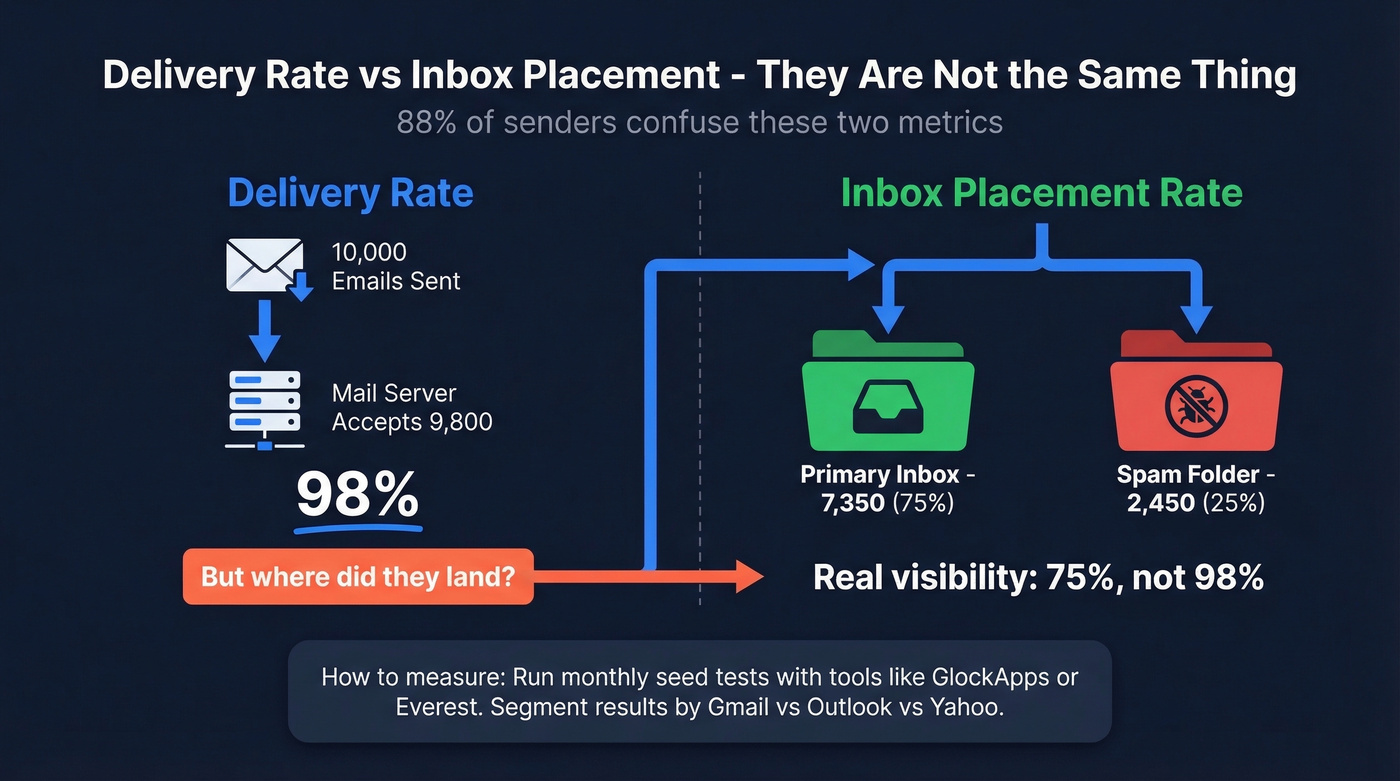
Delivery rate tells you the receiving server accepted your email - it didn't bounce. A "delivered" email could be sitting in spam. Inbox placement rate tells you whether people can actually see your email. You can have a 98% delivery rate and still land in spam for half your list.
Only ~13% of senders use inbox placement reports. Run seed testing with tools like GlockApps or Everest - send to seed addresses across providers and measure where emails actually land. Do this monthly at minimum, and segment your metrics by receiving domain (Gmail vs. Outlook vs. Yahoo) to diagnose provider-specific filtering issues.
If you're troubleshooting spam-folder issues, a dedicated email deliverability guide will save you weeks.
Bounce Rate (Hard vs. Soft)
Formula: Bounced emails / Emails sent x 100
Hard bounces mean the address doesn't exist - invalid domain, deleted mailbox, typo. Soft bounces are temporary: full inbox, server timeout, message too large. Hard bounces damage your sender reputation immediately. Soft bounces matter if they persist across multiple sends.
Keep total bounce rate under 2%. Email lists decay at roughly 22.71% per year - about 1.89% monthly. If you're not actively cleaning your list, you'll blow past the 2% ceiling within a few months. We've seen teams go from pristine sender reputation to spam folder in a single quarter because they skipped verification on a batch import. Prospeo's 5-step email verification catches invalid addresses, spam traps, and honeypots before they tank your sender reputation - with 98% accuracy across 143M+ verified emails.
For deeper diagnostics (codes, thresholds, remediation), see email bounce rate.
Spam Complaint Rate
Formula: Spam complaints / Emails delivered
Google's hard limit is 0.3%. The practical target is under 0.1%. Exceed either threshold consistently and you'll watch inbox placement crater.
If you haven't implemented SPF, DKIM, and DMARC, your spam complaint rate is almost irrelevant because you're already getting filtered. Authentication is table stakes in 2026, not a nice-to-have.
If you're tightening authentication and policy, start with DMARC alignment so your setup actually passes at scale.
Every bounced email tanks your deliverability metrics and sender reputation. Prospeo's 5-step verification and 7-day data refresh keep bounce rates under 2% - the benchmark this guide recommends. 15,000+ teams already stopped reporting inflated numbers.
Start with 98% accurate emails at $0.01 each - no broken metrics.
Revenue Metrics
Conversion Rate
Formula: Conversions / Emails delivered x 100
"Conversion" means whatever you define it to mean for a given campaign - a purchase, a demo booking, a content download, a free trial signup. The key is consistency: pick your definition per campaign type and stick with it so you can compare across sends.
Connect your ESP to GA4 with proper UTM tagging so conversions are tracked end-to-end. Without that connection, you're guessing.
If you're mapping email to pipeline, it helps to align with broader funnel metrics so email isn't measured in a silo.
Revenue Per Recipient
Formula: Total campaign revenue / Total recipients
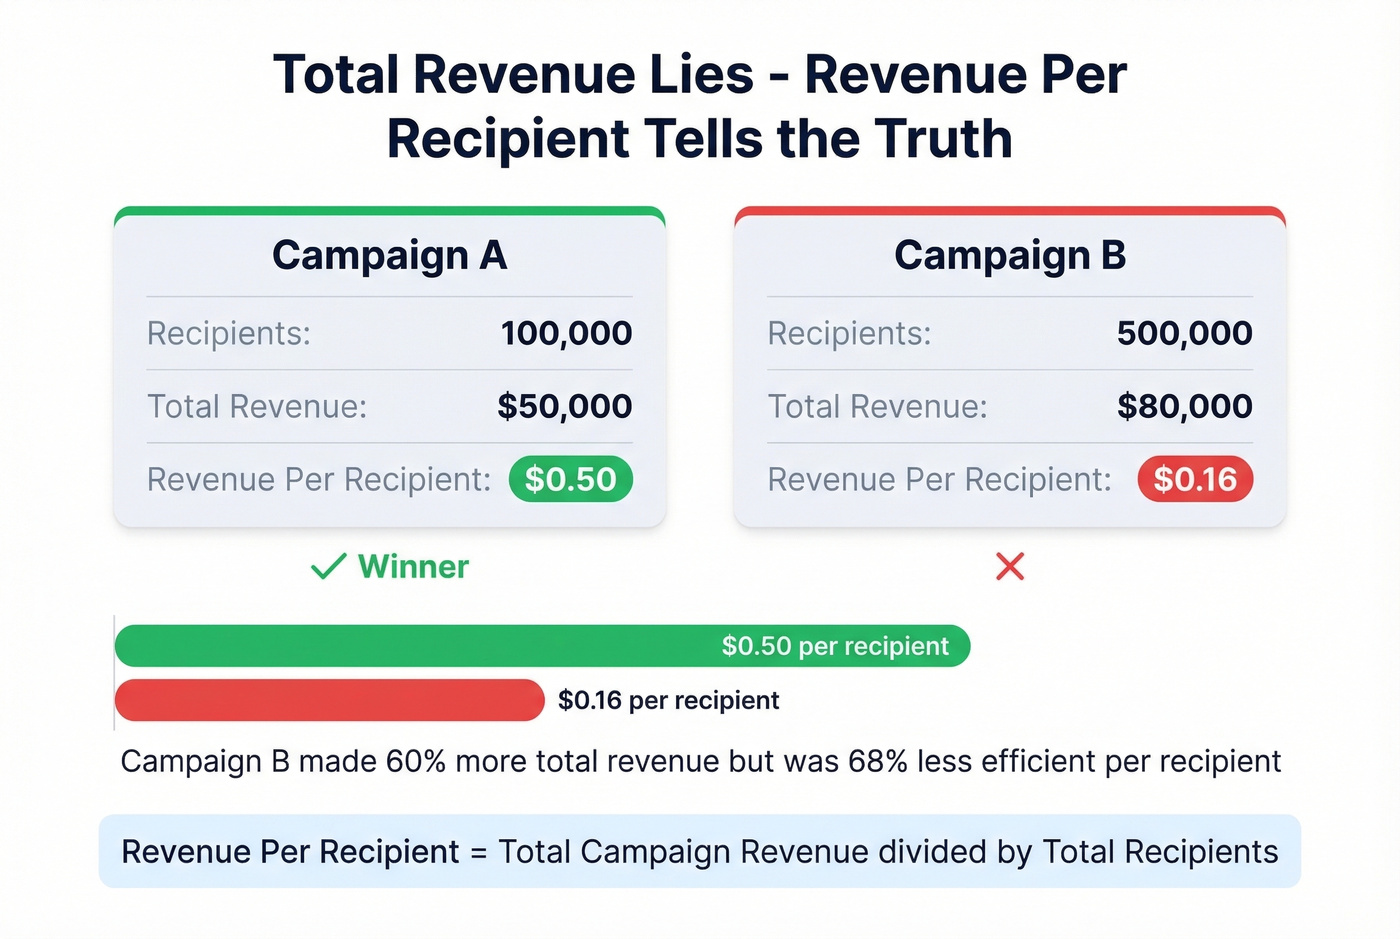
This is the metric that should replace "total revenue" on your dashboard. A campaign that generates $50,000 from 100,000 recipients ($0.50/recipient) is outperforming one that generates $80,000 from 500,000 recipients ($0.16/recipient). Total revenue hides efficiency. Revenue per recipient exposes it.
Email ROI and Attribution
Formula: (Revenue attributed to email - Email costs) / Email costs
The widely cited benchmark is $36 for every $1 spent. That number gets repeated everywhere, and it's directionally useful - email is a high-ROI channel - but your actual ROI depends entirely on your attribution model.
Attribution is where things fall apart. 98% of marketers say attribution is crucial, but only 29% consider themselves successful at it. Last-click attribution gives email credit for every conversion where email was the final touchpoint, systematically overvaluing bottom-funnel sends and undervaluing nurture sequences. Multi-touch models like linear, time-decay, U-shaped, and data-driven distribute credit more fairly, but they're harder to implement and require clean data across channels.
Making it worse: Apple's Link Tracking Protection now strips UTM parameters from links in Mail and Safari. If a meaningful chunk of your audience uses Apple devices, your GA4 attribution data has holes in it. There's no clean fix - just awareness that your revenue numbers are approximate, not precise.
Look, if your average deal size stays under five figures, you probably don't need perfect multi-touch attribution. Track conversion rate and revenue per recipient, run your campaigns, and stop agonizing over which email gets 23% vs. 31% of the credit. The attribution rabbit hole has diminishing returns for most teams. For mature programs, also track customer lifetime value and cost per acquisition at the email channel level - these downstream metrics connect individual campaign performance to long-term business health.
List Health Metrics
List Growth Rate
Formula: (New subscribers - Unsubscribes - Bounces) / Total list size x 100
The word "net" is doing heavy lifting here. With email lists decaying at ~22.71% annually, a list that isn't growing is shrinking. If you're adding 500 subscribers a month but losing 400 to bounces, unsubscribes, and disengagement, your net growth is 100 - not 500.
Unsubscribe Rate
Mailchimp's all-users benchmark sits at 0.22%. That's a useful reference point, but a low unsubscribe rate isn't always good news - many disengaged subscribers simply stop opening rather than clicking unsubscribe. They're dead weight on your list, dragging down engagement rates and potentially hurting deliverability.
A sudden spike in unsubscribes after a specific campaign is actually more useful data than a steady low rate. It tells you something about that send was wrong.
Active Subscriber Rate
Formula: Subscribers who clicked or converted in the last 90 days / Total list size x 100
This is the most honest measure of list quality. A 200,000-person list with a 20% active rate is functionally a 40,000-person list. The other 160,000 are hurting your deliverability metrics and costing you money.
In our experience, teams that switch from tracking total list size to active subscriber rate make better segmentation decisions within one quarter. If your active rate is declining while your list grows, you're adding low-quality contacts. Verify before you import - catching invalid addresses before they enter your list protects both engagement metrics and sender reputation.
If you're building segments around intent and engagement, use an intent based segmentation approach so "active" actually means something.
2026 Benchmarks by Industry
Two caveats before you compare your numbers to these. First, open rates across both sources are MPP-inflated - treat them as directional, not absolute. Second, Mailchimp's data was last updated December 2023; ActiveCampaign's was published January 2026 from 2025 campaign data.
Mailchimp Benchmarks
| Industry | Open Rate | Click Rate | Unsub Rate |
|---|---|---|---|
| Business/Finance | 31.35% | 2.78% | 0.15% |
| Non-Profit | 40.04% | 3.27% | 0.18% |
| Education | 35.64% | 3.02% | 0.18% |
| E-Commerce | 29.81% | 1.74% | 0.19% |
| All Users | 35.63% | 2.62% | 0.22% |
ActiveCampaign Benchmarks
| Industry | Open Rate | Click Rate |
|---|---|---|
| Non-Profit | 42.68% | - |
| E-Commerce | 35.66% | 5.07% |
| Software | 36.20% | 6.67% |
| Media/Publishing | 43.16% | 7.32% |
| All Users | 39.26% | 6.21% |
The click rate gap between Mailchimp (2.62%) and ActiveCampaign (6.21%) isn't because one platform is better. ActiveCampaign's customer base skews toward smaller, more engaged lists. Use whichever benchmark is closer to your list profile.
Performance Tracking Cadence
Knowing which metrics matter is half the battle. Knowing when to check them - and what to do when something moves - is the other half.
| Cadence | What to Check | Why |
|---|---|---|
| Daily | Bounce spikes, spam complaints, deliverability alerts | Catch reputation damage early |
| Weekly | Click rate by segment, unsub rate by campaign, bot-click anomalies | Spot engagement trends |
| Monthly | Net list growth, revenue/recipient trend, inbox placement test, active sub rate, attribution review | Strategic health check |
Don't check revenue metrics daily - you'll overreact to noise. Don't check deliverability monthly - you'll catch problems too late. We've found that teams matching cadence to metric volatility spend less time in dashboards and more time acting on real signals. Build a consistent analytics practice around these intervals and you'll stop firefighting numbers that don't matter.
Tracking spam complaint rate below 0.1% is impossible when your contact data is stale. Prospeo refreshes 300M+ profiles every 7 days - not the 6-week industry average - so you're never emailing dead addresses that trigger spam traps.
Clean data fixes every metric on this page. See for yourself.
FAQ
What are the most important email campaign metrics to track in 2026?
Click rate (bot-filtered), conversion rate, revenue per recipient, inbox placement rate, and list churn rate. Open rate is unreliable due to Apple Mail Privacy Protection inflating numbers across every major ESP. Focus on metrics that reflect real human behavior, not pixel-fired proxies.
How do I tell if my clicks are from bots?
Look for clicks within one second of delivery, clicks on every link including footer links, and click spikes with no matching site traffic or conversions. Enable your ESP's bot filtering - when Brevo turned theirs on, reported CTR dropped 9.4%. Without filtering, your A/B tests are meaningless.
What's the difference between delivery rate and inbox placement?
Delivery rate means the receiving server accepted your email - it didn't hard bounce. Inbox placement means the email reached the actual inbox, not spam. You can have a 98% delivery rate and still land in spam. Run monthly seed tests with GlockApps or Everest to measure where emails actually land.
How do I reduce my bounce rate below 2%?
Verify every address before sending. Lists decay at 22.71% per year, so even a clean list needs re-verification quarterly to stay under the 2% threshold that protects sender reputation. Prospeo's 5-step verification catches invalid addresses, spam traps, and honeypots with 98% accuracy across 143M+ verified emails.
How often should I review campaign performance?
Check deliverability alerts, bounce spikes, and spam complaints daily. Review click rates and unsubscribe rates by segment weekly. Run inbox placement tests, attribution reviews, and list health audits monthly. Matching review cadence to metric volatility prevents both overreaction and late detection.