Email Campaign Optimization in 2026: What Actually Moves the Needle
Your CMO asks why email revenue is flat despite a 40% open rate. You pull the dashboard - opens are strong, sends are up, the list is growing. But revenue per email is declining and reply rates have cratered.
The problem isn't your copy or cadence. It's that your optimization effort is aimed at the wrong metrics and the wrong sends.
Fix Deliverability First
Your subject line doesn't matter if your email never reaches the inbox. Gmail began strict SMTP-level enforcement for non-compliant bulk senders in late 2025, and Microsoft followed suit. By 2026, this is table stakes. If you're sending more than 5,000 emails a day to Gmail and Yahoo without proper authentication, your messages aren't landing in spam - they're rejected outright.
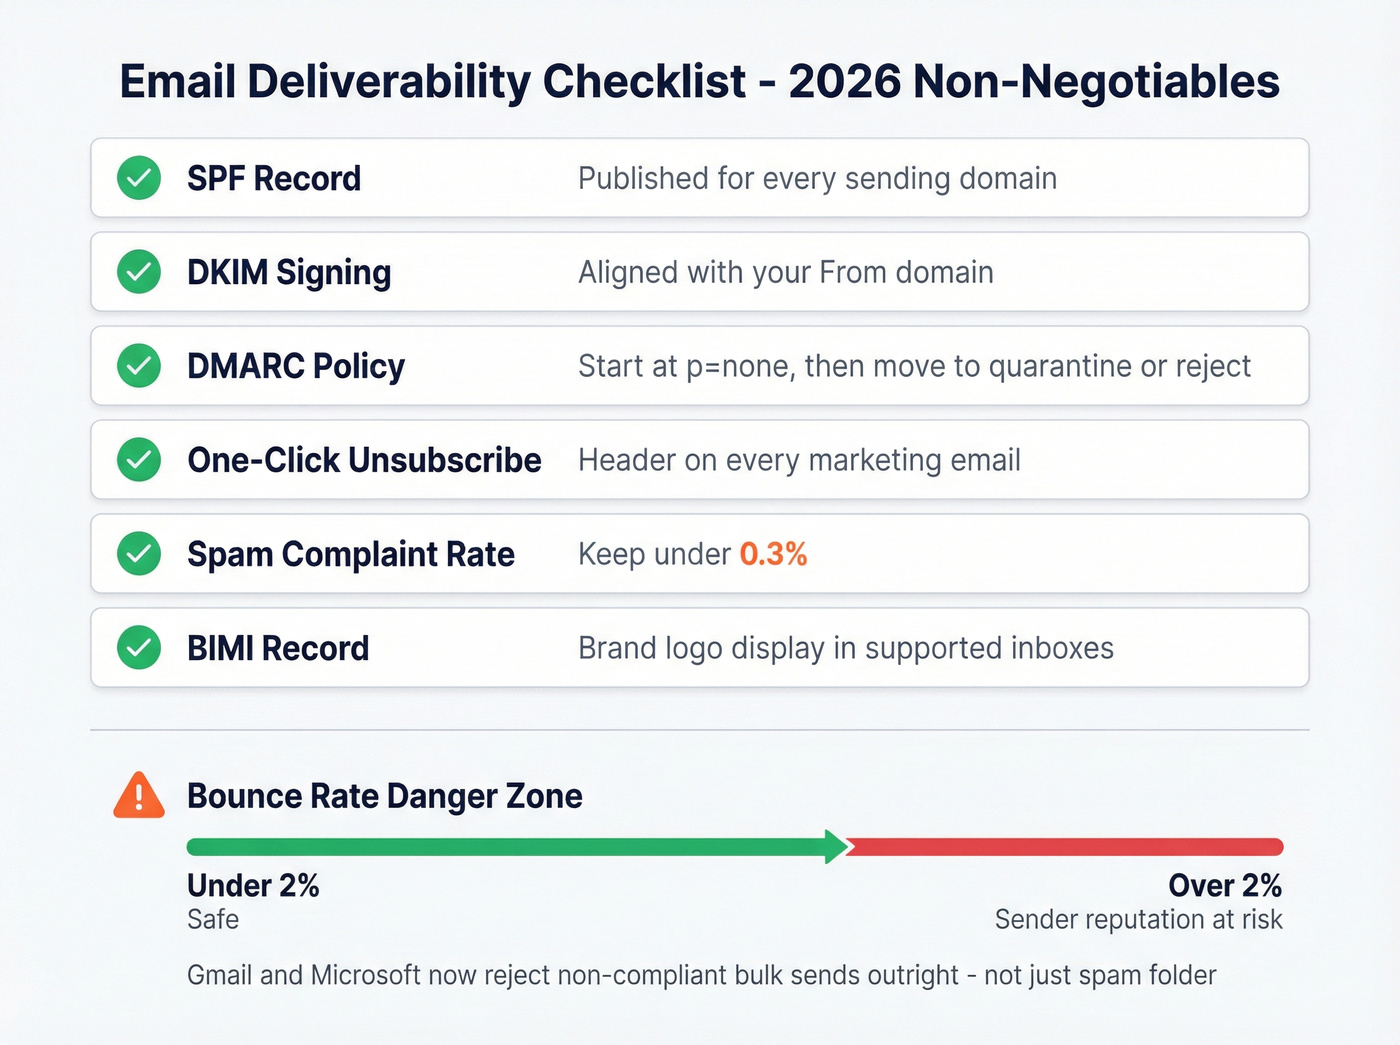
The compliance checklist is non-negotiable:
- SPF record published for every sending domain
- DKIM signing aligned with your From domain (see DMARC alignment)
- DMARC policy set - start at
p=none, then move toquarantineorreject(use an email deliverability guide to validate each step) - One-click unsubscribe header on every marketing email
- Spam complaint rate under 0.3% (run an email spam checker before scaling volume)
- BIMI record configured for brand logo display in supported inboxes
The other deliverability killer? Bounce rates above roughly 2%. That signals stale or unverified data, and mailbox providers notice fast. Prospeo's 98% email accuracy and 7-day data refresh cycle keeps lists clean so your sender reputation stays intact - a problem most teams don't realize they have until they're already flagged. Improving email performance starts here, before you touch a single subject line or CTA (and if you need the numbers, start with email bounce rate).

Open Rates Are Broken
Apple Mail Privacy Protection preloads tracking pixels via proxy servers, registering emails as "opened" even when the recipient never read them. MPP blocks IP addresses, timestamps, geolocation, and device data. Depending on your audience mix, roughly half your opens are inflated.
This breaks open-rate-based automations, segmentation, and reporting. The metrics that actually reflect engagement: click-through rate, revenue per email, replies, conversions, and referral activity. If your dashboard still leads with open rate as the primary KPI, you're flying blind (and it's worth understanding email tracking pixels if you're still relying on them).
Benchmarks Worth Tracking
Benchmarks are directional signals, not targets. Every platform skews based on its customer base.
| Platform | Avg Open Rate | Avg Click Rate | Unsub Rate | Context |
|---|---|---|---|---|
| Mailchimp | 35.63% | 2.62% | 0.22% | Broad base, 1K+ subs |
| ActiveCampaign | 39.26% | 6.21% | - | Based on 2025 sends |
| Klaviyo (Campaigns) | - | 1.69% | - | Ecommerce-focused, 183K+ customers |
| Klaviyo (Flows) | - | 5.58% | - | 3x campaign click rate |
Industry-specific rates vary widely - ecommerce click rates tend to run lower than SaaS or nonprofit. Every open rate figure carries the Apple MPP asterisk. The click rate column is where the real story lives (calculate it consistently with a click rate formula).
You just read that bounce rates above 2% destroy sender reputation. Prospeo's 5-step email verification and 7-day data refresh cycle keep bounce rates under that threshold before you hit send - across 143M+ verified emails at 98% accuracy.
Fix deliverability at the source - not after your domain is flagged.
Optimize Flows, Not Just Campaigns
Here's the thing: campaigns account for 94.7% of email send volume, but flows generate roughly 41% of total email revenue. Revenue per recipient for flows runs 18x higher than campaigns. Placed order rate? 13x higher. The top 10% of flows reach $7.79 RPR with click rates above 10%, and adding AI product recommendations to flows lifts click rates to 3.75% on average - 8.79% for top performers.
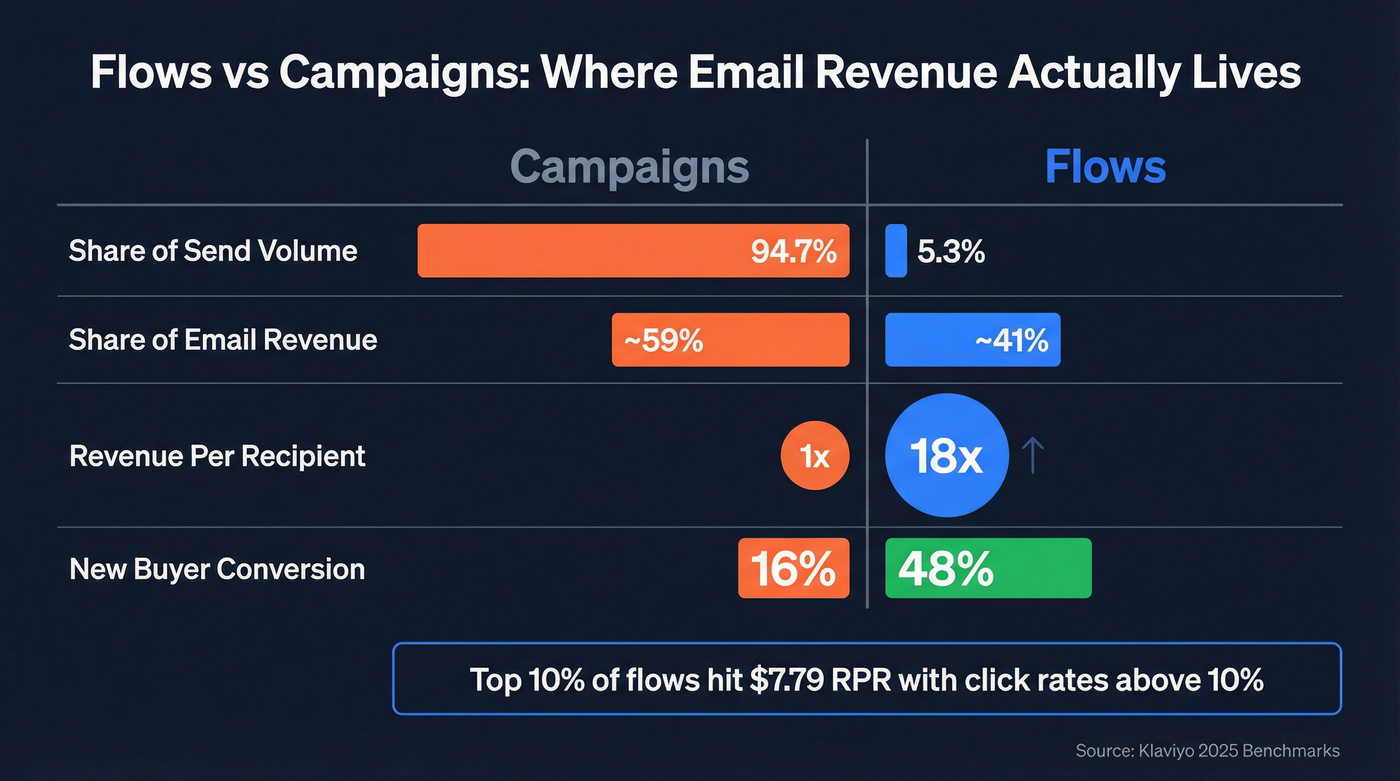
About 48% of flow-driven revenue comes from new buyers, compared to just 16% for campaigns. Flows aren't retention tools - they're converting first-time customers at a rate campaign blasts can't touch.
Most teams spend 80% of their optimization time on campaign blasts and 20% on flows. Flip that ratio. In our experience, getting your welcome series and abandoned cart flows dialed in delivers more revenue lift than six months of newsletter subject line tweaks. If you want to boost email conversion rates, that's where to start (and if you're rebuilding targeting, use targeted email campaigns as your baseline).
A/B Testing That Works
Every email guide says "A/B test everything." Almost none explain how to validate results. Version B "won" with a 0.3% higher click rate on 500 people? Statistically meaningless.
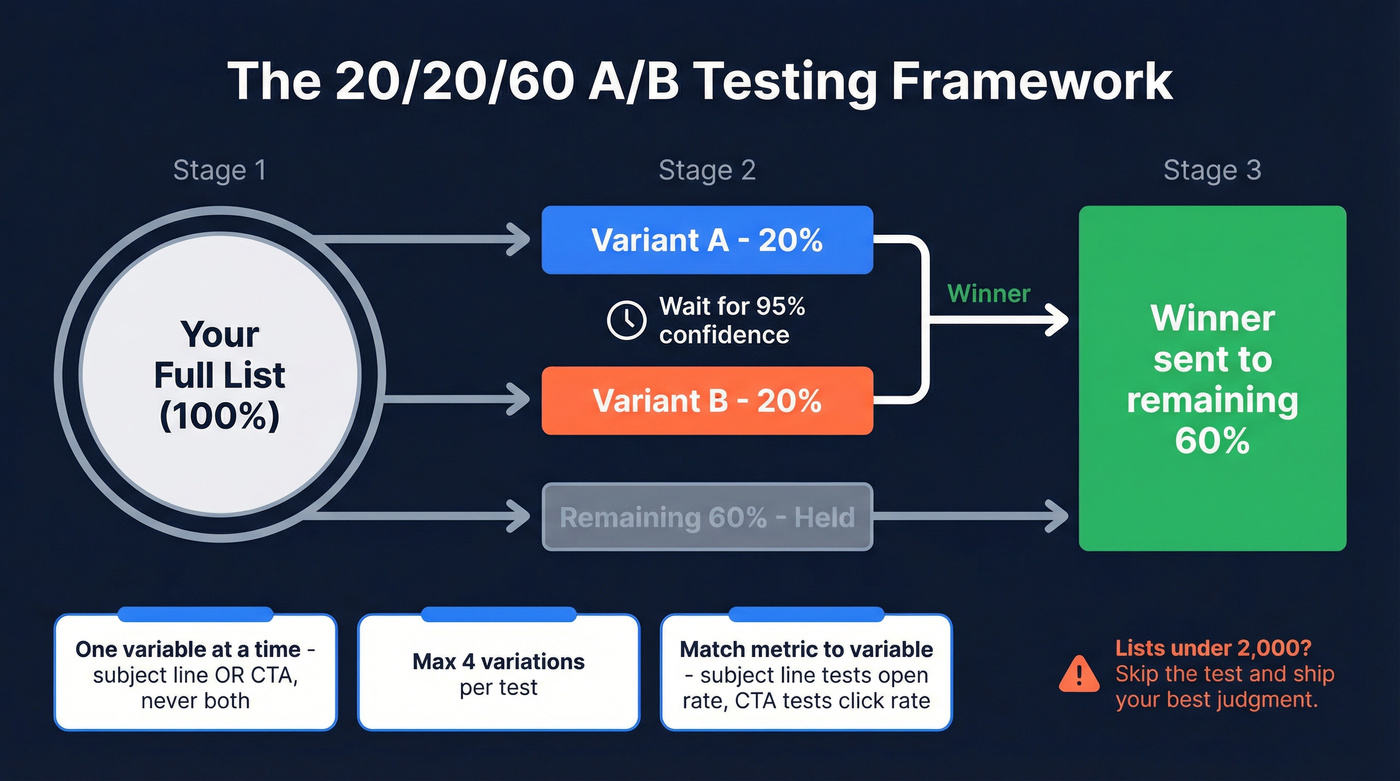
Target 95% confidence and 80% statistical power. Use a 20%/20% split - variant A to 20%, variant B to 20%, wait for significance, send the winner to the remaining 60%.
- One variable at a time - subject line OR CTA, never both (pull ideas from email subject line examples)
- Max 4 variations per test
- Match metric to variable: subject line -> open rate, CTA -> click rate, send time -> placed order rate (tighten CTAs with email call to action)
We've seen teams run dozens of "winning" tests that were pure noise. If your sample can't support significance, skip the test and ship your best judgment. For lists under 2,000 subscribers, most tests won't reach significance anyway - trust your instincts and move on.
Send Time and Engagement
The "Tuesday at 10 AM" advice is a myth that won't die. Twilio SendGrid's data scientists analyzed their send data and couldn't find a statistically significant "most likely open time." Start with Tuesday at 7 AM or 11 AM as a control, then test against your own audience. Your data beats everyone else's averages.
Mistakes That Kill Campaigns
The consensus on r/EmailWhisperers mirrors what we see in practice. The anti-patterns that keep showing up: automation without real personalization (a welcome series that says "Hi {first_name}" isn't personalized - one that references the product page they visited is), broken mobile layouts with untappable CTAs, blasting the full list because segmentation "takes too long," and relying on open-rate-based re-engagement automations that MPP has rendered useless.
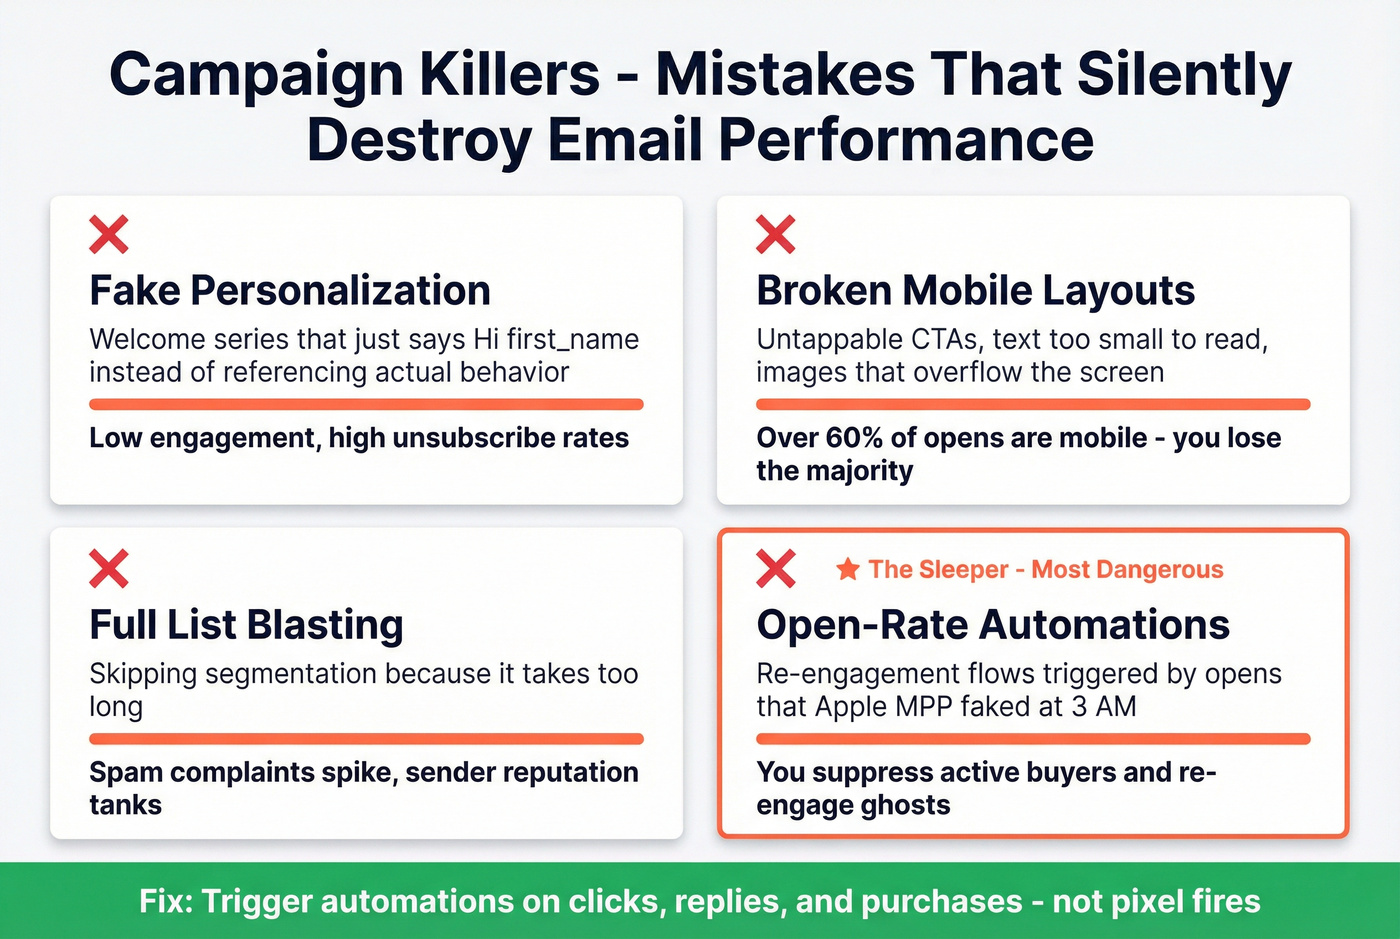
That last one is the sleeper. Teams are suppressing active subscribers and re-engaging ghosts because their trigger logic is built on a broken metric. We've watched companies accidentally churn their best customers this way while pouring re-engagement budget into phantom opens. Strong email engagement strategies depend on acting on reliable signals - clicks, replies, purchases - not pixel fires that Apple's proxy triggered at 3 AM (if you're building sequences, see personalized drip campaigns).
Optimizing flows and campaigns means nothing if you're sending to dead addresses. Teams using Prospeo cut bounce rates from 35%+ to under 4% and tripled pipeline - because every email actually reached a real inbox.
Clean data at $0.01/email beats repairing a burned domain.
FAQ
What's a good email bounce rate?
Under 2%. Higher rates signal stale data damaging your sender reputation. Real-time verification and weekly data refreshes - like what Prospeo runs on its 143M+ verified email database - keep bounce rates well below that threshold before you hit send.
Should I still track open rates?
Track them directionally, but don't use them as a primary KPI. Apple MPP inflates opens for roughly half your audience. Click-through rate, revenue per email, and conversion rate are more reliable indicators of actual engagement.
How often should I A/B test emails?
Every campaign, one variable at a time. Use a 20/20/60 split and wait for 95% confidence before declaring a winner. For smaller lists, most tests won't reach significance - ship your best judgment instead of chasing inconclusive data.