Email Campaign Tracking: What to Measure, What to Ignore, and How to Set It Up
Your CMO sees a 44% open rate and thinks the campaign crushed it. Then you check conversions: 12. That disconnect is what happens when your email campaign tracking relies on a metric that's been broken since 2021. Apple Mail Privacy Protection preloads tracking pixels via proxy servers, firing "opens" for emails nobody actually read - while masking IP addresses, device types, and timestamps. Stop treating open rate as a primary KPI. Track click rate, conversion rate, and bounce rate weekly. Tag every email link with UTMs, or GA4 will dump your traffic into (direct)/(none).
Here's the thing: most teams don't have a tracking problem. They have a list quality problem dressed up as a tracking problem. Fix the list first, then worry about dashboards.
Metrics That Actually Matter
Primary - track weekly:
- Click-through rate reflects genuine human interest. Campaign click rates typically cluster around 1.7%-2.6% across major benchmark reports - Klaviyo campaigns at 1.69%, MailerLite at 2.09%, Mailchimp at 2.62%. Click-to-open rate sits at 6.81% per MailerLite, which helps you compare engagement without leaning on raw opens. (If you want to standardize how you calculate it, use a consistent click rate formula.)
- Conversion rate is whatever your goal action is - demo booked, purchase, signup. It's the only metric your CFO cares about. (Tie it back to funnel metrics so email isn't judged in isolation.)
- Bounce rate is a deliverability KPI first. Keep it under 1.5% so it doesn't drag down sender reputation and distort every downstream metric. (More on fixing it in our email deliverability guide.)
- Unsubscribe rate on healthy lists sits around 0.22%. A spike means your content or frequency is off.
Secondary - track monthly:
Delivery rate should land between 97-99%. Below 95% signals a list hygiene or sender reputation problem. List growth rate matters too - email lists decay roughly 23% per year, so if you aren't actively growing, you're shrinking. Pull a tracking report at least monthly to catch decay before it tanks your sender score.
Vanity - directional only:
Open rate is useful mainly as a deliverability pulse check. MailerLite's median open rate rose from 42.35% in 2024 to 43.46% in 2025, consistent with MPP inflating opens rather than improving actual engagement. (If you still need a sanity check, see what is a good email open rate.)
2026 Benchmarks by Platform
| Source | Open Rate | Click Rate | Order/Conv. Rate | Unsub Rate |
|---|---|---|---|---|
| MailerLite (2025) - 3.6M campaigns, 181K accounts | 43.46% | 2.09% | - | 0.22% |
| Klaviyo (2026) - Campaigns - 183K+ brands | 31% | 1.69% | 0.16% | - |
| Klaviyo (2026) - Flows - 183K+ brands | - | 5.58% | 2.11% | - |
| Mailchimp (2023) - Billions of emails | 35.63% | 2.62% | - | 0.22% |
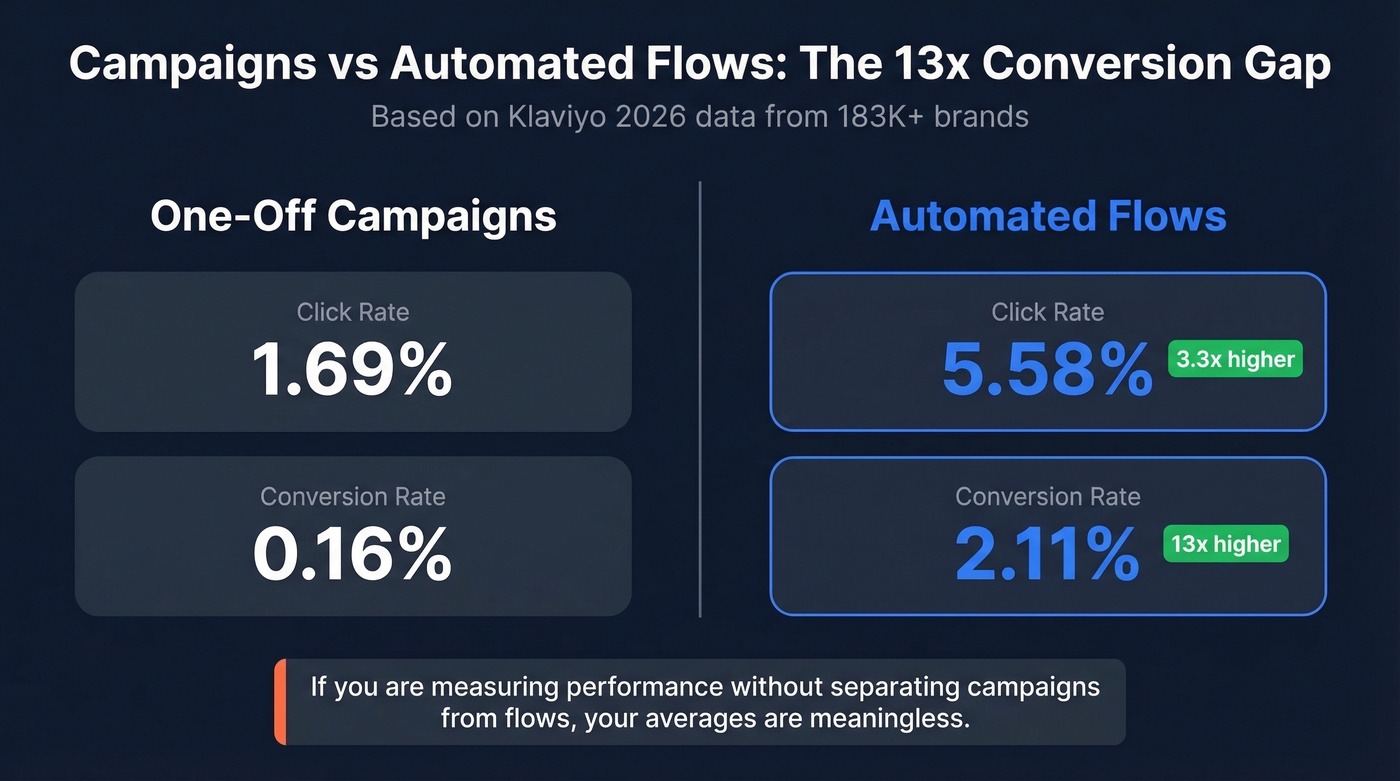
The campaigns-vs-flows split is the most important takeaway here. Klaviyo's automated flows generate a 5.58% click rate versus 1.69% for one-off campaigns - and a placed-order rate of 2.11% versus 0.16%. That's roughly a 13x difference in conversion. If you're measuring campaign performance without separating these two categories, your averages are meaningless.
Industry matters just as much. E-commerce sits lower at 32.67% open / 1.07% click, while non-profits lead at 52.38% / 2.90%. Software lands in between at 39.31% / 1.15%. We've seen teams panic over a 25% open rate when their click engagement was actually above their industry median - context saves you from bad decisions.
Setting Up Tracking in GA4
GA4 can't attribute email traffic without UTM parameters. Without them, email clicks often show up as referral traffic from webmail domains or land in (direct)/(none). Here's the minimum setup:
utm_medium=email
utm_source=newsletter
utm_campaign=spring_sale_2026_03
utm_content=hero_button
Three rules that save hours of debugging:
Keep everything lowercase. "Email" and "email" create separate rows in GA4, and inconsistent UTM structure is one of the most common reasons large organizations end up with fragmented, unreliable attribution.
Include a date in your campaign name for recurring sends. You'll thank yourself in three months when you're trying to compare March performance against June.
Use utm_content to differentiate links within the same email - hero button vs. footer link vs. inline CTA. This is how you figure out whether anyone actually scrolls past the fold.
Tag CTAs, key text links, and clickable images that drive funnel actions. Skip unsubscribe links, legal footers, and "view in browser" - these add noise without insight. Build your URLs with Google's Campaign URL Builder to avoid typos.
Find the data in Reports -> Acquisition -> Traffic acquisition, then change the primary dimension to Session source/medium.

Lists decay 23% per year. Every invalid address inflates your bounce rate and corrupts the tracking metrics you're building dashboards around. Prospeo's 5-step verification catches spam traps, honeypots, and dead addresses with 98% accuracy - on a 7-day refresh cycle, not the 6-week industry average.
Fix your list before you fix your dashboards.
Why Your Tracking Data Is Wrong
Bot clicks are the sneakiest problem. Security filters at enterprise companies pre-click links to scan for malware, inflating your CTR with phantom engagement. Many ESPs offer bot-activity filtering in reporting. Turn it on.
Then there's list decay. Email lists lose roughly 23% per year of valid addresses per year. People change jobs, abandon inboxes, get laid off. Every invalid address inflates your bounce rate and drags down sender reputation, which suppresses deliverability for everyone else on the list. (If you're actively cleaning, also watch for spam trap removal issues.)
Your tracking metrics are only as reliable as your list. We run every outbound list through Prospeo's email verification before sending - it catches invalid addresses, spam traps, and honeypots with 98% accuracy on a 7-day data refresh cycle. Verifying your list isn't optional; it's a prerequisite for trusting any metric in your dashboard.
Bot clicks, MPP-inflated opens, and phantom engagement all start with the same root cause: sending to addresses that shouldn't be on your list. Prospeo verifies 143M+ emails at $0.01 each - no contracts, no sales calls. Clean data in, clean tracking out.
Stop optimizing metrics that bad data already broke.
Common Tracking Mistakes
The biggest mistake is treating open rate as a primary KPI. It's a deliverability canary, not a performance metric. Following up based on a single open is equally wasteful - use patterns instead. Multiple opens combined with clicks or replies before triggering sales outreach. (If you're optimizing the email itself, start with email subject lines and your email call to action.)
Missing UTMs on email links turns every click into invisible revenue inside GA4. And if marketing sees clicks but sales doesn't see attribution because tracking isn't connected to your CRM, you'll never prove email's value. (This is where it helps to connect outreach tool to CRM.)
We've watched teams spend entire quarters building dashboards while ignoring the fact that their automated flows were doing all the heavy lifting. Why? They lumped campaigns and flows into one report. Let's be honest - if you aren't separating those two categories, you're optimizing blind. Drilling down by recipient segment reveals which contacts are genuinely engaged versus which are just inflating your aggregate numbers.
Skip building a custom attribution model if you have fewer than 10,000 monthly email sends. The statistical noise won't give you anything actionable. Focus on clean UTMs and basic GA4 reporting first.
Why Email Gets Under-Credited
Email generates $36 per $1 spent - some studies put it as high as $42. But last-click attribution, the default in most analytics setups, gives 100% credit to the final touchpoint. Email rarely gets that last click.
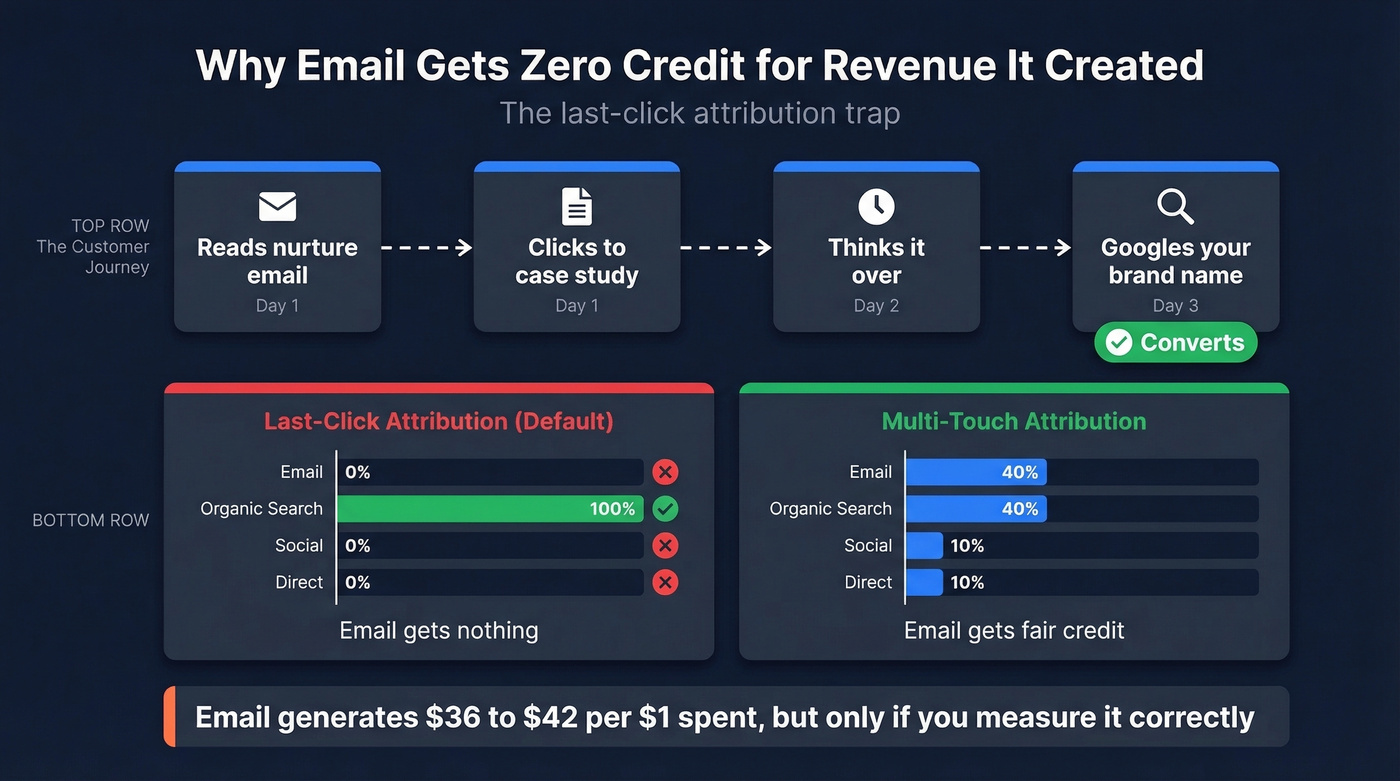
Here's a scenario we see constantly: someone reads your nurture sequence, clicks through to a case study, then converts two days later via a branded Google search. Google gets the credit. Email gets nothing.
Multi-touch models distribute credit more fairly, but they require consistent UTM tagging across every channel. Without that foundation, email will always look like it underperforms. Building dedicated reports that compare assisted conversions alongside last-click data gives you a far more honest picture of email's contribution to revenue - and it's the only way to justify budget increases to leadership who live in GA4.
FAQ
Do email open rates still matter in 2026?
Open rates serve as a deliverability pulse check, not a performance metric. Apple MPP preloads tracking pixels and inflates opens across all Apple Mail users - roughly 50%+ of consumer inboxes. A sudden drop may signal inbox placement issues, but don't use open rate to judge campaign success. Click rate and conversions are far more reliable.
What's a good click-through rate?
Across major platforms, campaign click rates commonly land around 1.7%-2.6%. Automated flows perform significantly better - Klaviyo reports 5.58% for flows versus 1.69% for campaigns. If you're consistently below 1.5%, test your CTAs, segmentation, and send timing before blaming the channel.
How do I make sure my tracking data is accurate?
Tag every link with consistent, lowercase UTMs so GA4 attributes correctly. Verify your list regularly - lists decay about 23% per year, and invalid addresses corrupt engagement metrics. Enable bot-activity filtering in your ESP's reporting settings to strip phantom clicks. And separate your campaign metrics from your flow metrics, because combining them hides what's actually working.