Email Click Rate: The Only Engagement Metric You Can Trust in 2026
Your CMO asks "what's our email click rate?" and you realize you don't know which number to give them. The dashboard shows multiple percentages - click rate, CTR, CTOR - and they don't agree. Worse, you're not sure which one actually means anything after Apple killed open tracking.
Click rate is the cleanest engagement metric left. Most teams are measuring it wrong, benchmarking it wrong, or letting bots inflate it without realizing.
What You Need (Quick Version)
- Your click rate depends on email type, not just industry. Welcome and automated flows average 5.58% vs. campaigns at 1.69% per Klaviyo's 2026 benchmarks. Comparing them is meaningless.
- Clicks are the cleanest engagement signal post-Apple MPP. Open rate is inflated. Click-to-open metrics rely on a polluted opens count. Clicks divided by delivered measures intentional action - nothing else is as dependable at scale.
- Before optimizing copy or CTAs, clean your list. Low-quality addresses inflate "delivered" counts and mechanically depress your rate. Fix the data first.
What Is Email Click Rate?
This metric measures the percentage of delivered emails where someone actually clicked a link:
Click Rate = (Unique Clicks / Emails Delivered) x 100
No opens in the equation. No guesswork about whether someone "saw" your email. A click is a deliberate action - someone read your message, found something worth clicking, and did it. In a world where tracking pixels are unreliable, that's as close to a clean engagement signal as you'll get.
Click Rate vs. CTR vs. CTOR
Different ESPs label these differently, and the numbers can diverge wildly. Here's a concrete example from a HubSpot Community thread that nails the distinction:
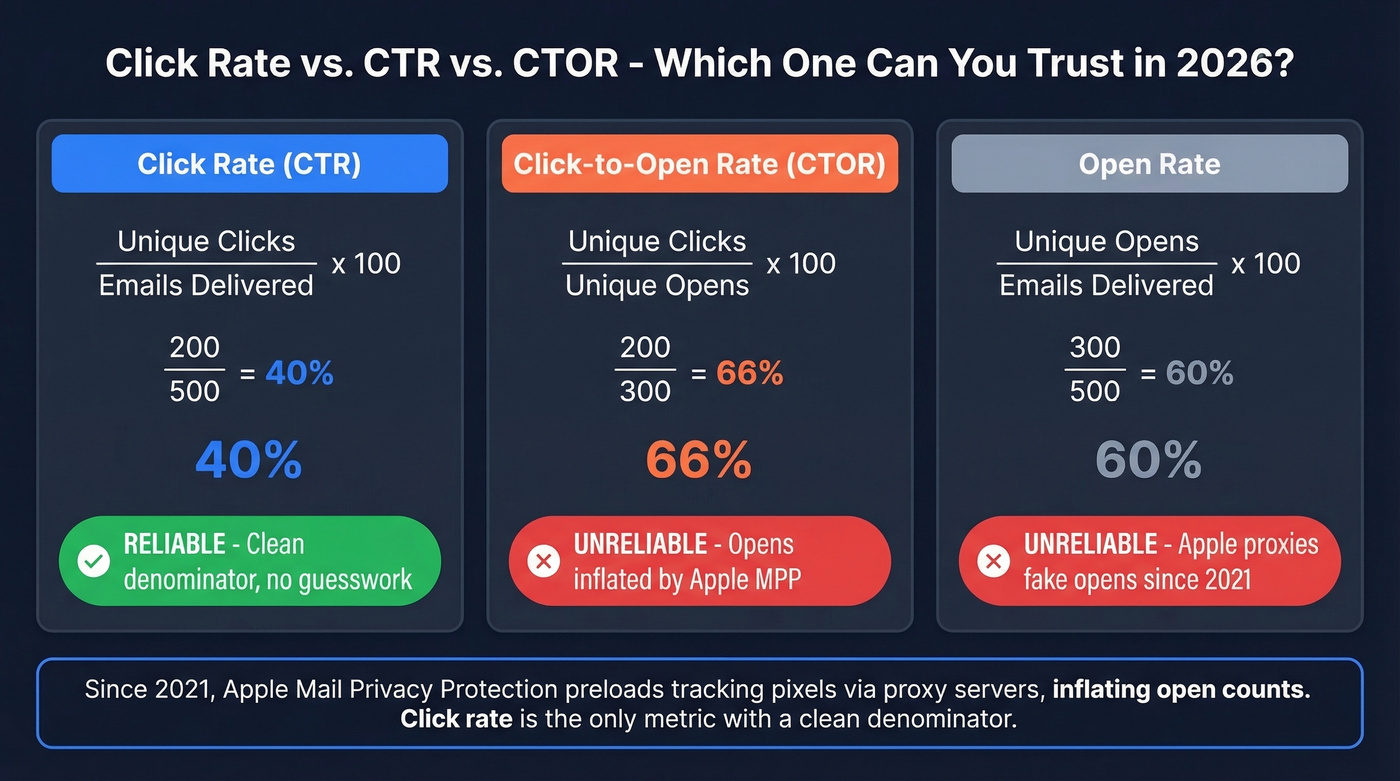
Scenario: You send 500 emails. 300 get opened. 200 generate a click.
| Metric | Formula | Example Result | Reliable Post-MPP? |
|---|---|---|---|
| Click rate | Clicks / Delivered x 100 | 40% | Yes |
| Click-to-open rate (CTOR) | Clicks / Opens x 100 | 66% | Opens inflated |
| Open rate | Opens / Delivered x 100 | 60% | Inflated |
CTOR looks great at 66%, but it relies on an opens count that Apple MPP has been inflating since 2021. If a chunk of those "opens" were Apple's proxy servers preloading your tracking pixel, your real CTOR is lower than reported. Open rate tells you about subject line performance in theory, but click rate tells you whether the email content actually drove action.
Track click rate. It's the one with the clean denominator.
To double-check the math and definitions, see our guide on the click rate formula.
You just read it: click rate only means something when your denominator is clean. Prospeo's 5-step email verification - with catch-all handling, spam-trap removal, and honeypot filtering - keeps bounce rates under 4% so every "delivered" email is a real inbox. At $0.01 per email, cleaning your list costs less than one bad campaign.
Stop optimizing click rate against phantom addresses. Verify first.
Why This Metric Matters Now
Apple Mail Privacy Protection broke open tracking. Since 2021, Apple's mail clients preload tracking pixels via proxy servers, registering an "open" even when nobody read the email. Open rates are inflated across the board, and any metric using opens as a denominator - including CTOR - is compromised.
This isn't theoretical. Brevo's benchmark study analyzed 44+ billion emails and explicitly accounts for Apple MPP in its methodology.
Clicks don't care about any of this. A click requires a human to move their finger or mouse to a link and press it. No proxy server does that. No privacy feature fakes it. Bots do - but we'll get to that.
If you want the technical breakdown of what’s being faked, start with email tracking pixels.

2026 Benchmarks by Industry and Type
A single average with zero context isn't a benchmark - it's a guess. You need to know what type of email you're sending and who you're sending it to.
Benchmarks by Industry
Mailchimp's benchmark data remains the most widely cited industry breakdown. Their analysis covered billions of delivered emails where campaign tracking was activated and users reported their industry, and it only included campaigns sent to at least 1,000 subscribers.
| Industry | Avg. Click Rate | Avg. Open Rate (MPP-inflated) |
|---|---|---|
| All Users | 2.62% | 35.63% |
| Non-Profits | 3.27% | 40.04% |
| Education & Training | 3.02% | 35.64% |
| Business & Finance | 2.78% | 31.35% |
| Ecommerce | 1.74% | 29.81% |
A MailerLite study puts the cross-industry average at 2.09%, which tracks closely. The common baseline you'll hear from B2B practitioners is that ~2-3% on campaign sends is normal - and frustratingly hard to move.
If you’re still using opens for context, compare against a modern standard email open rate (with MPP caveats).
Benchmarks by Email Type
This is where most benchmark articles fall short. They give you one number and call it a day, but the gap between email types is enormous:
| Email Type | Typical Click Rate Range |
|---|---|
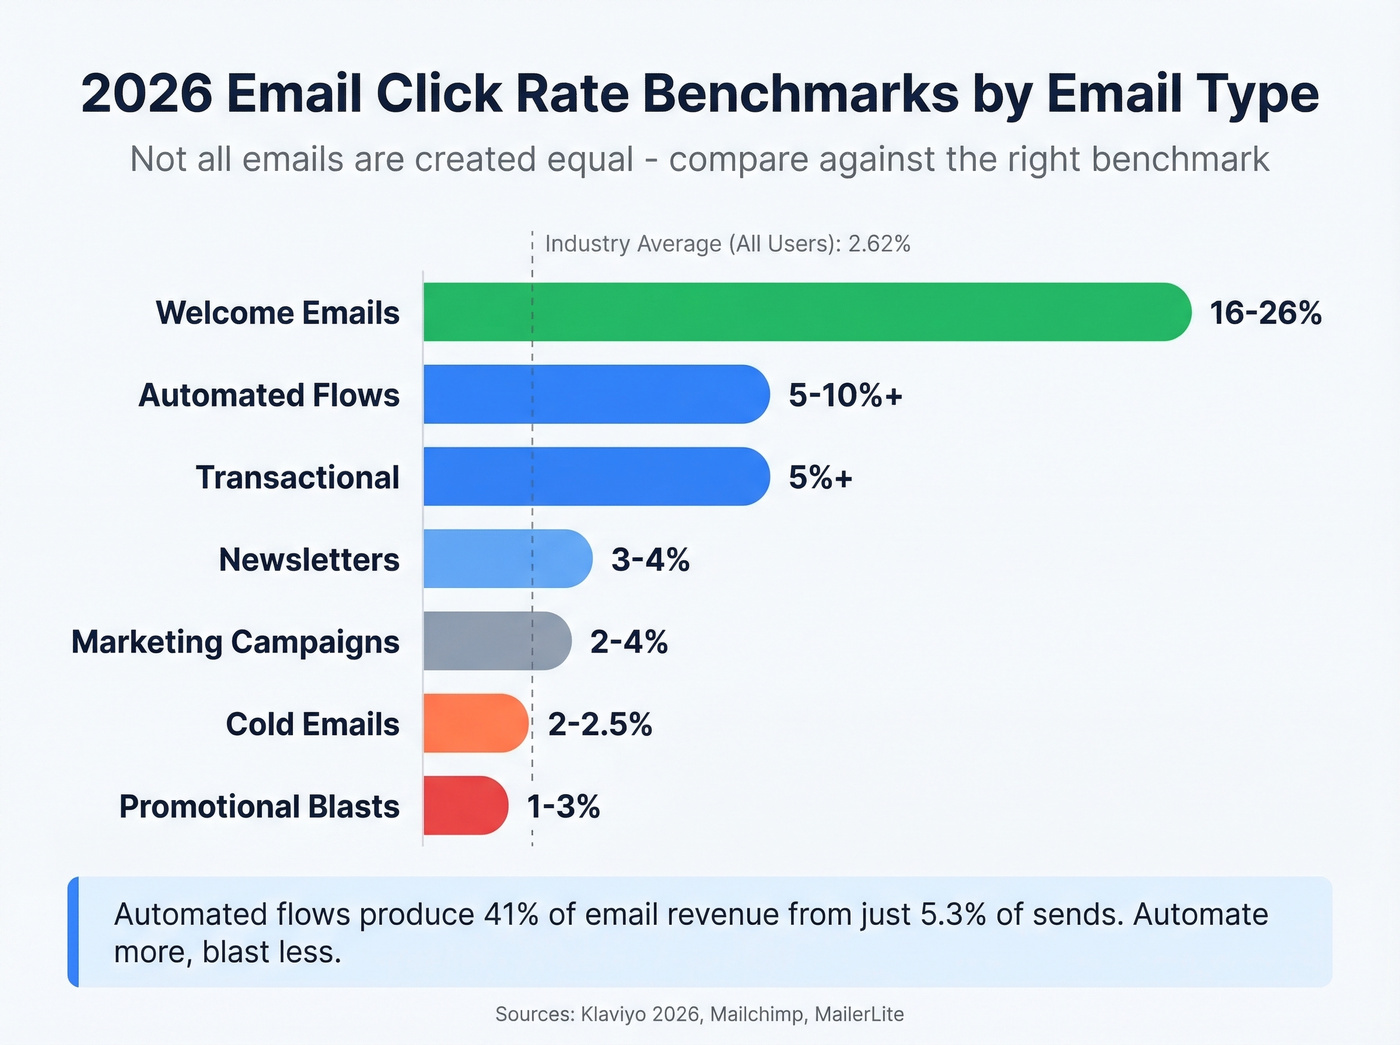
| Welcome emails | 16-26% |
| Automated flows/triggered | 5-10%+ |
| Transactional | 5%+ |
| Newsletters | 3-4% |
| Marketing campaigns | 2-4% (most land at 2-3%) |
| Promotional blasts | 1-3% |
| Cold emails | 2-2.5% |
If you're benchmarking your welcome sequence against your newsletter average, you're doing it wrong. Klaviyo's 2026 ecommerce benchmarks make this painfully clear: flows average 5.58% click rate vs. 1.69% for campaigns. Flows generate ~41% of total email revenue from just 5.3% of sends. Automate more, blast less.
For cold outreach specifically, use cold email marketing benchmarks instead of newsletter data.
Build Your Own Baseline
Industry averages are starting points, not targets. Pull your last 90 days of sends, separate by email type, and calculate your own per-type rate. That's the number to beat.
We've seen teams obsess over industry benchmarks when their own 90-day trend tells a much clearer story - a 0.3% improvement over your baseline matters more than chasing someone else's average.
Bot Clicks Are Inflating Your Numbers
You've optimized your subject lines, tightened your CTAs, and your click rate jumped. Congratulations - except a chunk of those clicks are probably security scanners.
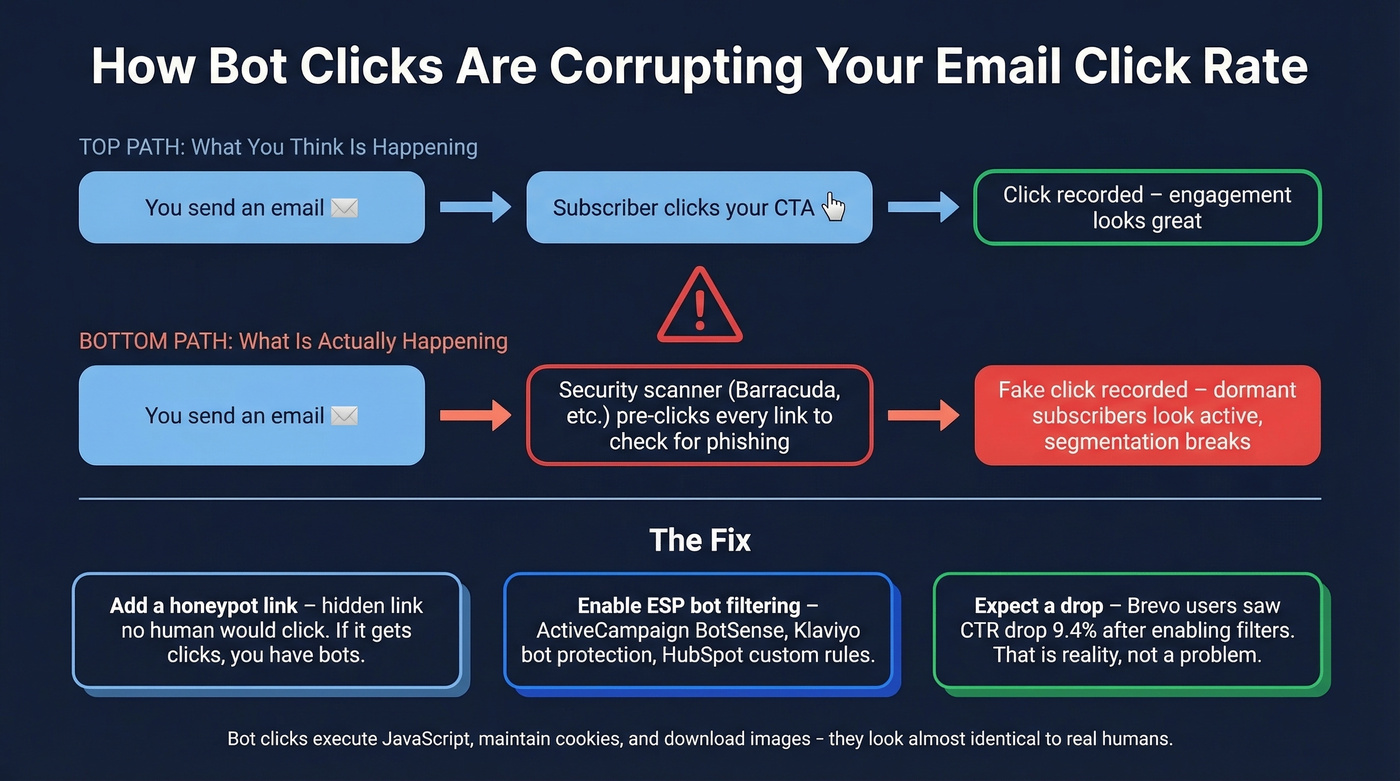
Tools like Barracuda pre-click links in an email to check for phishing and malware. That activity shows up in your reporting as a human click. Dormant subscribers suddenly look like your most engaged contacts, which breaks segmentation and makes list-cleaning logic useless. Modern scanners execute JavaScript, maintain cookies across redirects, and download images on landing pages, making them nearly impossible to distinguish from real humans.
Here's the thing: bot clicks are a bigger threat to your email strategy than low open rates. Open rates were always a vanity metric. But if bots are corrupting your click data - the one metric you can still trust - your entire segmentation and engagement model is built on sand.
The practical fix: add a honeypot link that no human would click, hidden in punctuation or styled invisibly. If it gets clicks, you've got bot traffic. Then turn on your ESP's filtering - ActiveCampaign has BotSense, Klaviyo has bot protection in reporting, HubSpot supports custom rules, and Constant Contact filters by default. These settings are easy to miss, and many teams never enable them.
When Brevo users turned on bot filtering, their newsletter CTR dropped by 9.4%. That's not a decline in performance. That's reality finally showing up in the dashboard.
Bot clicks aren't the only thing inflating your metrics. Emails delivered to low-quality addresses pad your denominator without any chance of engagement. Verify your list before analyzing engagement data - otherwise you're optimizing against phantom numbers.
If you’re seeing deliverability weirdness alongside bot clicks, start with email deliverability and email bounce rate.
How to Improve Your Email Click Rate
Clean Your List First
Here's the logic chain most marketers miss: low-quality addresses don't always show up as obvious hard bounces. Catch-alls, abandoned inboxes, and old data can still get counted as "delivered," inflating the denominator in your click rate formula without adding any real chance of a click. We ran into this ourselves when a client's "delivered" count looked healthy but engagement was tanking - turned out 18% of their list was dead weight.
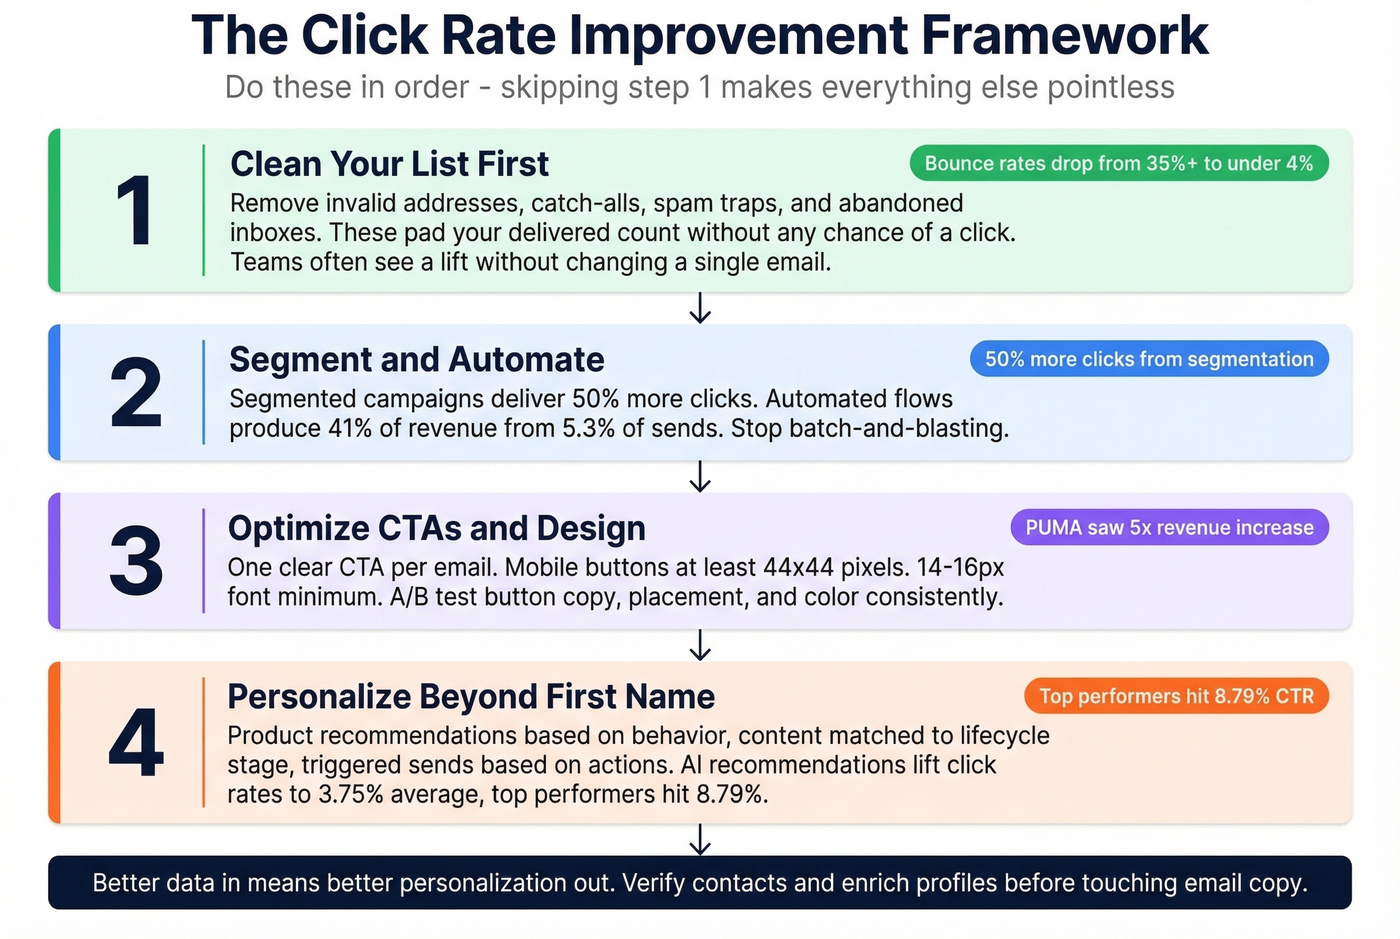
Teams often see a material lift after a cleanup, without changing a single email. That's not magic - that's math. Prospeo's email verification catches invalid addresses, spam traps, and honeypot emails through a 5-step process with catch-all handling built in.
If you suspect traps are part of the problem, follow a dedicated spam trap removal process.
Segment and Automate
Batch-and-blast is the fastest way to a 1% click rate. Segmented campaigns deliver 50% more clicks than unsegmented sends, per SAP Emarsys data. Krispy Kreme saw 70% more website clicks after moving to automated lifecycle segments. Welcome sequences alone generate 10x more clicks than standard campaigns.
The flows-vs-campaigns split bears repeating: automated flows produce ~41% of email revenue from 5.3% of sends. If you're sending 95% campaigns and 5% flows, flip that ratio as aggressively as your content calendar allows.
Optimize CTAs and Design
PUMA saw a 5x increase in email-attributed revenue after redesigning their email program. John Frieda doubled their click-to-open rate with better segmented nurture sequences. These aren't small tweaks - they're structural changes to how emails look and function.
The basics still matter: one clear CTA per email, mobile-optimized design with buttons at least 44x44 pixels and 14-16px font, and consistent A/B testing on button copy, placement, and color. Anything smaller than that minimum gets missed on phones, and the consensus on r/emailmarketing is that mobile rendering issues are the most common silent killer of click rates.
If you need a tighter framework for buttons and offers, use these email call to action rules and examples.
Personalize Beyond First Name
"Hi {first_name}" isn't personalization anymore - it's table stakes. Real personalization means product recommendations based on browsing behavior, content matched to lifecycle stage, and triggered sends based on actions rather than demographics.
AI-powered product recommendations lift average click rates to 3.75%, with top performers hitting 8.79%. Behavioral triggers outperform demographic blasts consistently. In our experience, the teams that see the biggest jumps invest in data quality upstream - verified contacts, enriched profiles, proper segmentation - before they ever touch email copy. Better data in means better personalization out. Skip this step if you haven't cleaned your list yet; personalization on dirty data just means you're personalizing to ghosts.
If you’re rebuilding your messaging, pair personalization with stronger email copywriting fundamentals.
Your click rate benchmarks are useless if you're sending to abandoned inboxes and catch-all domains that pad your delivered count. Prospeo refreshes 300M+ contacts every 7 days - not every 6 weeks like most providers. Teams using Prospeo data see bounce rates drop from 35%+ to under 4%.
Clean denominator, real click rate. That's the only math that works.
FAQ
What's a good email click rate for B2B?
Most B2B marketers see 2-3% on campaign sends, and that's benchmark performance. Automated flows and welcome sequences should hit 5-10%+. Always compare against your specific email type - a 2.5% newsletter rate and a 7% welcome flow rate are both healthy, but lumping them together hides what's working.
Is a 1% click rate bad?
For promotional blasts, 1% falls within the typical 1-3% range and isn't cause for alarm. For newsletters or automated flows, it signals poor segmentation, weak CTAs, or a list full of disengaged contacts. Clean your list and segment by engagement before rewriting copy - the fix is usually upstream.
How is click rate different from open rate?
Open rate measures tracking-pixel fires (opens divided by delivered), while click rate measures actual link clicks (clicks divided by delivered). Since Apple MPP began inflating open counts in 2021, the gap between these metrics has widened artificially. Click rate remains an accurate reflection of subscriber intent and is the more reliable metric for 2026 reporting.
Should I track click rate or open rate?
Click rate. Apple Mail Privacy Protection inflates open rates by preloading tracking pixels via proxy servers, making opens unreliable since 2021. Clicks divided by delivered measures intentional human action and isn't affected by MPP. It's the cleanest engagement signal available for email marketers right now.
How can I tell if bots are inflating my clicks?
Add a hidden honeypot link - invisible to humans - and monitor it for clicks. Any activity on that link is bot traffic. Then enable your ESP's bot filtering: ActiveCampaign BotSense, Klaviyo bot protection, HubSpot custom rules. Brevo users saw reported CTR drop 9.4% after enabling filters, revealing the true human engagement rate underneath.