Expansion Rate: The SaaS Metric Your Revenue Team Is Undervaluing
You're pouring budget into net-new pipeline while your existing customers quietly outgrow their contracts - and nobody on your team notices until they've already bought the add-on from a competitor. Expansion rate is the metric that catches this. Most revenue teams track it loosely or not at all, and it's costing them real money.
The Short Version
This metric measures revenue growth from existing customers through upsells, cross-sells, and add-ons.
A healthy SaaS business pairs strong expansion with strong net revenue retention (NRR). Many solid B2B SaaS companies run NRR around 110-120%, and top performers push 130%+. The formula:
(Expansion MRR / Starting MRR) x 100
The biggest lever most teams miss? Layering intent data and fresh enrichment onto existing accounts so your expansion team knows who's ready to buy more - not six weeks after the fact.
What Is Expansion Rate?
Not the Hubble constant. This is the SaaS metric. Expansion rate quantifies how much additional revenue you generate from current customers over a given period, expressed as a percentage of starting MRR. Upsells move customers to a higher plan, cross-sells bring them into adjacent products, and add-ons cover seats, usage, and modules.
It's distinct from general revenue growth because it isolates the existing-customer motion entirely. A company growing 40% year-over-year might be doing it all through new logos, which is expensive and fragile. This metric tells you whether customers are finding increasing value after they've signed - a fundamentally different signal than top-of-funnel velocity.
Why Expansion Revenue Matters
Acquiring a new customer often costs 5-25x more than expanding an existing one. That ratio alone should make this a board-level metric, but most companies still treat it as a CS afterthought.
Investors obsess over this number because expansion changes everything downstream: CAC payback, unit economics, and how "durable" your growth is. High expansion rates compress CAC payback periods and signal product-market fit in a way new-logo growth simply can't. A rising average revenue per account is one of the clearest signs that your upsell motion is working - it means customers are spending more over time, not just sticking around.
Here's the hot take: if your average deal size is under $15K and your expansion revenue is flat, you probably don't have a sales problem. You have a product problem. Customers who aren't expanding are telling you something.
How to Calculate Expansion Rate
The formula is straightforward:
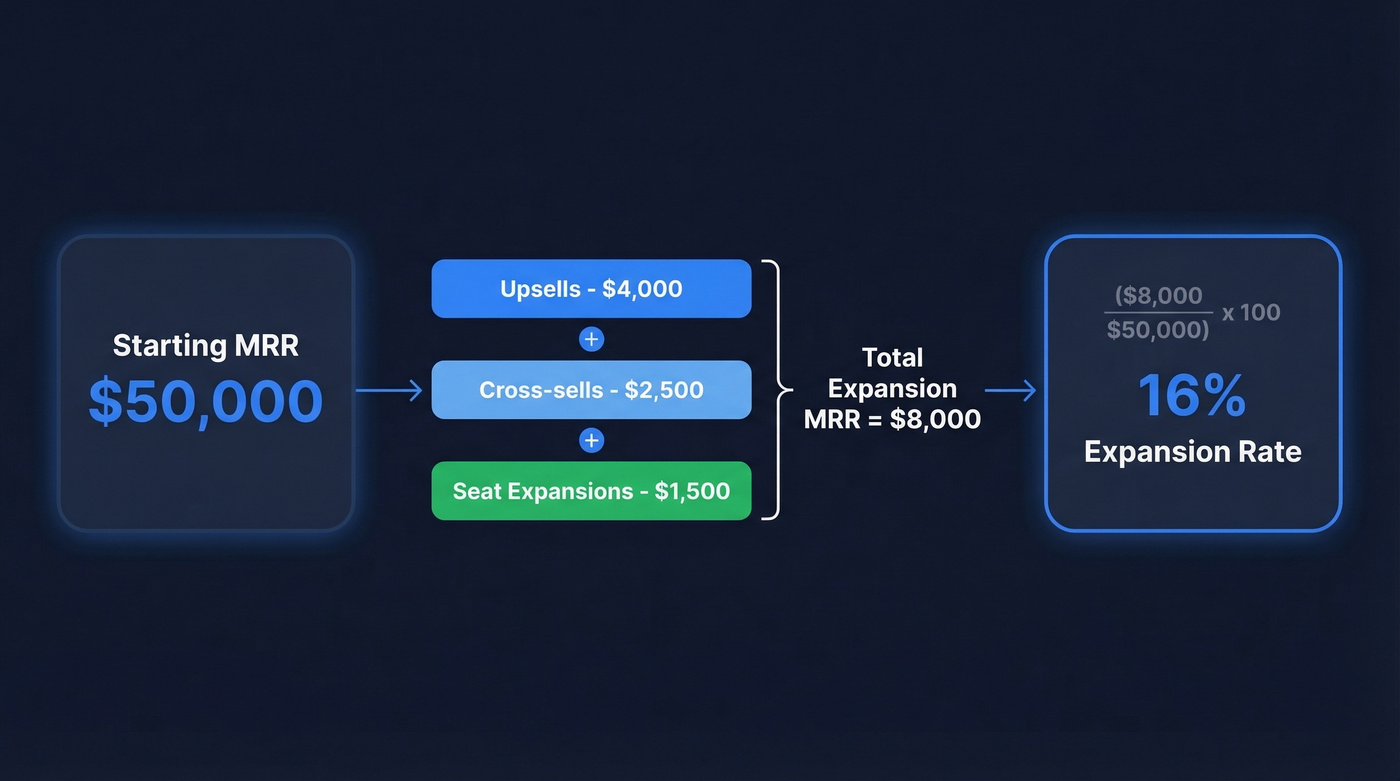
Expansion Rate = (Expansion MRR / Starting MRR) x 100
Say you start the month with $50,000 in MRR from existing customers. Upsells contribute $4,000, cross-sells add $2,500, and seat expansions bring $1,500. Total expansion MRR: $8,000.
($8,000 / $50,000) x 100 = 16%
That 16% means your existing base generated expansion equal to 16% of starting MRR in the period - before accounting for churn or contraction.
One important distinction: this metric isolates the growth side. Net revenue retention nets expansion against churn and contraction. You can have strong upsell numbers and still post weak NRR if customers are churning out the back door. Expansion rate measures your growth engine. NRR measures the net result.
Your existing customers are researching add-ons right now - and your expansion team has no idea. Prospeo tracks buyer intent across 15,000 topics with a 7-day refresh cycle, so your CSMs see upsell signals while they're still actionable. Layer intent data onto your accounts and stop losing expansion revenue to competitors.
Turn existing accounts into your fastest-growing revenue channel.
Expansion Rate vs. Related Metrics
| Metric | Definition | What It Tells You | Track This If... |
|---|---|---|---|
| Expansion Rate | Revenue growth from existing customers | Upsell/cross-sell effectiveness | You want to measure growth engine health |
| NRR | Expansion minus churn/contraction | Net customer base health | You need the full revenue picture |
| GRR | Revenue retained, no expansion | Pure retention strength | You suspect a churn problem |
| Churn Rate | Revenue or customers lost | Leakage speed | Accounts are leaving and you need to quantify it |
| LTV | Total revenue per customer lifetime | Long-term account value | You're modeling CAC payback |
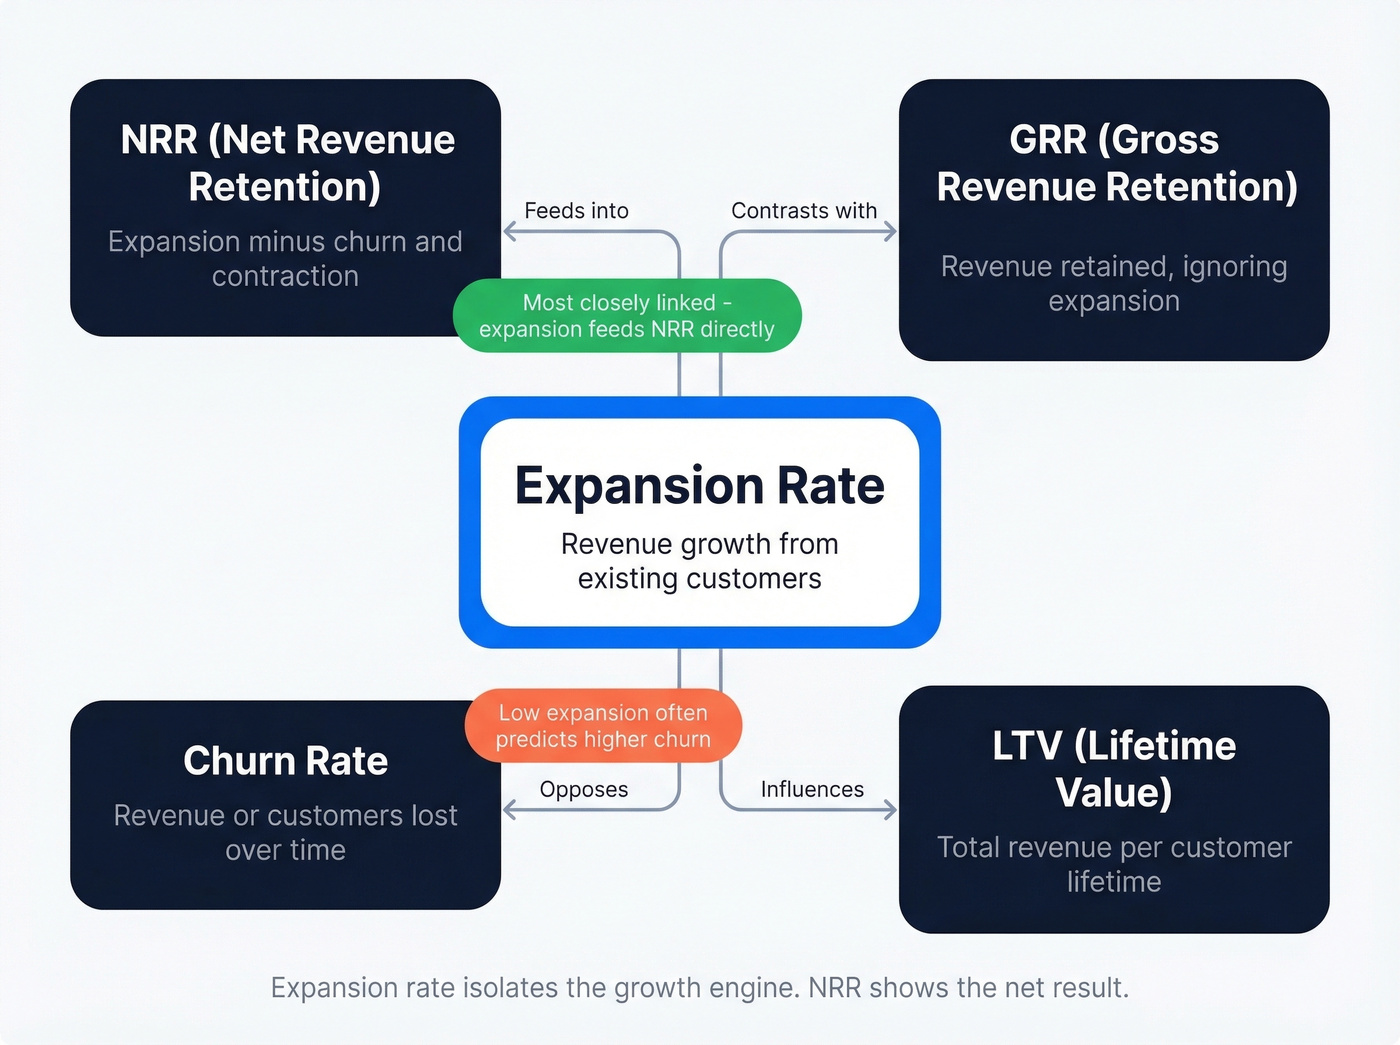
If expansion is consistently low, it often correlates with retention risk. Customers who aren't growing their spend are usually the ones most vulnerable to churn - they just haven't raised their hand yet.
What's a Good Expansion Rate?
Benchmarks vary by stage and pricing model, but here's a practical framework for B2B SaaS in 2026:
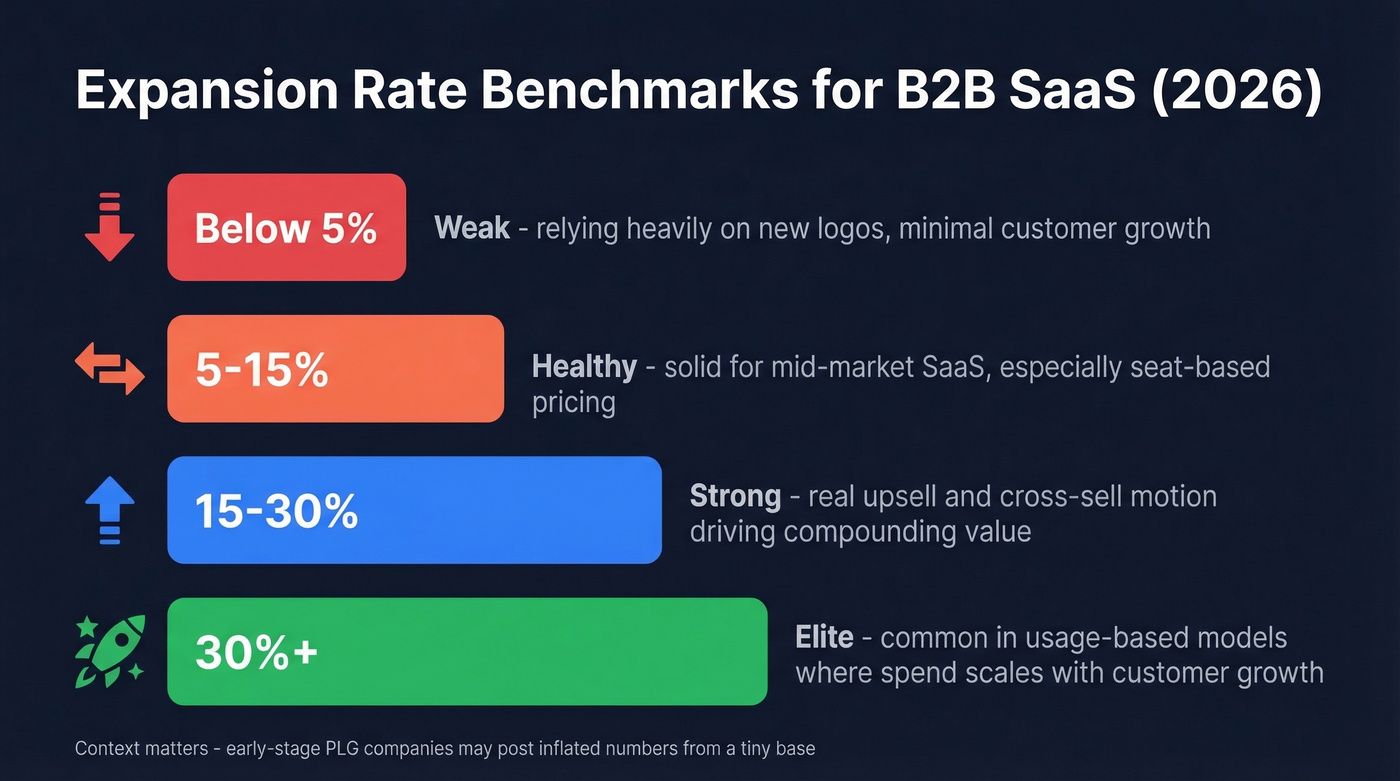
Below 5% - weak. Existing customers aren't growing much, so you're relying heavily on new logos.
5-15% - healthy for many mid-market SaaS companies, especially with seat-based pricing.
15-30% - strong. You've built a real upsell/cross-sell motion and customers are compounding value.
30%+ - elite. More common in usage-based models where spend naturally scales with customer growth. OpenView's 2023 benchmarks showed usage-based companies consistently outperforming seat-based models on expansion.
Early-stage PLG companies sometimes post inflated numbers because their starting base is tiny. Context matters.
Five Tactics to Improve Expansion Rate
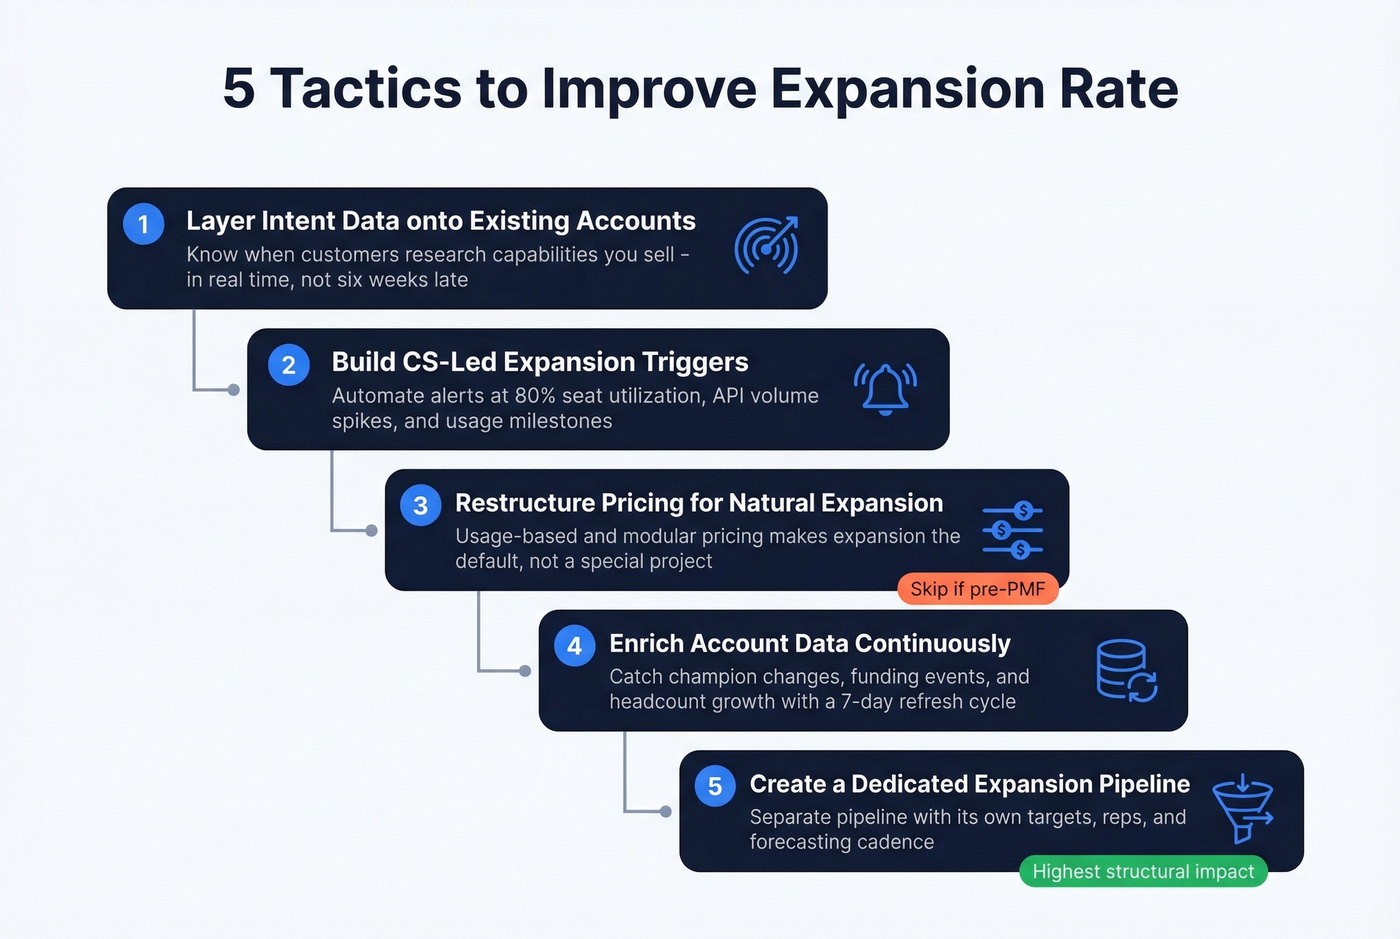
1. Layer Intent Data onto Existing Accounts
Most expansion teams work off gut feel and quarterly business reviews. That's leaving money on the table. When an existing customer starts researching a capability you offer as an add-on, your expansion team should know in real time - not six weeks later when the deal is lost.
If you're building this motion, start with intent data segmentation so your team isn't chasing noise.
We've seen teams transform their expansion pipeline by adding intent signals from Bombora-powered platforms to their existing account views. Prospeo tracks buyer intent across 15,000 topics and refreshes account data every 7 days. When your customer's engineering team starts evaluating a technology you sell, your CSM gets that signal while it's still actionable. The difference between "we noticed you're exploring X" and "hey, just checking in" is the difference between a warm upsell and a cold email.
2. Build CS-Led Expansion Triggers
Usage milestones are the most reliable expansion signals you have. When a customer hits 80% seat utilization, that's a buying signal. When API call volume doubles quarter-over-quarter, someone's building deeper into your platform.
Map these triggers explicitly. Define thresholds, automate alerts, and give your CS team a playbook for each one. Teams that systematize these triggers consistently grow expansion pipeline because they stop relying on memory and "good CSM instincts." The consensus on r/CustomerSuccess is that formalized trigger playbooks outperform ad-hoc expansion efforts by a wide margin - and our experience backs that up.
To operationalize this, use a simple framework for identifying buying signals and a repeatable process for how to track sales triggers.
3. Restructure Pricing for Natural Expansion
Usage-based and modular pricing architectures make expansion the path of least resistance. If a customer has to negotiate a new contract to add five seats, you've created friction where there should be none. The goal: make expansion feel like the default, not a special project.
Skip this tactic if you're pre-PMF. Pricing restructuring is expensive and disruptive - don't do it until you know which expansion motions actually work for your customer base.
If you need a clearer playbook for the motion itself, see upsell vs cross-sell in SaaS.
4. Enrich Account Data Continuously
Stale CRM records kill expansion motions silently. Your champion changed roles three months ago, the company raised a Series C, headcount doubled - but your CRM still shows last year's data.
In our experience, the companies posting the strongest expansion numbers all share one trait: they treat account data as a living asset, not a static record. CRM enrichment that returns 50+ data points per contact and surfaces headcount changes, funding signals, and firmographic shifts tells you which accounts can expand right now. A 7-day refresh cycle catches changes that a quarterly data audit never will.
If you're evaluating vendors, compare data enrichment services and the mechanics of lead enrichment.
5. Create a Dedicated Expansion Pipeline
Stop treating expansion as a CS afterthought. Build a separate pipeline with its own targets, reporting, and forecasting cadence.
Let's be honest - companies with dedicated expansion motions outperform teams that lump it into general CS responsibilities. It's not close. Expansion gets real ownership, real forecasting, and real reps. One mid-market SaaS company we spoke with saw their expansion rate jump from 8% to 22% within two quarters of splitting expansion into its own pipeline with a dedicated AE. The structural change mattered more than any individual tactic.
If you're tightening reporting, align this with broader sales operations metrics and a consistent view of pipeline health.
Why Stale Data Kills Expansion Revenue
You're looking at your top 50 accounts. Twelve expanded headcount by 30%+ this year. But your CRM still shows contact info from when they were a 40-person startup. Your expansion team is emailing people who left six months ago.
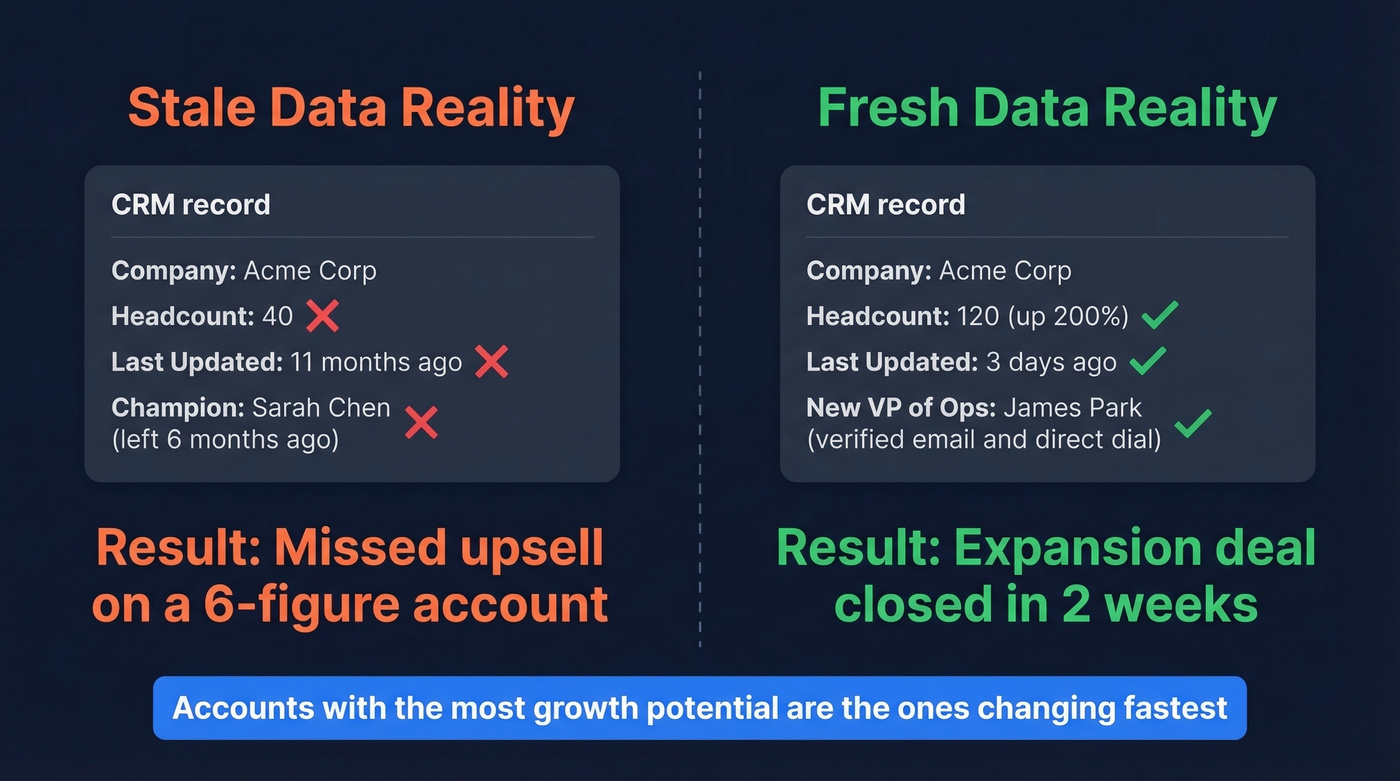
The accounts with the most growth potential are exactly the ones changing fastest - new hires, new budget, new needs. The cost of a missed upsell on a six-figure account dwarfs the cost of keeping your data fresh. If you're running an expansion motion on data older than a month, you're flying blind.
Expansion rate improves when your team reaches the right stakeholders at the right time. Prospeo enriches your CRM with 50+ data points per contact at 92% match rate - so when an account hits an expansion trigger, you already have verified emails and direct dials for every decision-maker involved.
Stop losing upsells because you couldn't reach the new buyer in time.
FAQ
What's the difference between expansion rate and NRR?
Expansion rate isolates revenue growth from upsells, cross-sells, and add-ons - it only measures the upside. NRR nets that expansion against churn and contraction, giving you the full picture. You can post 20% expansion and still have weak NRR if too many customers leave.
Is 120% expansion rate good?
120% is an excellent NRR number, not a typical expansion rate figure. Expansion rate is usually expressed as the growth component alone - for example, 10-30% monthly expansion MRR. If your NRR is 120%, your existing customers are generating 20% net growth after churn, which puts you in top-quartile territory for B2B SaaS.
How do you identify which accounts are ready to expand?
Layer intent data and enrichment onto your CRM to surface accounts showing buying signals - headcount growth, funding events, and active research into capabilities you offer. Real-time signals beat quarterly reviews every time, and the gap between teams using live data and teams running off stale records only widens as accounts grow.