Go-to-Market Sales Plan Template (2026) - With Real Numbers
Your VP of Sales just asked for the Q1 GTM plan, and all you've got is a positioning doc from product marketing. That's not a sales plan - it's a strategy deck with no math.
Most go-to-market sales plan templates floating around online skew marketing-heavy: pretty slides, vague personas, zero pipeline numbers. This one includes coverage ratios, quota math, and a worked example you can plug your numbers into today. We've used this structure across multiple launches, and the difference between teams that do the math and teams that skip it is brutal.
What Your GTM Sales Plan Actually Needs
One plan. Six sections. Real numbers:
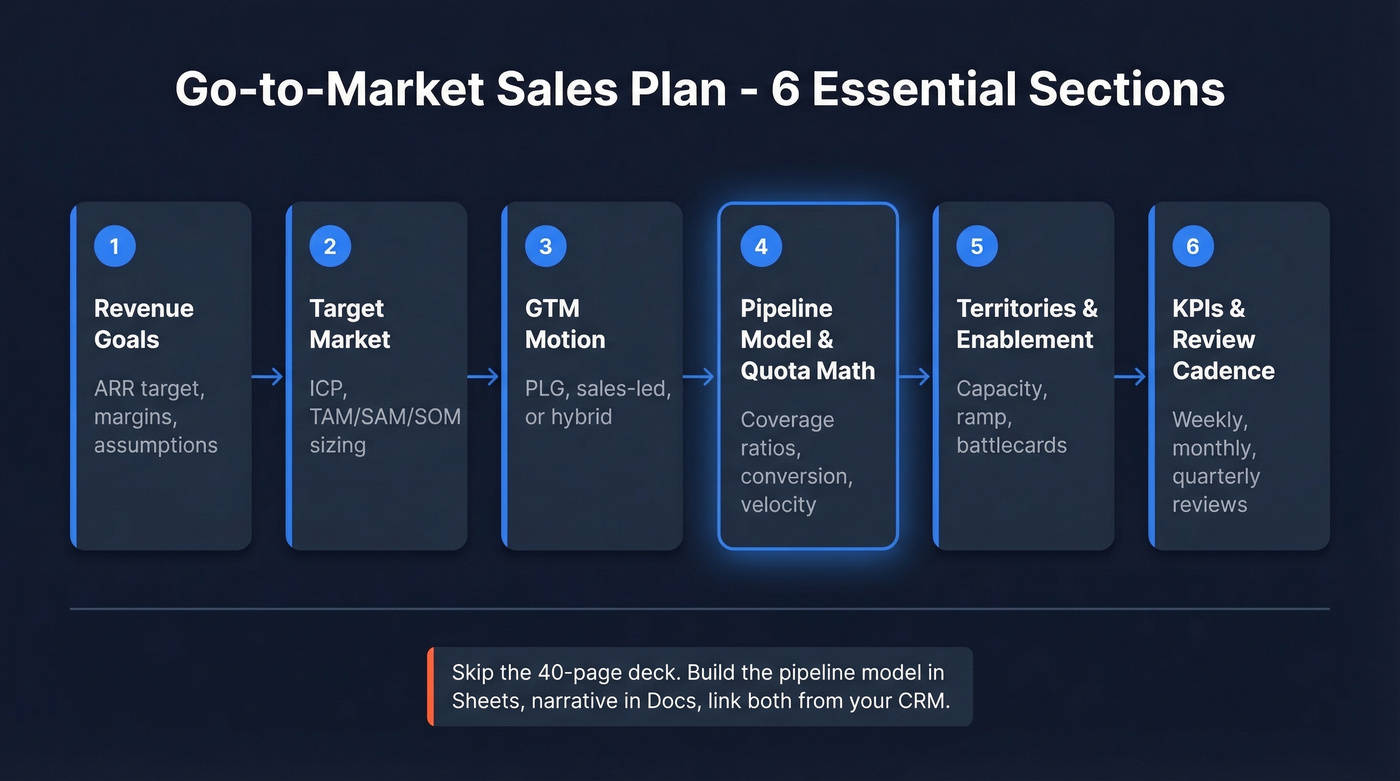
- Executive summary & revenue goals
- Target market - ICP, TAM/SAM/SOM
- GTM motion - PLG, sales-led, or hybrid
- Pipeline model & quota math - coverage ratios, conversion rates, velocity
- Territories, capacity & enablement
- KPIs, forecasting & review cadence
That's the entire skeleton. Everything else is decoration. Build the pipeline model in Google Sheets, the narrative sections in Notion or Docs, and link both from your CRM. Whether you're launching a new product or expanding into a new segment, this structure scales.
One-Page GTM Plan Summary
Before you build the detailed plan, create a one-page cover sheet that forces decisions. This is the document your exec team actually reads - and the one that exposes gaps you'd rather not find mid-launch.
| Field | Example |
|---|---|
| ICP / Segment | Series B SaaS, 50-200 employees |
| Core Pain / JTBD | Pipeline data is stale, reps waste 4 hrs/week |
| Value Prop | One sentence |
| Positioning | vs. status quo and top competitor |
| Differentiators | 2-3 bullets |
| Pricing & Packaging | Tiers, entry price |
| Route-to-Market | PLG / sales-led / partner |
| Primary Channels | Outbound, content, partnerships |
| Activation Moment | "Aha" action in week 1 |
| 30/60/90-Day KPIs | Specific numbers |
| Owners | PMM / Sales / RevOps |
| Milestones | Dates, not vibes |
If you can't fill every field, you aren't ready to launch. Copy this table into a Google Doc and circulate it before building the full plan.
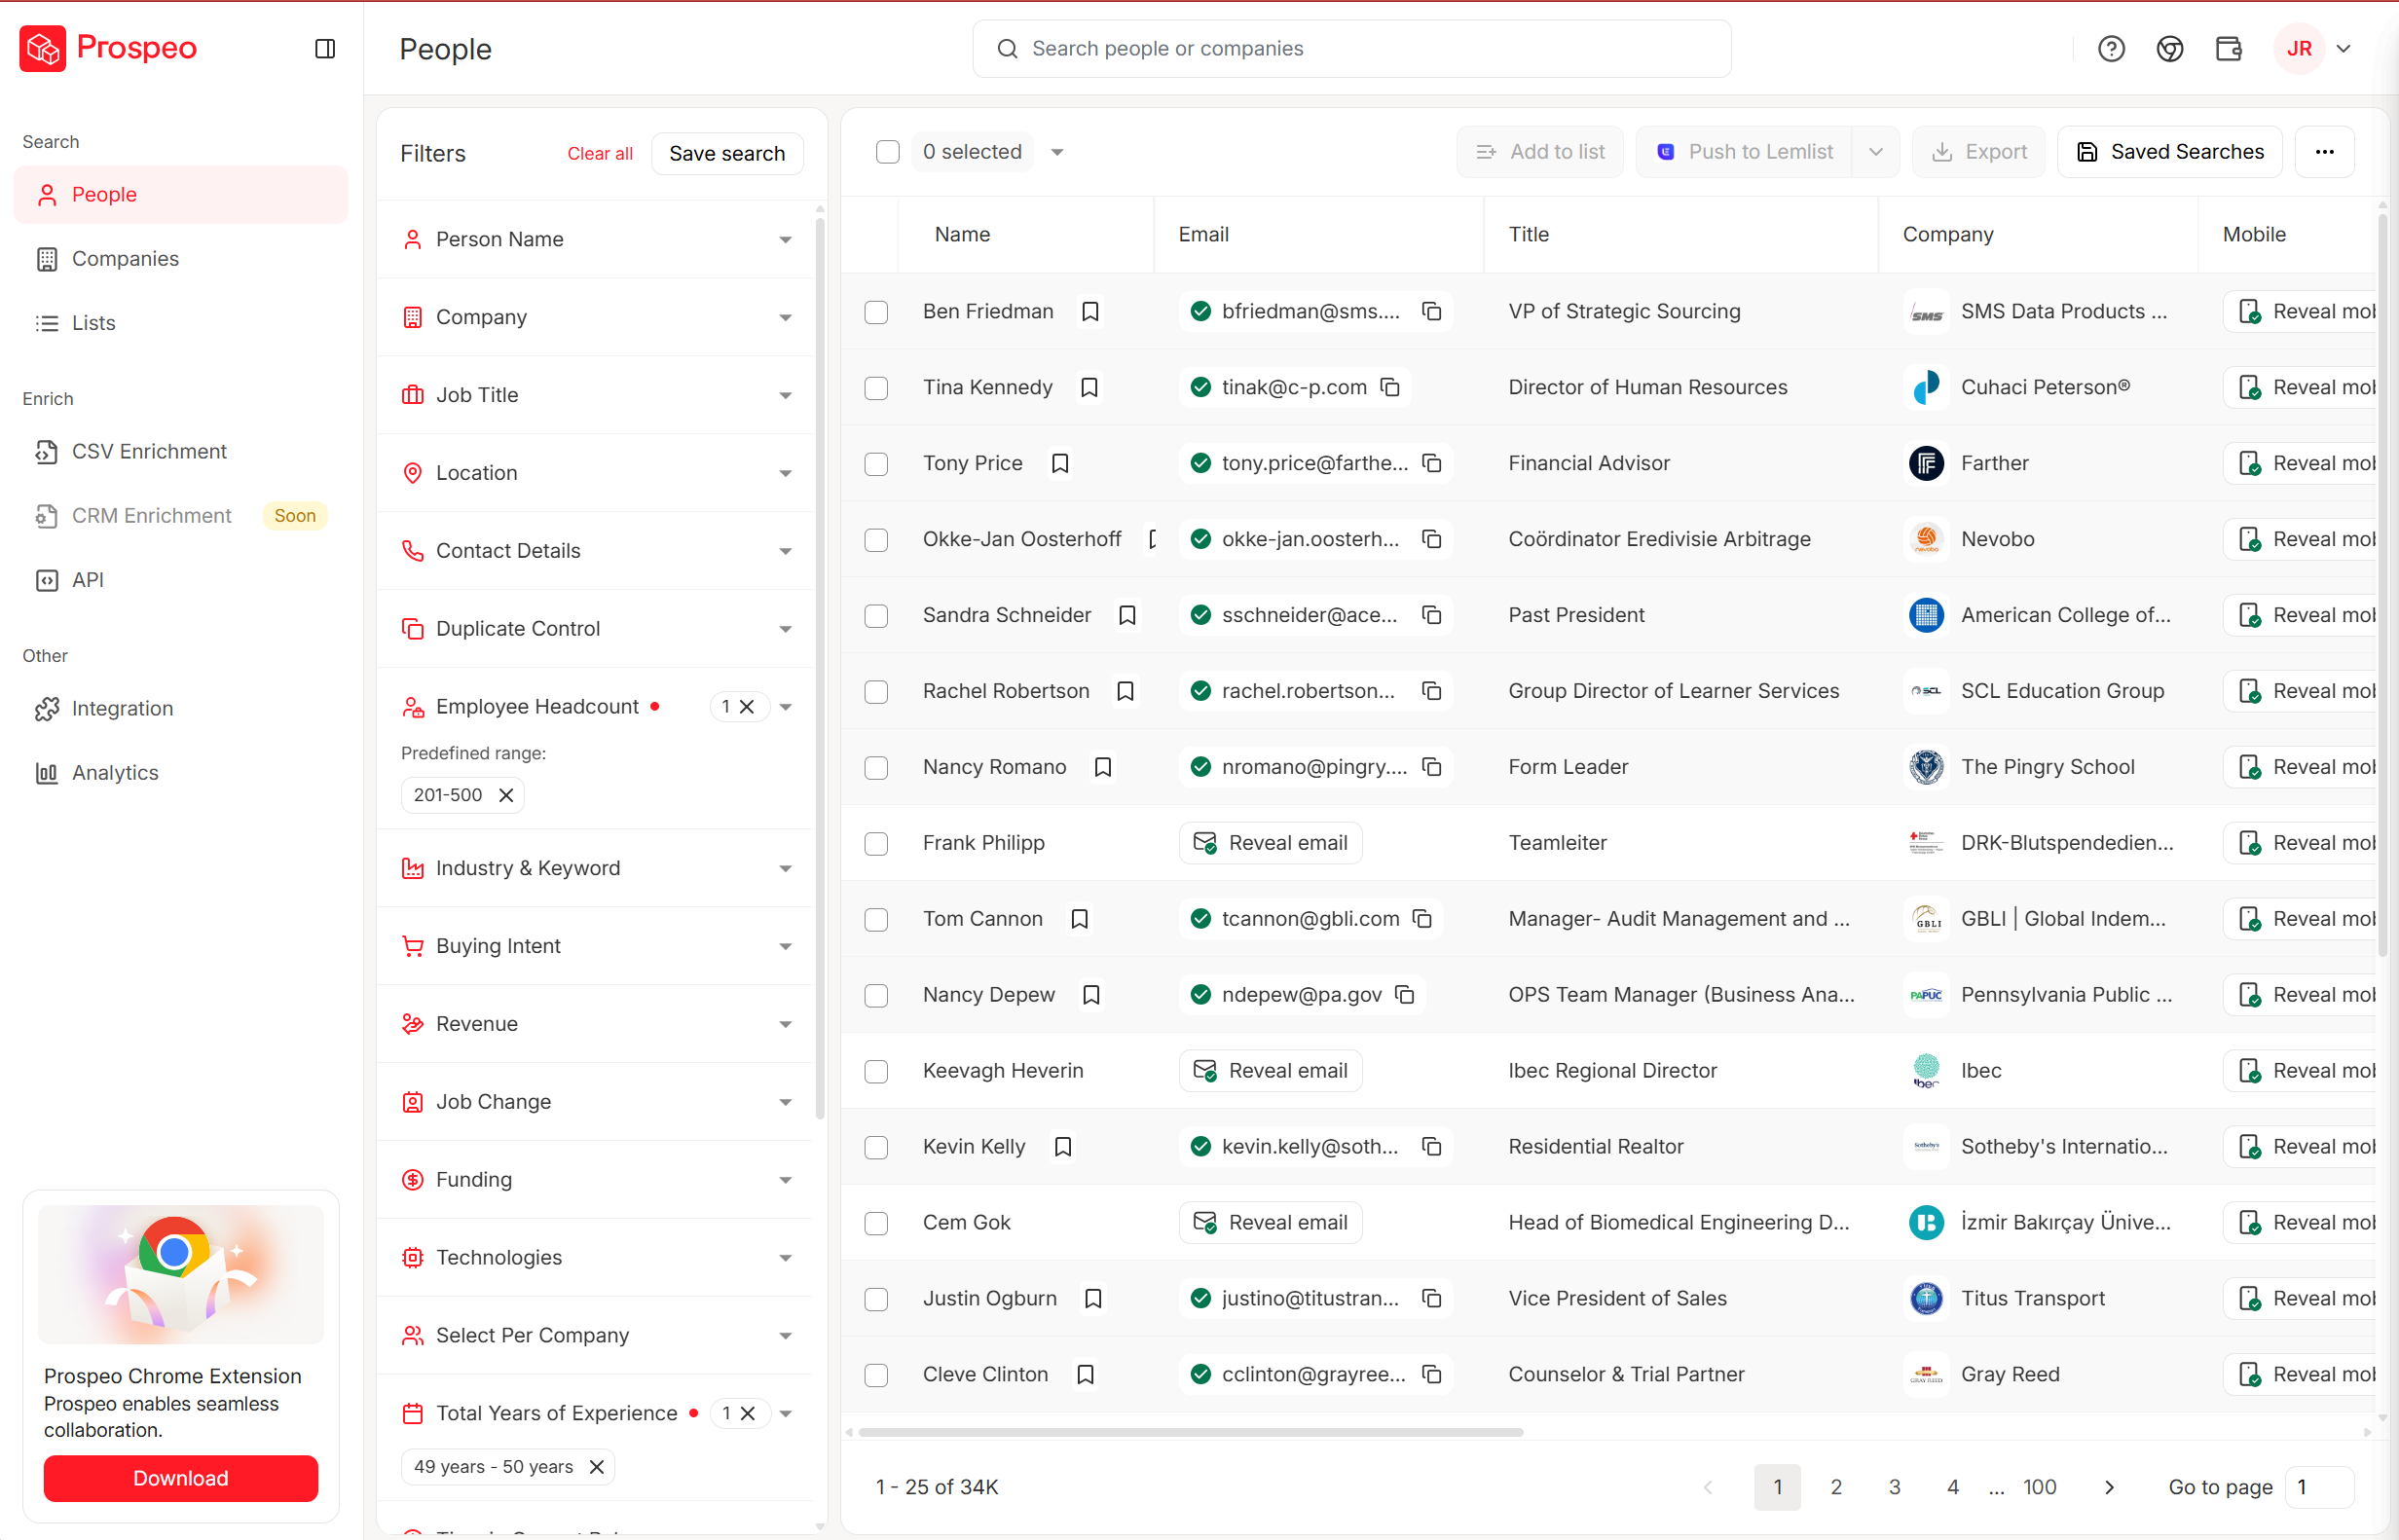
Your pipeline coverage ratio is a lie if half your contacts bounce. Prospeo gives you 98% email accuracy on a 7-day refresh cycle - so the 492 opportunities in your quota math are actually reachable. 300M+ profiles, 30+ filters, $0.01 per email.
Stop building GTM plans on stale data. Build them on verified contacts.
The Six Sections in Detail
Revenue Goals
Start with the number everyone's accountable to: annual revenue target, margin expectations, priority segments, and the key assumptions underneath. If you're targeting $3.2M in new ARR, say so - then list what has to be true. Average deal size holds at $26K, win rate stays above 25%, you hire two AEs by March.
Now stress-test those assumptions. What happens if win rate drops 5 points or the sales cycle stretches 20 days? Run the math both ways. This section isn't a vision statement. It's a contract between sales leadership and the business, and contracts need numbers that survive contact with reality.
Target Market
Size your market two ways: top-down from industry reports and bottom-up by counting target accounts multiplied by your ACV. If those two numbers diverge by more than 3x, your assumptions are broken.
Quick example: you're selling dev analytics. Top-down, your subcategory is $420M. Bottom-up, 14,000 target companies x 65% addressable x $48K ACV = ~$437M. Close enough. If your bottom-up came back at $1.4B, revisit who's actually in your ICP. Solid GTM planning starts here - if your market sizing is off, every downstream number is fiction.
GTM Motion
Your template changes shape depending on how you sell. McKinsey's framework draws a clear line between product-led growth, sales-led growth, and product-led sales - a hybrid where product usage drives demand and sales converts larger opportunities. Most B2B teams selling mid-market and up run sales-led or hybrid motions. This template leans that direction.
Pipeline Model & Quota Math
Here's the thing: this is where most GTM plans fall apart. Teams spend weeks on positioning and skip the math that determines whether the plan is even feasible.
Pipeline coverage benchmarks say to target 3-5x for new logo deals and 2-3x for expansion. Segment by SMB, mid-market, enterprise - and by pricing model, because usage-based deals inflate pipeline value if you count initial contract rather than expected ramp.
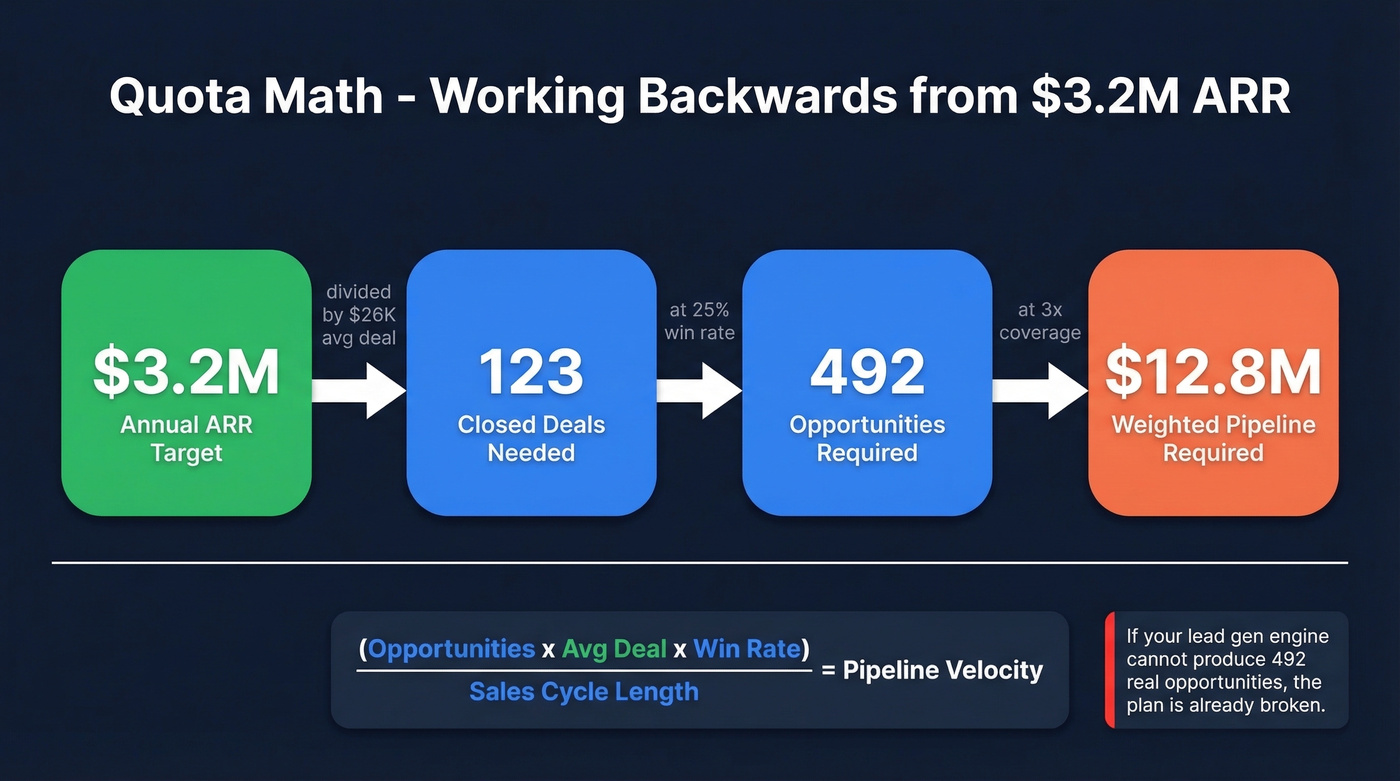
Here's the worked example:
$3.2M ARR target / $26K avg deal = 123 closed deals needed -> at 25% win rate = 492 opportunities -> at 3x coverage = ~$12.8M weighted pipeline required
That opportunity number tells you whether your lead gen engine can support the plan. If it can't, either the target is wrong or you need more pipeline sources. This math is the backbone of any credible go-to-market sales plan - without it, you're guessing.
Pipeline velocity ties it together: (Opportunities x Avg Deal Value x Win Rate) / Sales Cycle Length. Track monthly. When velocity drops, you'll see it here before it shows up in bookings.
And enforce pipeline hygiene rules alongside coverage targets. Purge opportunities with no activity in 30-60 days, no identified economic buyer, or engagement scores below threshold. Stale opps are the fastest way to lie to yourself about coverage.
If you want a deeper set of targets by segment, use a dedicated set of sales pipeline benchmarks alongside your quota math.
Territories & Enablement
Capacity planning is straightforward but frequently ignored. SMB AEs ramp in 3-6 months. Enterprise reps take 6-9+. If you're hiring in Q1 and expecting full productivity by Q2, your plan is fiction.
Let's be honest about enablement: it's the most underinvested section of every GTM plan we've reviewed. At minimum, reps need battlecards for top 3 competitors, objection-handling docs, demo scripts by persona, and 3+ case studies by segment. We've seen teams invest six figures in data tools and CRM infrastructure, then hand reps a product one-pager and wish them luck. That's how you burn pipeline.
Your pipeline coverage ratio is only as honest as your contact data. Bad emails and disconnected numbers inflate coverage math because "pipeline" that isn't reachable isn't pipeline at all. Run your list through Prospeo's verification before you set quota targets - 98% email accuracy on a 7-day refresh cycle means your math reflects reality, not a database that was accurate six months ago.
KPIs & Review Cadence
Weekly pipeline reviews, monthly forecast meetings, quarterly business reviews. Skip the weekly review and you'll miss early warning signs because stale opportunities inflate coverage numbers for weeks before anyone notices.
Starter benchmarks for your template:
| Metric | Target |
|---|---|
| Lead response time | Under 5 minutes (inbound) |
| Avg sales cycle | 45 days mid-market; 84-day SaaS median |
| Demo-to-close rate | 30% |
| MRR growth | 8% month-over-month |
| CAC | Under $500 for SMB deals |
Adjust quarterly based on actuals. The template is a starting point, not a permanent fixture.
If you need a system for the weekly meeting itself, borrow a pipeline health scorecard and review it the same way every time.
Benchmark Reference Table
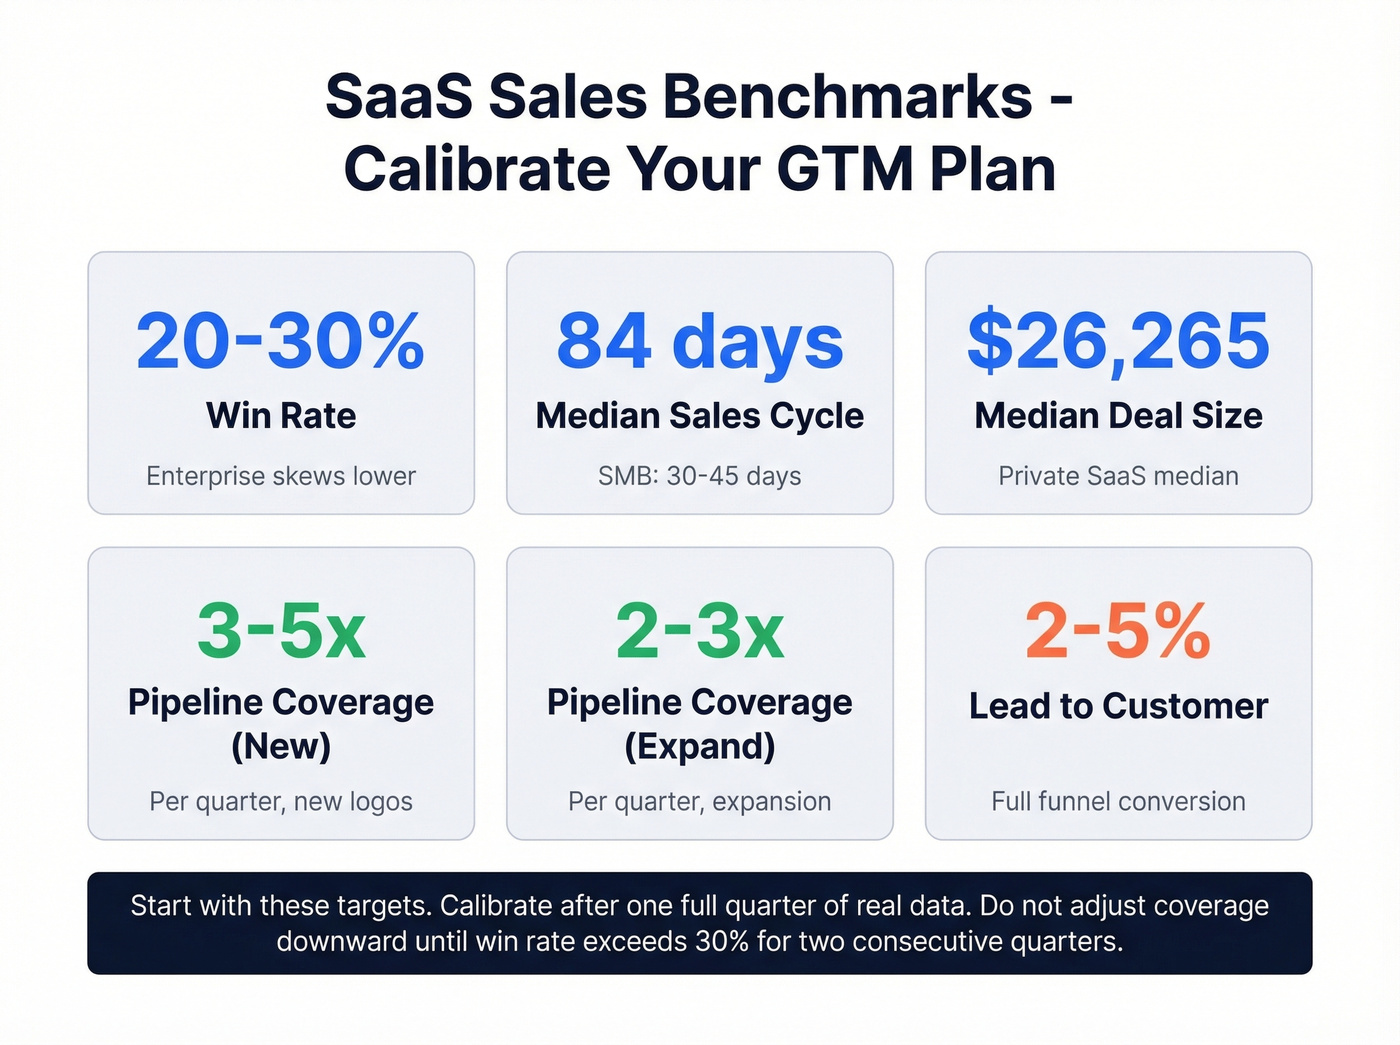
Copy these into your Google Sheet as starting targets, then calibrate after one full quarter of real data.
| Metric | Benchmark | Segment Notes |
|---|---|---|
| Win Rate | 20-30% | Enterprise skews lower |
| Median Sales Cycle | 84 days | SMB: 30-45 days |
| Median Deal Size | $26,265 | Private SaaS median |
| Pipeline Coverage (New) | 3-5x | Per quarter |
| Pipeline Coverage (Expand) | 2-3x | Per quarter |
| Lead-to-Customer | 2-5% | Full funnel |
GTM Plan Mistakes That Kill Launches
Most GTM plans fail not because the strategy is wrong, but because nobody did the math. If you're closing deals under $15K, you probably don't need a 40-page GTM doc - you need a pipeline model, a one-pager, and disciplined weekly reviews. Everything else is theater.
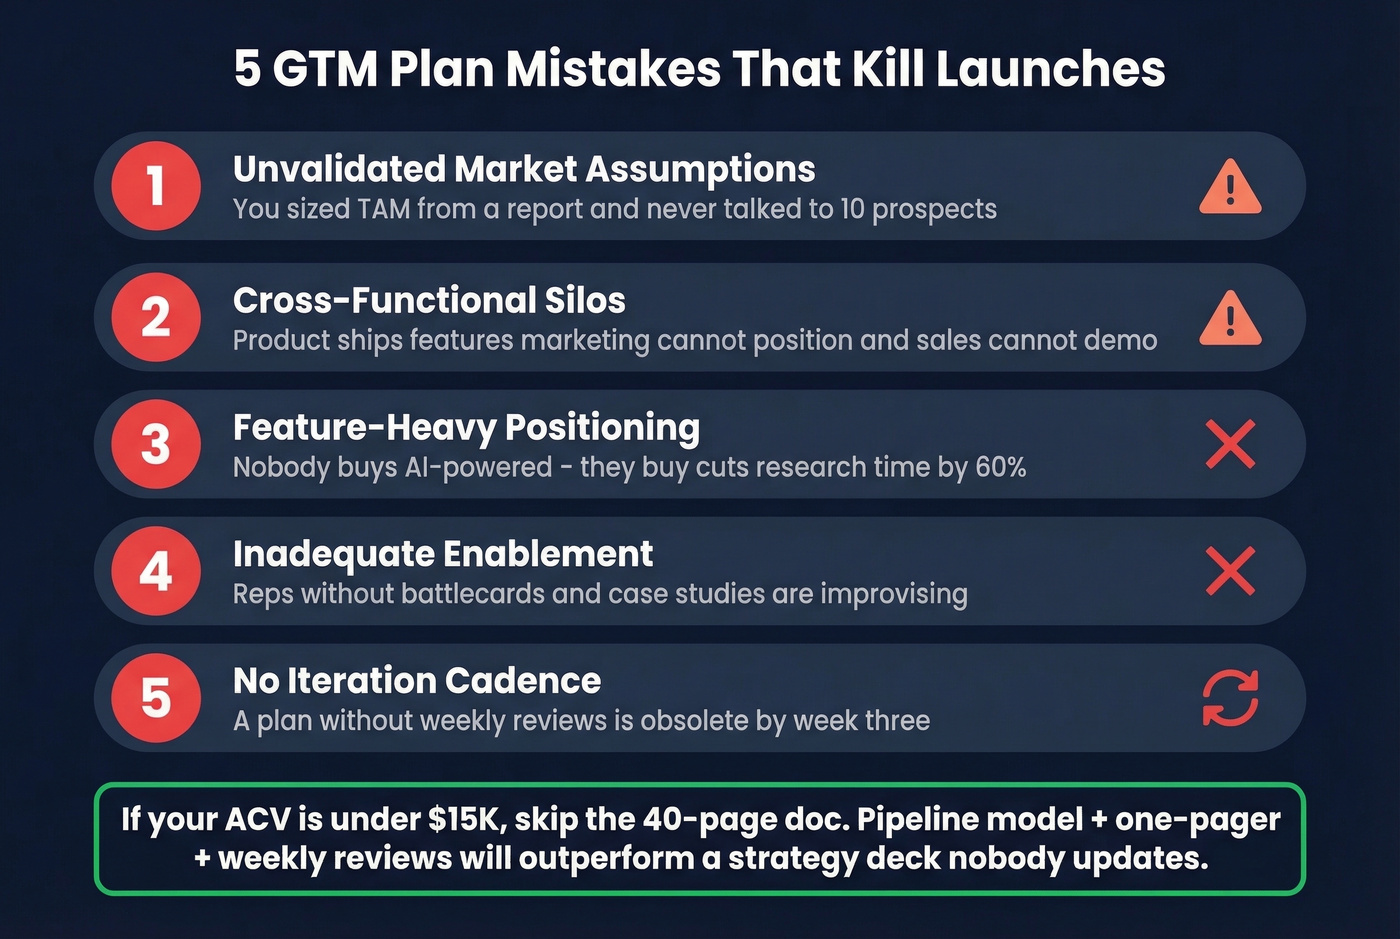
The five killers:
- Unvalidated market assumptions. You sized your TAM from a Gartner report and never talked to 10 prospects. Your ICP is a guess dressed up as strategy.
- Cross-functional silos. Product ships features marketing can't position and sales can't demo. Alignment meetings aren't optional - they're the only thing preventing a launch that implodes on day one.
- Feature-heavy positioning. Nobody buys "AI-powered." They buy "cuts research time by 60%." Lead with outcomes.
- Inadequate enablement. Reps without battlecards and case studies are improvising. Improvisation doesn't scale.
- No iteration cadence. A GTM plan without weekly reviews is obsolete by week three. The r/sales consensus backs this up - the threads about failed launches almost always trace back to "we built the plan and never looked at it again."
Skip the 40-page doc if your ACV is under $15K. Seriously. A pipeline model, the one-page summary above, and a weekly review rhythm will outperform a beautifully designed strategy deck that nobody updates.
If your launch depends on outbound, pair this plan with proven sales prospecting techniques and a consistent sales follow-up system.
Territory planning and capacity models fall apart when reps waste hours chasing bad numbers. Prospeo's 125M+ verified mobiles hit a 30% pickup rate - 3x the industry average. Pair that with intent data across 15,000 topics to hand reps accounts that are actually in-market.
Give your AEs pipeline they can actually close - starting at $0.01 per lead.
FAQ
What's the difference between a GTM strategy and a sales plan?
A GTM strategy defines positioning, ICP, and channels. A go-to-market sales plan adds pipeline targets, quotas, territories, and enablement - the execution layer where accountability lives. You need both. The strategy without the plan is a deck that never ships.
How much pipeline coverage do I need?
3-5x for new logo deals, 2-3x for expansion. Only adjust downward if your win rate consistently exceeds 30% over multiple quarters. Most teams overestimate their win rate, so err toward 4x until you've got two quarters of data proving otherwise.
How do I keep pipeline data accurate?
Verify contact data before committing to pipeline targets. Stale emails and disconnected numbers inflate coverage math - you think you've got 4x coverage, but a third of those contacts bounce. Tools like Prospeo refresh records every 7 days with 98% email accuracy, so your coverage numbers reflect who you can actually reach today rather than who was reachable last quarter.
Can I use this template for a new product launch?
Yes. The six-section structure works for net-new products and new market segments alike. The key difference: new launches require more conservative pipeline assumptions - lower win rates, longer sales cycles, and 4-5x coverage ratios - until you've got at least one quarter of real data to calibrate against. Don't let optimism bias your first pipeline model; you can always loosen the ratios once you have proof.