How to Calculate Net Revenue Retention - The Practitioner's Guide
The VP of Customer Success walks into the board meeting, slides up: "NRR is 115%." Nods around the table. Then the CFO asks, "What's our GRR?" Silence.
Every guide online gives you the net revenue retention formula. Almost none tell you what to do when your CFO challenges the denominator, asks how you're treating multi-year contracts, or wants to know why 115% NRR is hiding a churn problem. This one does.
What Is Net Revenue Retention?
Net revenue retention measures how much recurring revenue you keep - and grow - from your existing customer base over a defined period, typically 12 months. It captures expansion from upsells and cross-sells, contraction from downgrades, and revenue lost to churn. An NRR above 100% means your installed base is growing on its own, without a single new logo.
You'll see NRR and NDR (net dollar retention) used interchangeably. There's a subtle distinction some investors draw: NDR tracks the revenue change during a customer's first 12 months, while NRR measures a rolling 12-month window across all customers. In practice, treat them as synonyms unless your investor deck specifies otherwise.
The NRR Formula
Here's the standard component formula:
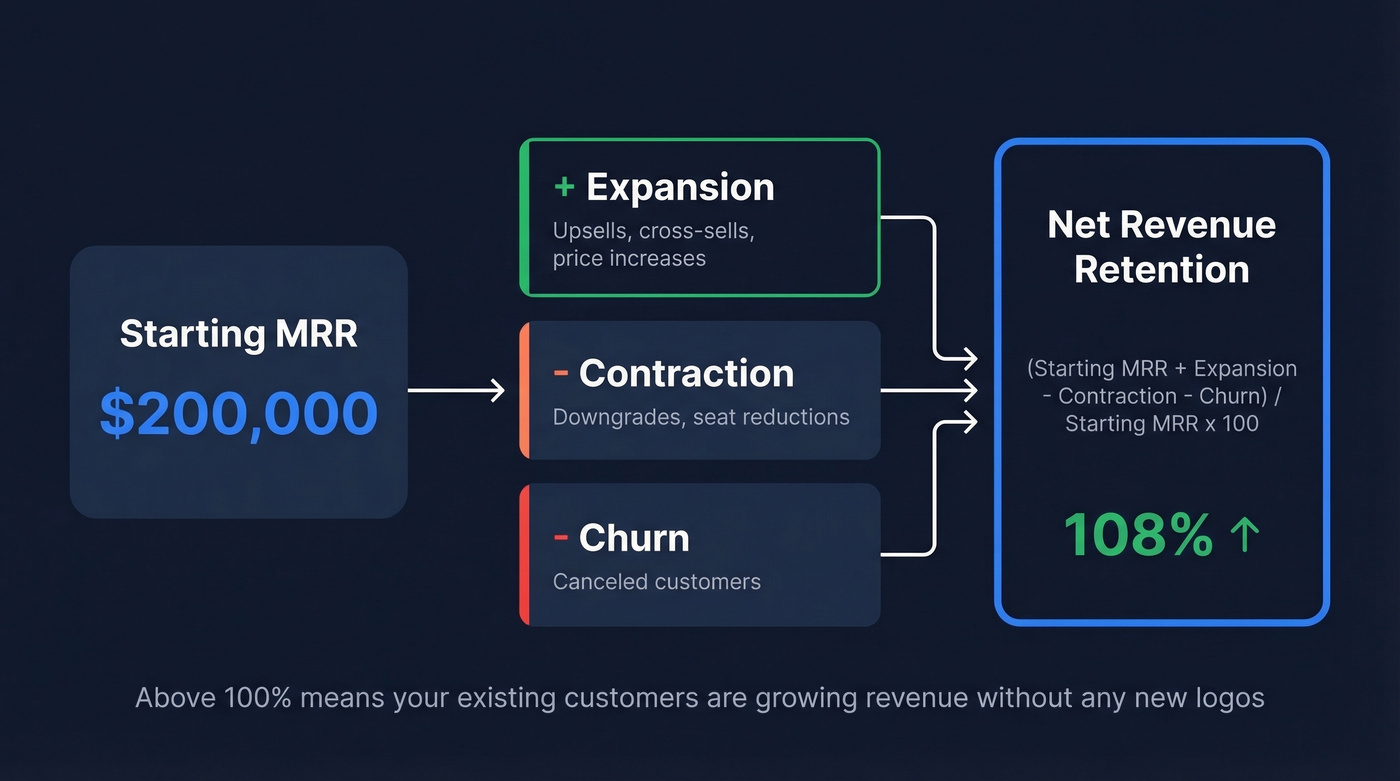
NRR = (Starting MRR + Expansion - Contraction - Churn) / Starting MRR x 100
The four components:
- Starting MRR - monthly recurring revenue at the beginning of the period from customers active at that point
- Expansion - upsells, cross-sells, price increases, and increased usage revenue (see Upsell vs Cross-Sell in SaaS)
- Contraction - downgrades, seat reductions, and any decrease in recurring spend
- Churn - MRR from customers who canceled entirely (for definitions and formulas, see What Is Churn?)
Two Ways to Calculate NRR
Component Formula Method
The formula above is the "quick check" approach most guides show, and it works fine for a snapshot. The catch: it's prone to timing artifacts. If a big expansion lands in January but the corresponding churn hits in March, your monthly rate swings wildly even though the underlying business hasn't changed.
Cohort Method (Preferred)
The SaaS Metrics Standard Board calls the cohort method the most accurate approach. The formula is simpler than it sounds:
NRR = End-period MRR from customers active at start / Starting MRR from that same cohort x 100
You take a fixed group of customers, measure their MRR at the start, then measure what that same group generates at the end. No timing artifacts, no double-counting. We've found the component formula is fine for a quick gut check, but the cohort method is what you should actually report.
Build It Yourself
Want to run this in a spreadsheet? Create two columns: Starting MRR by account (start of period) and Ending MRR by account (end of period). Sum each column. Divide ending by starting, multiply by 100. That's your cohort NRR. It takes about ten minutes to set up and saves you from ever second-guessing the number.
Annualizing Shorter Periods
Quarterly NRR raised to the power of 4 gives you the annual figure. Monthly NRR raised to the power of 12 does the same. A quarterly rate of 102.5% annualizes to roughly 110.4%.
Worked Examples
Healthy SaaS Subscription
A clean scenario:
- Starting MRR: $200,000
- Expansion from upsells and cross-sells: $25,000
- Contraction from downgrades: $5,000
- Churn from cancellations: $4,000
NRR = ($200,000 + $25,000 - $5,000 - $4,000) / $200,000 x 100 = 108%
Your existing customers are generating 8% more revenue than they were 12 months ago, before you add a single new deal.
Usage-Based Model
Now consider a usage-based company where customers have committed spend, but actual consumption runs higher:
- Starting MRR at committed rates: $200,000 across the cohort
- Committed expansion: $10,000
- Overages above commitment: $15,000
- Contraction: $3,000
- Churn: $6,000
With overages included: NRR = 108%. Without overages: 100.5%. Big difference. SMSB guidance is clear - if you include overages, disclose it and apply the methodology consistently. Don't cherry-pick periods.
High NRR Masking Poor GRR
This scenario should keep CS leaders up at night.
A company reports 120% NRR. Sounds incredible. But their GRR is 75%. That means they're losing 25% of their base revenue every year and papering over it with expansion. CRV flags this exact pattern - especially in companies where a few large accounts drive most of the expansion. One bad quarter of upsells and the whole growth story collapses. We've seen this play out firsthand at two portfolio companies our team advises, and it's never pretty when the music stops.
Improving NRR means expanding revenue from existing accounts - but it also means landing the right customers in the first place. Prospeo gives your team 300M+ verified profiles with 30+ filters including buyer intent, technographics, and headcount growth so you acquire accounts built to expand, not churn.
Stop papering over churn. Start closing customers who grow.
NRR Benchmarks in 2026
Most NRR benchmarks you see online are useless because they don't segment by ACV or company stage. A $5K ACV SMB product and a $200K ACV enterprise platform have fundamentally different retention dynamics. Let's break this down by what actually matters.
By ACV (SaaS Capital survey data, private B2B SaaS):
The $25K-$50K ACV band is the most commonly cited benchmark range. Median NRR sits at 102%, top quartile hits 111%, and bottom quartile falls to 97%. ACV is more predictive of retention than industry, company age, or revenue band - which surprises a lot of people.
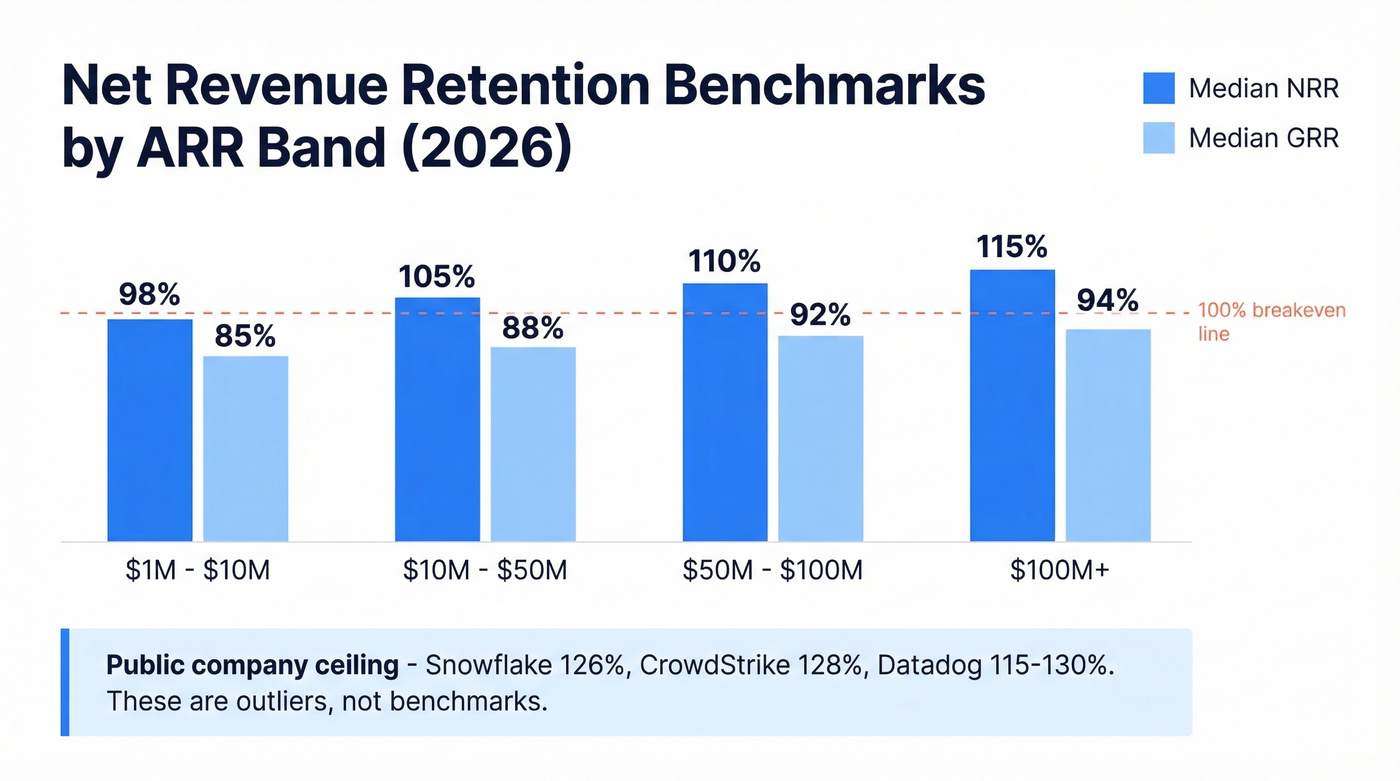
By ARR Band (Userlens data):
| ARR Band | Median NRR | Median GRR |
|---|---|---|
| $1M-$10M | 98% | 85% |
| $10M-$50M | 105% | 88% |
| $50M-$100M | 110% | 92% |
| $100M+ | 115% | 94% |
For public-company context, top-tier usage-based infrastructure and security companies sit well above 115% net retention. Snowflake runs around 126%, Datadog has posted 115-130%, and CrowdStrike sits around 128%. They're the ceiling, not typical benchmarks.
Why does this matter beyond the board deck? Research across 1,000+ private B2B SaaS companies shows that moving from the 90-100% NRR range to 100-110% adds 5 percentage points of growth. Companies with the highest NRR report median growth 83% higher than the population median.
NRR vs GRR - Why You Need Both
| Metric | Includes Expansion? | Can Exceed 100%? | What It Tells You |
|---|---|---|---|
| NRR | Yes | Yes | Full revenue health |
| GRR | No | No (capped at 100%) | Core product stickiness |
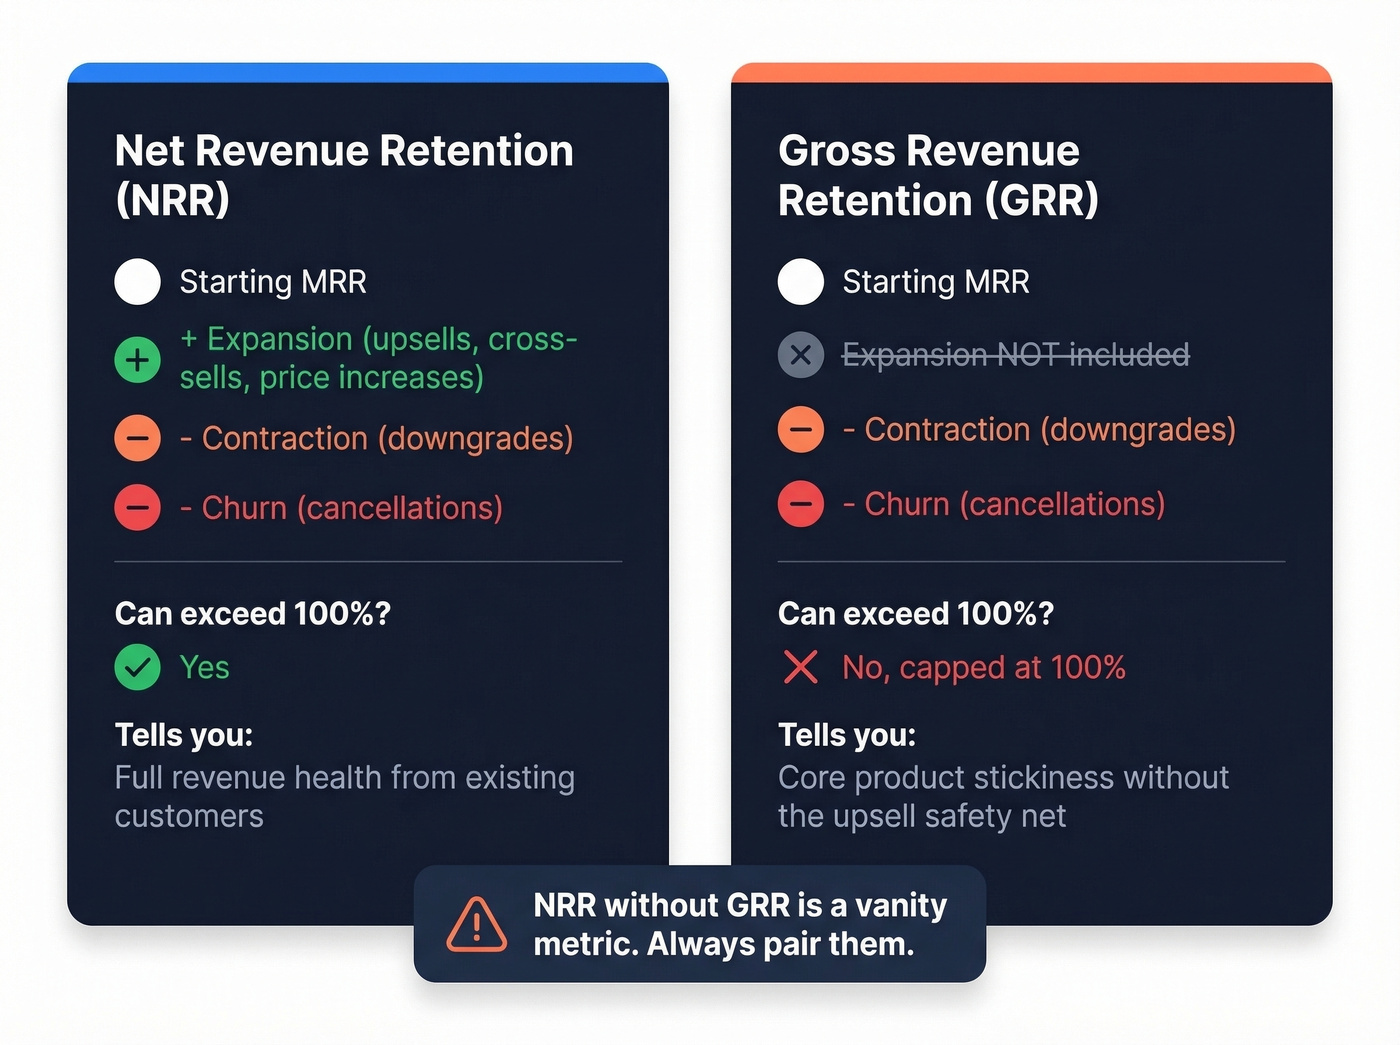
GRR strips out expansion entirely. It only measures contraction and churn against starting MRR. That makes it the purest signal of whether customers actually need your product - or whether your growth is just your sales team upselling harder than customers are leaving.
NRR without GRR is a vanity metric. Always pair them.
CRV's analysis highlights why: for companies in the $50M-$100M ARR range, expansion revenue contributed 58% of total new ARR in 2024, while new customer acquisition costs rose 14% through that same year. When expansion is doing that much heavy lifting, you need GRR to tell you whether the foundation is solid. When presenting to the board, show NRR and GRR side by side - always. If you run multiple products, show a blended rate as the headline metric and break out product-line NRR in the appendix.
Edge Cases That Trip Up Finance Teams
Multi-Year Contracts
Include all customers in the denominator regardless of renewal timing. Teams sometimes exclude multi-year contracts because "they're not up for renewal this year," and it artificially inflates both GRR and NRR. If you need to understand renewal-year behavior specifically, run a separate "renewal cohort" analysis alongside your standard calculation (related: Renewal Rate).
Reactivations and Win-Backs
Count reactivations as recovered revenue, not as new customer revenue. They don't belong in GRR at all. Most companies define a 30-90 day win-back window - if a churned customer comes back within that period, it's a renewal, not a new sale. Get this wrong and you're crediting acquisition spend for what was really a retention recovery, which skews CAC payback in ways that are hard to unwind later (see Cost to Acquire Customer).
Multi-Product Accounts
Here's the thing: this one trips up FP&A teams constantly. An account drops $20K in Product A but adds $10K in Product B. At the account level, that's $10K of net contraction - and it counts as contraction for both NRR and GRR. For product-level diagnostics, run separate product-line reports. The primary metric should always be account-level.
Price Increases and Usage Overages
Price increases count as expansion in NRR - standard practice. Usage overages above commitment are more contentious. Disclose your methodology and apply it consistently across periods. One thing that isn't debatable: revenue recognition accelerated due to a canceled contract should never be included in MRR.
How to Improve Net Revenue Retention
Three levers, in order of how most teams prioritize them - and one contrarian take on what actually moves the needle most.
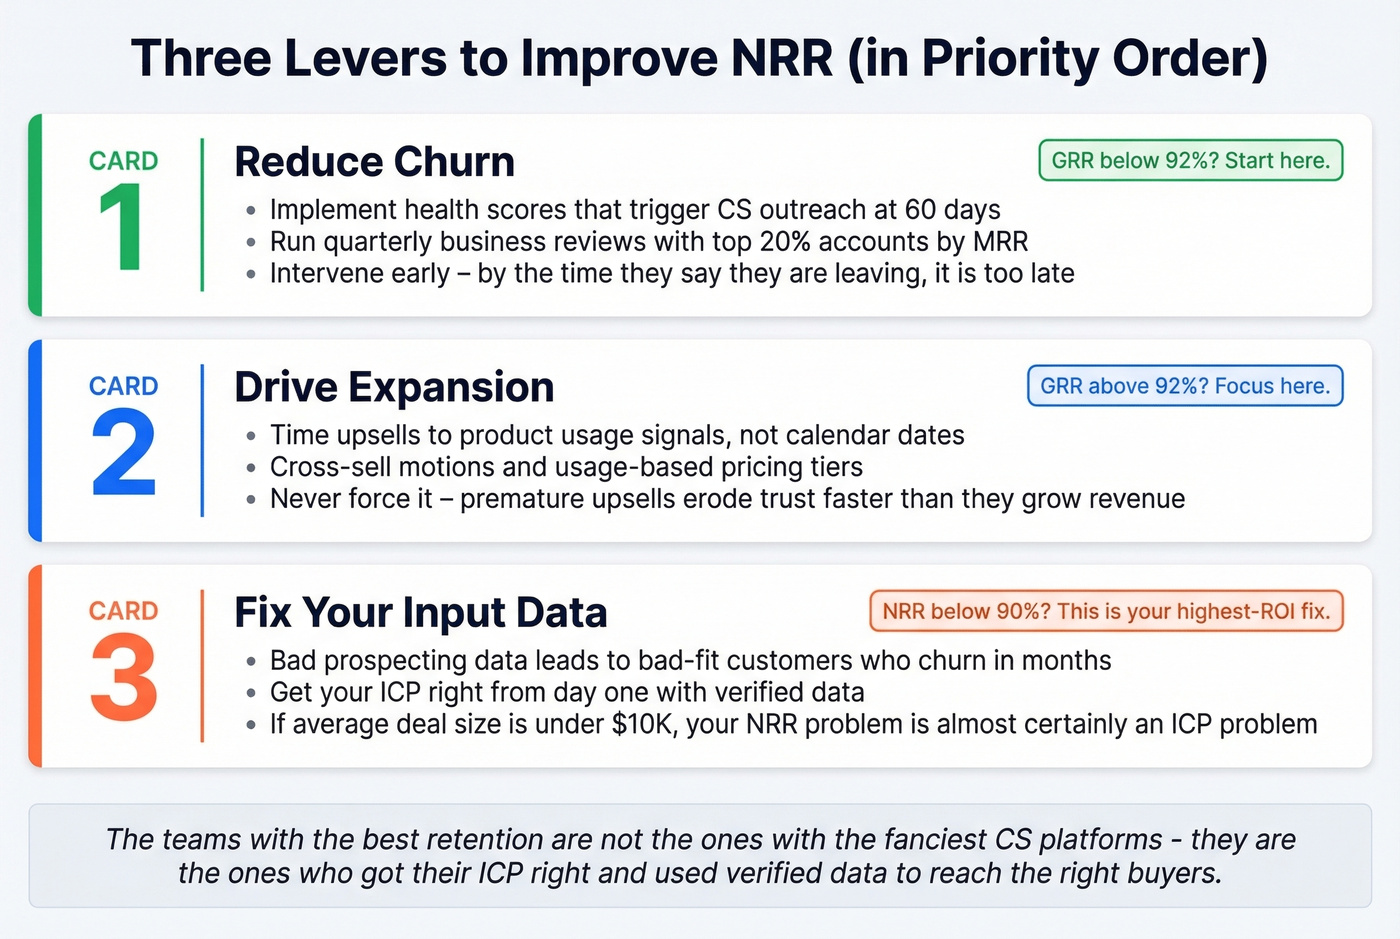
Reduce churn. Proactive customer success, health scoring, and onboarding investment are table stakes. One concrete move: implement a health score that triggers CS outreach at the 60-day mark, and run quarterly business reviews with your top 20% of accounts by MRR (see QBR Meaning). The consensus on r/SaaS is that most companies wait too long to intervene - by the time a customer says they're leaving, the decision was made weeks ago.
Drive expansion. Upsell timing matters more than upsell volume. Cross-sell motions, usage-based pricing tiers, and expansion plays triggered by product usage signals all compound retention over time. But don't force it. Premature upsell attempts erode trust faster than they grow revenue (see Cross Selling vs Upselling).
Fix your input data. If your NRR is below 90%, that's a serious warning sign. Bad prospecting data leads to bad-fit customers who churn within months. In our experience, the teams with the best retention aren't the ones with the fanciest CS platforms - they're the ones who got their ICP right from day one and used verified data to reach the right buyers.
Skip this lever if your GRR is already above 92%. Your problem is expansion, not fit. But for everyone else, data quality is the highest-ROI fix you're not making (see data enrichment).
The contrarian take: If your average deal size is under $10K, your NRR problem is almost certainly an ICP problem. You're selling to customers who were never going to expand. Fix the top of the funnel before you hire another CSM.
When expansion revenue does 58% of the heavy lifting, your team needs direct access to decision-makers inside existing accounts. Prospeo delivers 98% accurate emails and 125M+ verified mobile numbers - refreshed every 7 days - so your CS and AM teams always reach the right buyer for the upsell.
Reach expansion contacts before your competitor does.
NRR FAQ
What's a good NRR for a SaaS company?
Above 100% means your existing customers are growing. The 2026 median for private B2B SaaS is 102% at $25K-$50K ACV, with top quartile hitting 111%. Anything below 90% signals a serious retention or product-market fit issue.
Is NRR the same as NDR?
For practical purposes, yes. Some investors distinguish them - NDR tracks first-12-month revenue change per customer, while NRR measures rolling 12-month retention across all customers. Unless your investor deck specifies otherwise, treat them as synonyms.
How often should I measure NRR?
Calculate monthly on a rolling basis for operational tracking so you catch trends early. Report annually for benchmarking and board presentations. Annualize quarterly figures by raising to the power of 4.
Can NRR exceed 100%?
Yes - that's the goal. NRR above 100% means expansion revenue from existing customers exceeds what you lost to churn and contraction. Your customer base is growing without new logos. Top-quartile SaaS companies consistently run 110%+.
How does prospecting data quality affect NRR?
Bad prospecting data leads to bad-fit customers who churn within months, dragging down retention. Verified contact data - accurate emails, direct dials, and fresh firmographic signals - reduces bad-fit acquisition by ensuring outbound teams target the right people at companies that actually match your ICP.