How to Implement Sales Pipeline Analytics in 2026 (The RevOps Playbook)
Your VP asks for a board-ready forecast. You spend three hours in Excel, cross-referencing Salesforce exports with a spreadsheet someone on the team swears is "the latest version." The number you land on feels wrong - because it is. One sales leader managing 150 reps estimated their pipeline was inflated by roughly 60%, packed with wrong values, outdated close dates, and opportunities that should've been killed months ago. That's not a pipeline. That's organized fiction.
Knowing how to implement sales pipeline analytics fixes this - but only if you do it correctly. Here's the RevOps playbook for going from messy CRM data to a system that tells you what's real.
The Short Version
Clean your CRM data first - analytics built on stale records is just prettier fiction. Configure stage history tracking with objective exit criteria. Start with three metrics: pipeline velocity, stage conversion rate, and coverage ratio. Master those before adding complexity.
Pipeline Analytics vs. Pipeline Management
Pipeline management is moving deals forward. Pipeline analytics is measuring how deals move, where they stall, and why your forecast keeps missing.
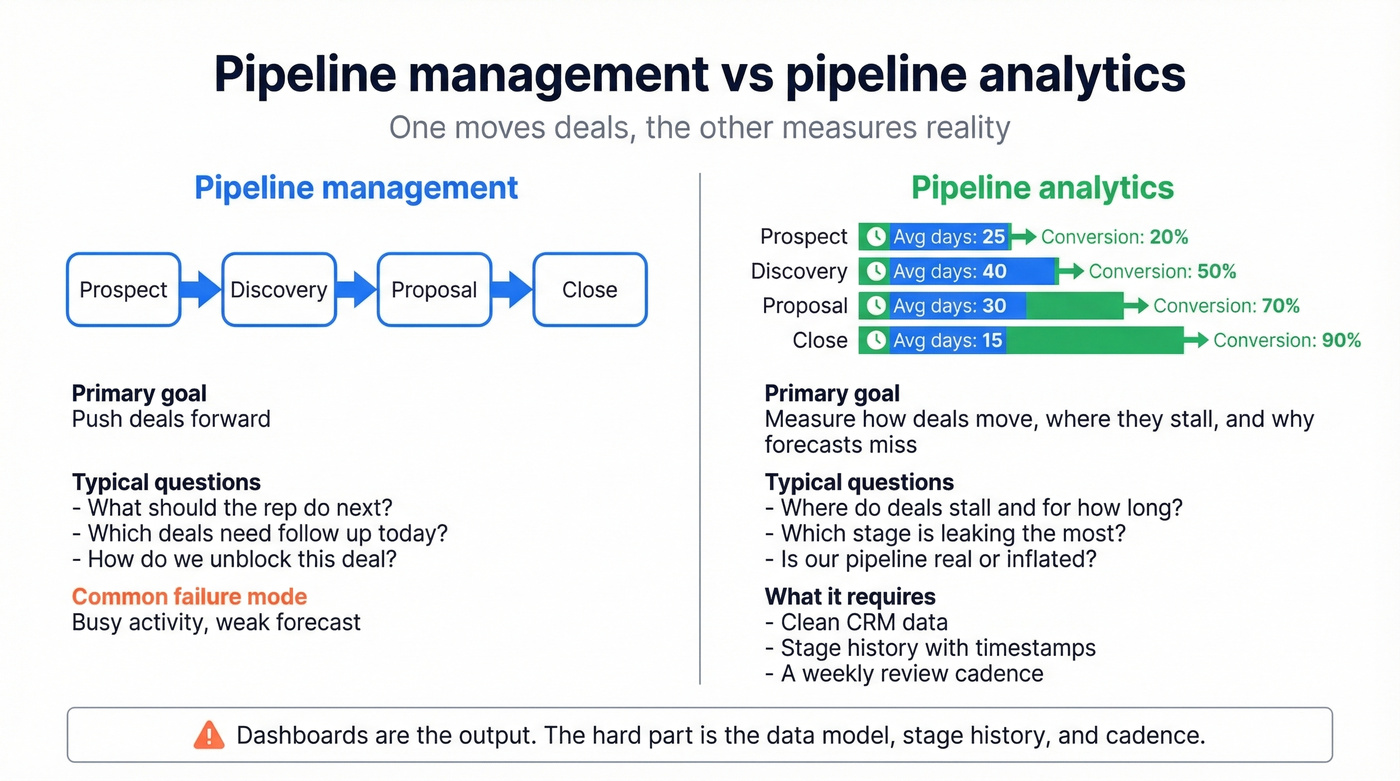
Most guides conflate the two, handing you a list of metrics without explaining how to actually capture the data that feeds them. The implementation - the data model, the stage history, the review cadence - is the hard part. Dashboards are just the output.
Before You Start - Fix These First
Here's the thing: the biggest threat to your analytics isn't the wrong BI tool. It's the data underneath.
Single source of truth. If some reps use the CRM, others track deals in spreadsheets, and your SDR team keeps notes in a separate app, you don't have a pipeline - you have a tool zoo. Centralize everything into one CRM before you touch a dashboard.
Data completeness. 91% of CRM data is incomplete, and roughly 70% of B2B contact data becomes obsolete annually. If your opportunity records have missing amounts, wrong close dates, or contacts who left the company six months ago, your analytics will reflect garbage.
Contact data quality. Stale contact data inflates pipeline before analytics even begins. Deals attached to people who've changed roles or companies create phantom pipeline that looks real in a dashboard but bounces the moment you try to close. An enrichment tool that refreshes contact data automatically solves this upstream - Prospeo's 98% email accuracy and 7-day refresh cycle keep records current through native Salesforce and HubSpot integrations, without reps lifting a finger. If you're evaluating vendors, start with a shortlist of data enrichment services.

The Implementation Framework
Step 1: Audit Your Current Pipeline Data
Before you build anything, run a pipeline audit. Pull every open opportunity and flag the ones that are lying to you:
- Opportunities with no activity in 30+ days
- Close dates that have already passed and weren't updated
- Missing dollar amounts or placeholder values
- Contacts who've left the company
Remember that 60% inflation number? We've seen teams cut their "pipeline" in half after a single honest scrub - and their forecast accuracy immediately improved because the remaining deals were real. If you want a deeper diagnostic, use a pipeline health checklist to standardize what “clean” means.
Step 2: Define Stages with Exit Criteria
Use this if your stages are based on customer-verified actions: "Customer confirmed budget and timeline in writing," "Champion introduced us to the economic buyer," "Legal received the contract." (If your team struggles to identify the real decision-maker, align on the economic buyer early.)
Skip this if your stages are based on seller actions: "Sent proposal," "Had discovery call," "Followed up." Seller actions tell you what your rep did, not where the deal actually stands. SBI Growth's research is clear - objective exit criteria based on customer behavior are the foundation of accurate forecasting. Without them, every other metric you build is unreliable.
Step 3: Configure Your Data Model
This is where most implementations stall. You need two data structures working together: your Opportunity table, which holds the current state of every deal, and an OpportunityFieldHistory table that captures every stage change with a timestamp. If you're still deciding on a CRM setup, it helps to review a few examples of a CRM and how they handle history tracking.
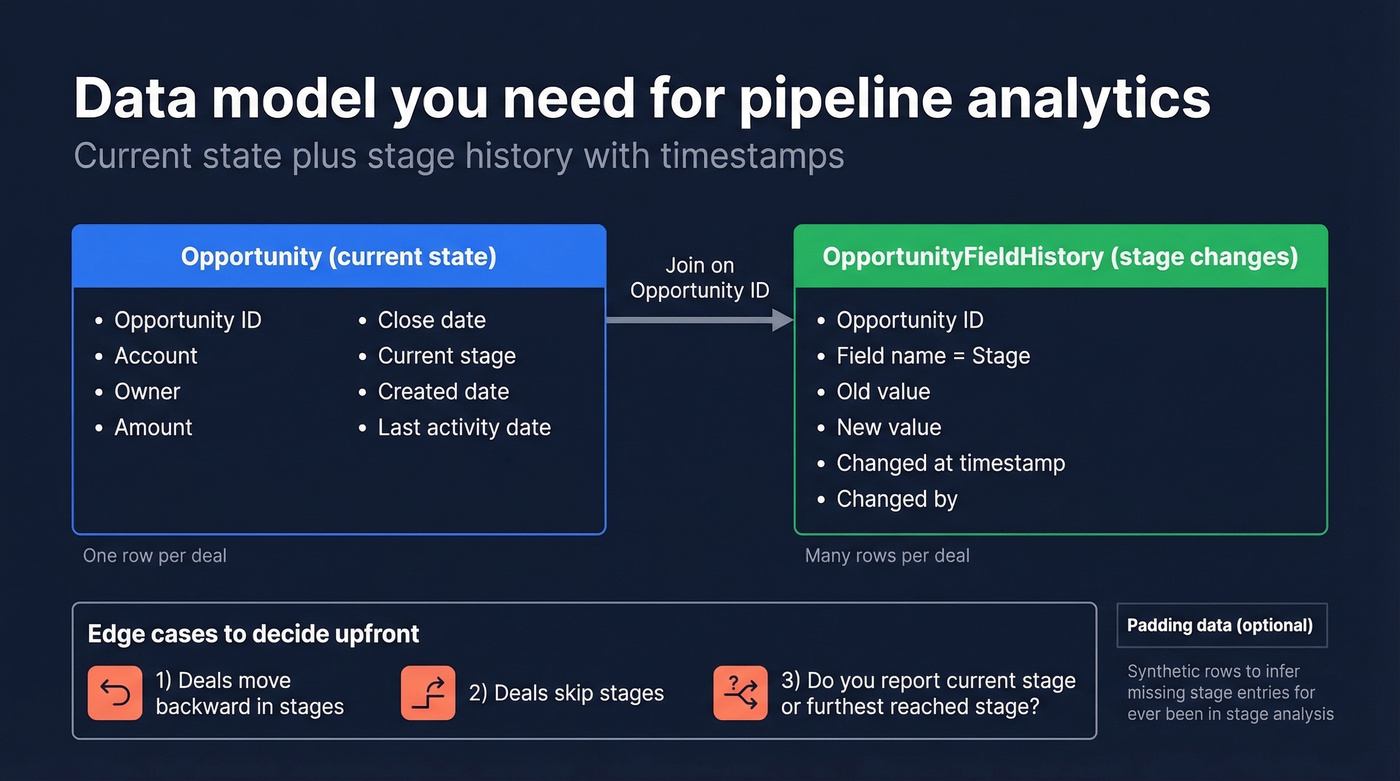
The timestamp history is what makes pipeline intelligence actionable. Without it, you can see where deals are but not how they got there or how long each stage took. Two real-world data issues to plan for: reps moving deals backward in stages - decide upfront whether you track current stage or furthest-reached stage - and skipped stages where a deal jumps from stage 1 to stage 3. You'll need "padding data," synthetic rows with inferred timestamps, if you want accurate "ever been in stage" analysis.
One Reddit practitioner who built a full sales analytics platform on Microsoft Fabric warned that API authentication was "rough" and recommended budgeting extra time for data pipeline configuration. Plan for it.
Step 4: Pick Your Core Metrics
Let's be honest - track three metrics well instead of twenty badly. These three give you 80% of the insight. For a broader KPI menu (and what each one diagnoses), see our guide to sales operations metrics.
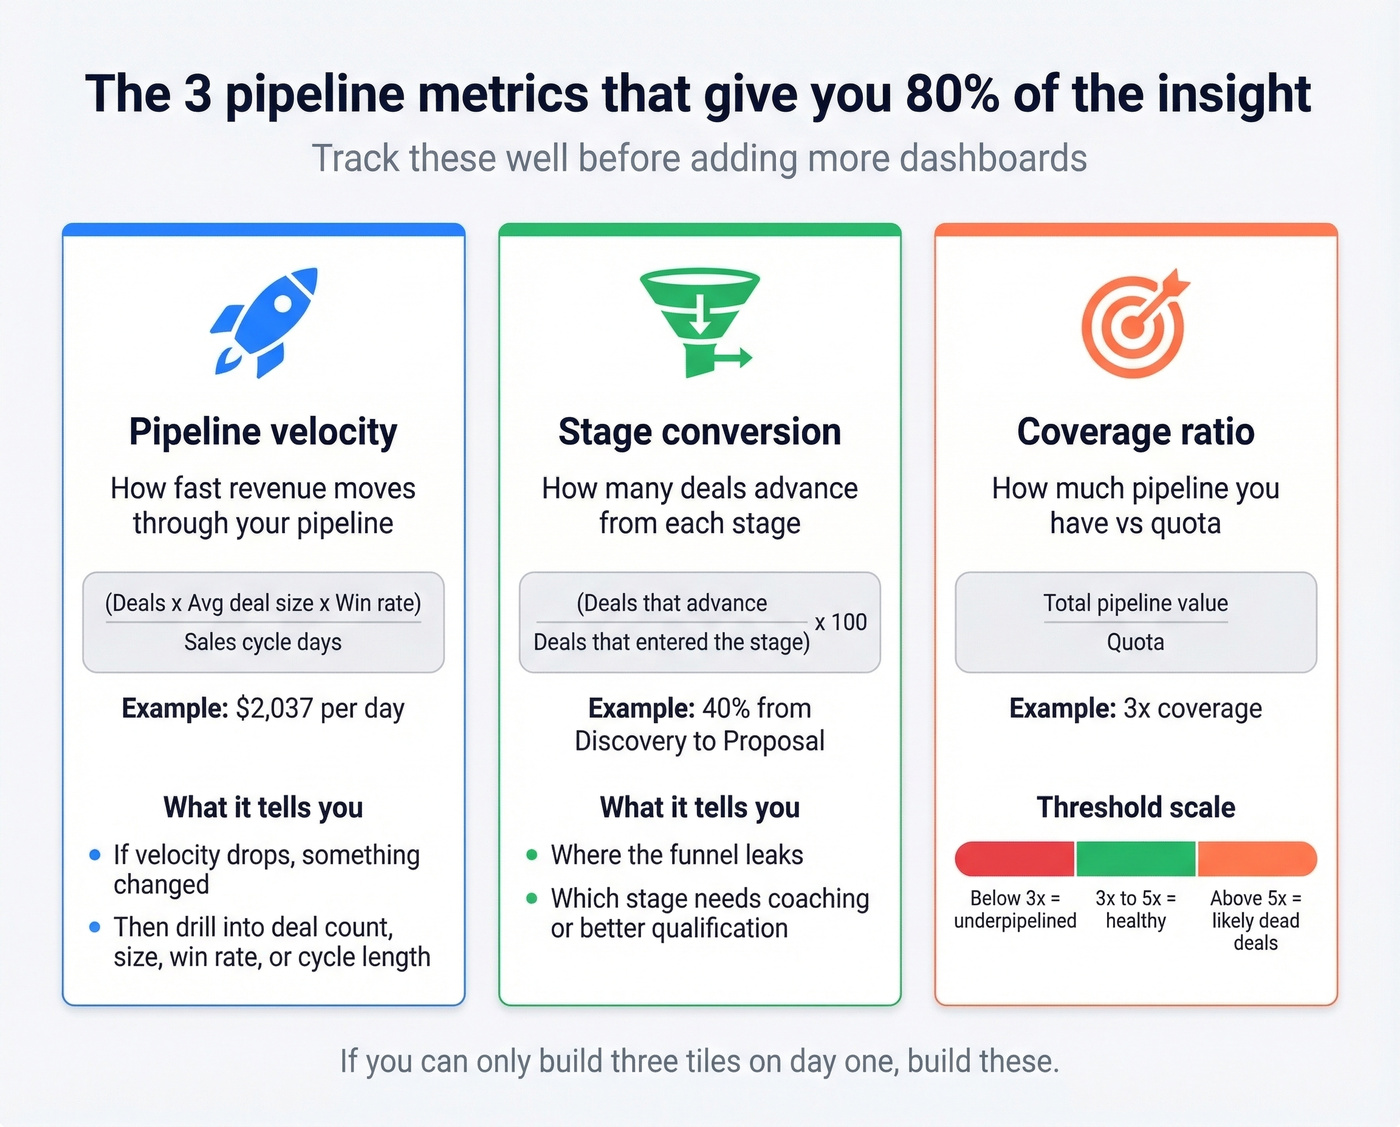
Pipeline Velocity = (Deals x Avg Deal Size x Win Rate) / Sales Cycle Days
Example: (50 x $12,400 x 22%) / 67 = $2,037/day
Pipeline velocity is the single most diagnostic metric because it combines deal count, deal size, win rate, and cycle length into one number. When velocity drops, you immediately know something changed - then you drill into which input moved.
Stage Conversion = (Deals that advance to the next stage / Deals that entered the stage) x 100
Example: 100 entered Discovery, 40 advanced to Proposal = 40%
Coverage Ratio = Total pipeline value / Quota
Example: $1.5M pipeline / $500K quota = 3x
Coverage should sit at 3-5x quota. Below 3x means you're underpipelined. Above 5x usually means you're hoarding dead deals. Work backward from your revenue target to set pipeline creation goals: if your quota is $500K and your win rate is 20%, you need $2.5M in pipeline - that's 5x coverage, and it tells you exactly how much pipeline your team needs to generate each month.
Outreach's platform data shows that opportunities closed within 50 days have a 47% win rate, versus 20% or lower beyond that threshold. Build a velocity alert for deals approaching your industry's cycle-length benchmark.
Step 5: Build Your Dashboards
Your dashboard isn't one screen - it's a set of views, each answering a different question:
- Revenue by category - slice by deal type, product line, region, and deal size buckets
- Rep comparisons - conversion rates and velocity by rep, not just total pipeline
- Stage velocity - average days in each stage, with trend lines
- Cohort/funnel analysis - group deals by creation month, track close timing distribution (if you need a clean structure for this, map it to your B2B sales funnel template)
- Anomaly detection - deals that regressed, slipped close dates, or stalled beyond benchmarks
For advanced teams, Clari's pipeline inspection framework is worth studying. Their five views cover QTD pipeline created mix, ABM program attribution, slipped deal drill-downs, next-quarter flow analysis, and coverage trending by segment. The key is adding a CRM field like "ABM Target Quarter" so you can segment pipeline by program source.
Step 6: Establish Your Review Cadence
The data on cadence is striking. A study of 247 B2B organizations found that teams with weekly pipeline tracking hit 34% revenue growth and 87% forecast accuracy, while ad-hoc trackers managed just 11% growth and 52% accuracy.
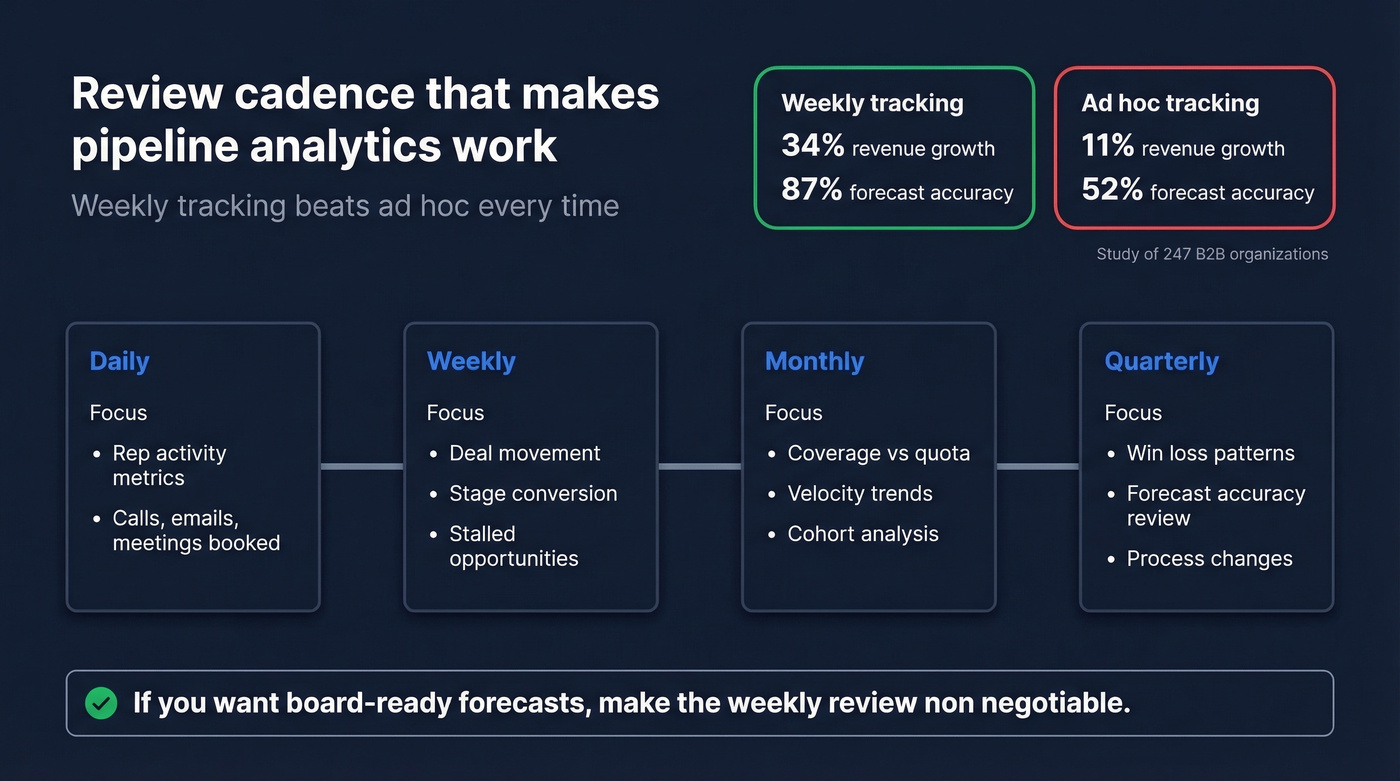
That gap alone justifies the implementation effort.
Weekly pipeline reviews aren't a suggestion. Here's a practical cadence:
| Frequency | Focus |
|---|---|
| Daily | Rep activity metrics - calls, emails, meetings booked |
| Weekly | Deal movement, stage conversion, stalled opportunities |
| Monthly | Pipeline coverage vs quota, velocity trends, cohort analysis |
| Quarterly | Win/loss patterns, forecast accuracy review, process changes |
If you run QBRs, keep the analytics tight with a standard set of QBR questions to ask.
91% of CRM data is incomplete - and that kills pipeline analytics before you even open a dashboard. Prospeo's CRM enrichment returns 50+ data points per contact at a 92% match rate, with a 7-day refresh cycle that keeps your Salesforce and HubSpot records current automatically.
Stop forecasting on ghost pipeline. Fix the data underneath.
Industry Benchmarks Worth Knowing
You need context for your numbers. These benchmarks come from the same 247-company study:
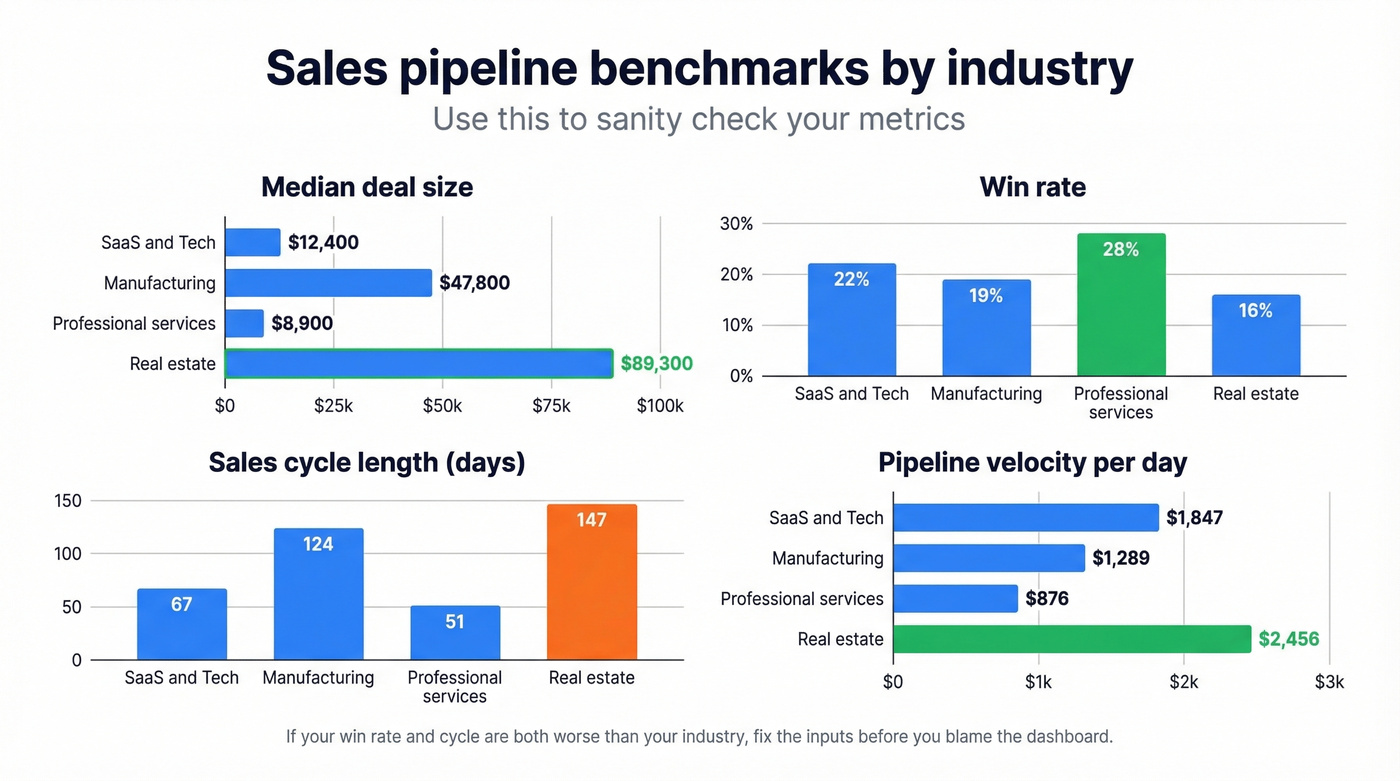
| Industry | Median Deal | Win Rate | Cycle (Days) | Velocity/Day |
|---|---|---|---|---|
| SaaS & Tech | $12,400 | 22% | 67 | $1,847 |
| Manufacturing | $47,800 | 19% | 124 | $1,289 |
| Prof. Services | $8,900 | 28% | 51 | $876 |
| Real Estate | $89,300 | 16% | 147 | $2,456 |
If your SaaS team's win rate is 15% and your cycle is 90 days, you're underperforming on both dimensions. These benchmarks tell you where to focus. For more context on targets, compare against current sales pipeline benchmarks.
Look - most teams don't have an analytics problem. They have a pipeline hygiene problem. If your win rate is half the industry benchmark, no dashboard will save you. Fix the inputs first. The companies that get the most from pipeline analytics are the ones that already have disciplined stage management and clean data. Everyone else is just building prettier reports on top of fiction.
Moving to Predictive Analytics
Once your core metrics are stable and your review cadence is running, the next step is layering in forward-looking models. Predictive pipeline management uses historical stage-conversion data, deal velocity patterns, and engagement signals to forecast which deals will close - and which are quietly dying. If you want to go deeper on modeling, start with predictive analytics in sales.
Tools like Clari and Gong already offer scoring models that flag at-risk opportunities before a rep notices the silence. The prerequisite is the same clean data and stage history you built in the framework above; without it, predictive models just amplify noise.
Your Analytics Tool Stack
You don't need a $50K revenue intelligence platform to start. You need four layers, and most teams already have two of them.
| Layer | Tool | Starting Price |
|---|---|---|
| CRM | Salesforce | ~$25/user/mo |
| CRM | HubSpot Sales Hub | Free CRM; paid from ~$20/seat/mo |
| CRM | Pipedrive | ~$14/user/mo |
| Data Warehouse | Microsoft Fabric | Capacity-based; Power BI Pro ~$10/user/mo |
| Data Warehouse | Snowflake | Consumption-based |
| BI | Tableau | ~$15/user/mo |
| BI | Power BI | ~$10/user/mo |
| Revenue Intel | Clari | ~$30K-$100K+/yr |
| Revenue Intel | Gong | ~$25K-$80K+/yr |
| Data Quality | Prospeo | Free tier; ~$39/mo paid |
In our experience, teams that fix data quality first see dashboard adoption double - reps actually trust the numbers when the underlying contacts are current. That Reddit practitioner who built a full analytics platform on Microsoft Fabric and Power BI went from proof-of-concept to production in three months. That's a realistic timeline for a data-warehouse-grade implementation. CRM-native dashboards can be live in one to two weeks.
Mistakes That Kill Pipeline Analytics
Building dashboards before fixing data quality. Gartner estimates poor data quality costs companies $15M annually. 91% of CRM data is incomplete, and most analytics guides don't even mention this. You can't analyze your way out of bad inputs.
Using seller actions as stage exit criteria. "Sent proposal" isn't a stage - it's a rep activity. Stages should reflect customer commitment.
Tracking too many metrics. Twenty dashboards that nobody checks are worse than three metrics reviewed weekly. Start with velocity, conversion, and coverage.
No review cadence. Ad-hoc pipeline reviews correlate with 52% forecast accuracy. Weekly reviews hit 87%. The dashboard doesn't matter if nobody's looking at it.
Ignoring the ROI of proper integration. Salesforce customers who properly integrated their data reported a 26% productivity increase and 5-10 hours saved per rep per week. The implementation effort pays for itself - but only if you commit to the full stack, not just the dashboard layer.
Skipping pipeline risk intelligence. Anomaly detection dashboards are only useful if someone acts on them. Build automated alerts for deals that regress stages, slip close dates more than once, or go dark beyond your average cycle length - these are the early warning signals that turn reactive forecasting into proactive deal management.
Your pipeline velocity formula is only as good as the contacts attached to each deal. Prospeo's native Salesforce and HubSpot integrations auto-refresh contact data every 7 days with 98% email accuracy - so your stage conversions reflect real buyers, not people who left the company six months ago.
Real pipeline analytics starts with contacts that actually pick up the phone.
FAQ
What's the most important pipeline metric to track first?
Pipeline velocity. It combines deal count, average deal size, win rate, and sales cycle length into one diagnostic number. When velocity drops, you know immediately something changed - then drill into which input moved. For SaaS teams, benchmark against $1,847/day median velocity.
How long does it take to implement sales pipeline analytics?
A basic CRM-native setup takes one to two weeks. A full implementation with stage history tracking, a data warehouse, and custom dashboards takes two to three months. Budget extra time for API configuration and data pipeline testing - especially on platforms like Microsoft Fabric.
How do I fix pipeline data that's already inaccurate?
Run an audit: flag opportunities with no activity in 30+ days, verify contact data with an enrichment tool, and enforce objective stage exit criteria going forward. Archive dead deals, then set up automated alerts for stale opportunities so the problem doesn't compound again.
What's pipeline intelligence versus basic reporting?
Pipeline intelligence combines real-time deal data, engagement signals, and historical patterns to surface insights you wouldn't catch manually - like which deals are at risk, which reps are sandbagging, and where your forecast is soft. Basic reporting tells you what happened; pipeline intelligence tells you what's likely to happen next and where to intervene.