Machine Learning Sales Forecasting: The Practitioner's Guide (2026)
A RevOps lead we know ran a forecasting bake-off last quarter. Three models, two months of tuning, one confident presentation to the board. The model with the best training accuracy produced the worst live predictions - off by 30% in the first month. The seasonal naive baseline it was supposed to replace? Off by 12%. That's the state of machine learning sales forecasting in most organizations: expensive complexity losing to simple math.
Why Most Forecasts Fail
It's Thursday afternoon, and the VP of Sales is prepping the board deck. The CRM says $4.2M in pipeline for the quarter. Marketing's attribution model says $3.8M. Finance modeled $3.1M from historical trends. The board gets the $4.2M number because that's the one that doesn't trigger uncomfortable questions. Three months later, the company closes $2.9M.
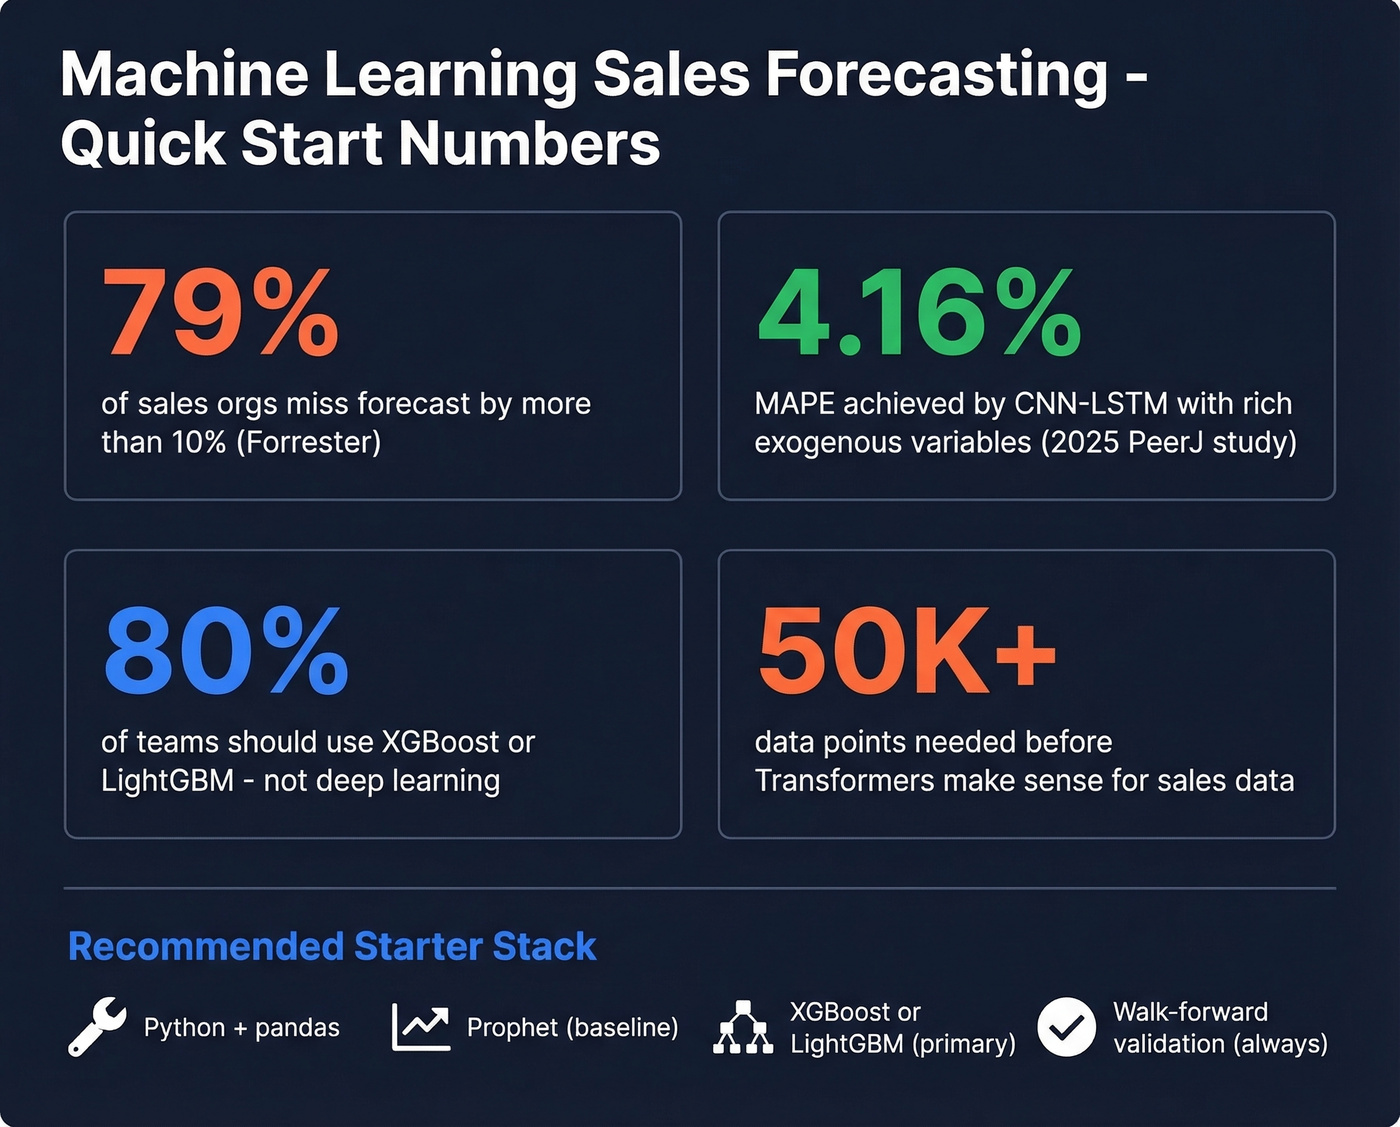
This isn't a made-up scenario. Forrester found that 79% of sales organizations miss their forecast by more than 10%. That's not a rounding error - it's a structural failure that leads to bad hiring plans, missed inventory targets, and CFOs who stop trusting the revenue team entirely.
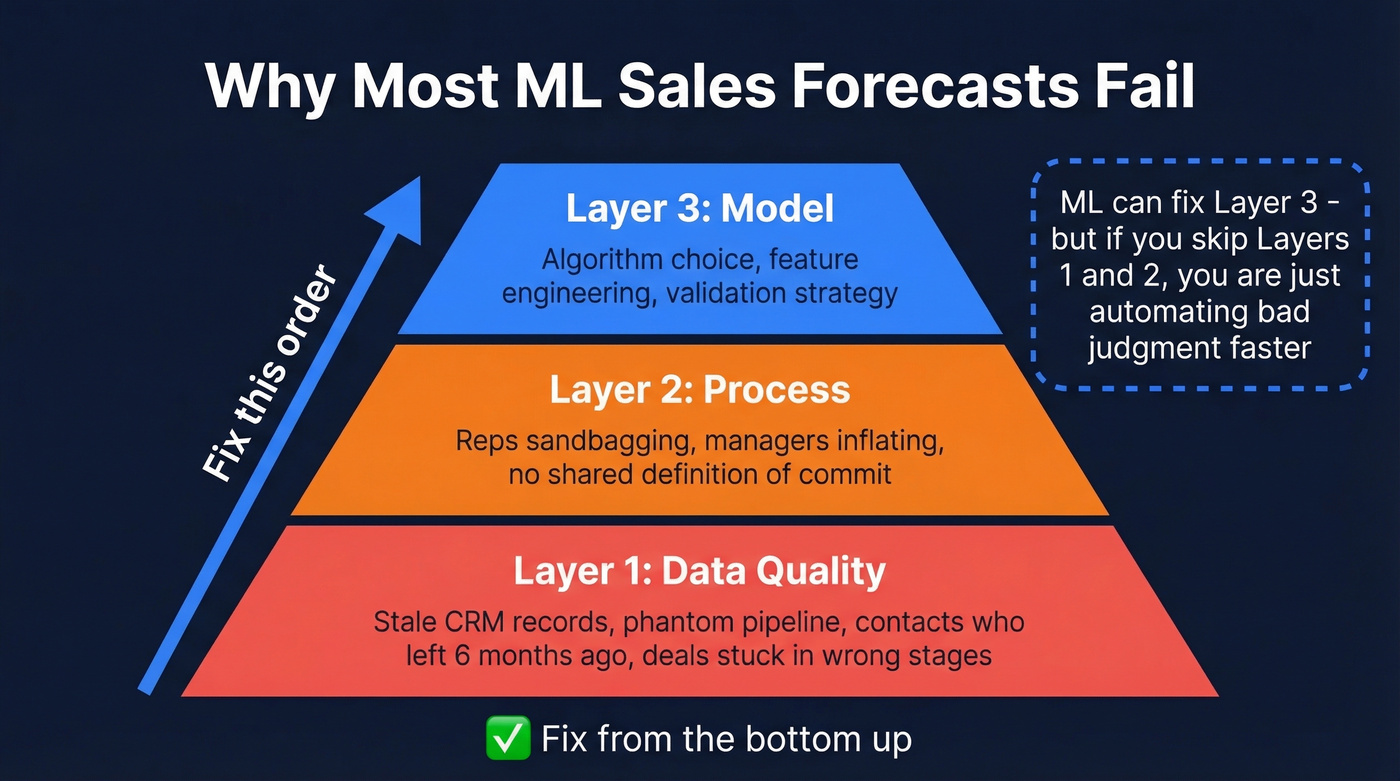
The root causes stack in a predictable order. First, data quality: stale CRM records, phantom pipeline from contacts who left their company six months ago, deals sitting in stages that don't reflect reality. Second, process: reps sandbagging, managers inflating, nobody agreeing on what "commit" means. Third, model: even when you throw ML at the problem, garbage inputs produce garbage outputs with more decimal places.
ML can fix the third layer. But if you skip the first two, you're just automating bad judgment faster.
What ML-Driven Sales Forecasting Actually Is
Let's be direct. This approach uses algorithms to find patterns in historical sales data - patterns too complex or too numerous for a human analyst to spot in a spreadsheet. Instead of a rep saying "I feel good about this quarter," the model says "based on 14 signals across 2,000 historical deals, here's a probability-weighted revenue estimate."
B2B pipeline forecasting predicts revenue from an existing pipeline of deals. The inputs are CRM fields: deal stage, days in stage, deal size, activity volume, contact seniority. The output is a quarterly or monthly revenue number over a 30-90 day horizon.
Retail/CPG demand forecasting predicts unit sales for products across locations. The inputs are historical transaction volumes, seasonality, promotions, pricing, weather, and economic indicators. The output is daily or weekly unit forecasts per SKU-location, sometimes stretching months ahead.
Both are time-series problems at their core. But the feature engineering, model selection, and validation strategies differ significantly.
Here's what ML forecasting is not: a crystal ball, a replacement for sales process, or automatically better than simple methods. Models extrapolate from patterns - if the pattern breaks, the model breaks. No algorithm fixes a pipeline where 40% of deals are zombies. And a well-tuned seasonal average beats a poorly implemented neural network every single time.
What You Need Fast
Short on time? Here's the framework.
Before you touch a model:
- Clean your CRM data. If your pipeline is full of stale contacts and outdated deal stages, no algorithm will save you. For B2B pipeline inputs, audit contact freshness with an enrichment tool - Prospeo returns 50+ data points per contact on a 7-day refresh cycle, so your pipeline inputs reflect reality instead of last quarter's org chart. (If you're evaluating providers, start with the best data enrichment tools.)
- Establish a baseline. Run a seasonal naive forecast - last year's same-period actuals, adjusted for growth. This is your "beat this" benchmark.
- Define your metric and its business meaning. MAPE is nice, but does a 10% over-forecast cost the same as a 10% under-forecast? Usually not.
Starter stack for most teams:
- Python + pandas for data prep
- Facebook Prophet for a quick seasonal baseline
- XGBoost or LightGBM for the "real" model once you've engineered lag features and exogenous variables
- Walk-forward validation - never random splits on time-series data
What to skip early: Deep learning (unless you have 100K+ data points and strong exogenous signals), Transformers (the hype-to-value ratio is still terrible for most sales datasets), and AutoML platforms that promise "one-click forecasting." They hide decisions you need to understand.
Pick the Right Model
Model selection is where most teams either overthink or underthink the problem.
| Model | Best For | Min Data | Interpretability | Ops Cost |
|---|---|---|---|---|
| Seasonal Naive | Baseline benchmark | 2 cycles | High | Near zero |
| ARIMA/ETS | Univariate, stable | 50+ points | High | Low |
| Prophet | Seasonal + holidays | 2+ years | Medium-high | Low |
| Linear/Elastic Net | Few features, fast | 100+ rows | High | Low |
| Random Forest | Tabular + some lags | 500+ rows | Medium | Medium |
| XGBoost/LightGBM/CatBoost | Feature-rich tabular | 1K+ rows | Medium | Medium |
| LSTM/GRU | Long sequences | 10K+ points | Low | High |
| CNN-LSTM hybrid | Sequences + patterns | 10K+ points | Low | High |
| Temporal Fusion Transformer | Multi-horizon, rich | 50K+ points | Medium | Very high |
Baselines That Beat Hype
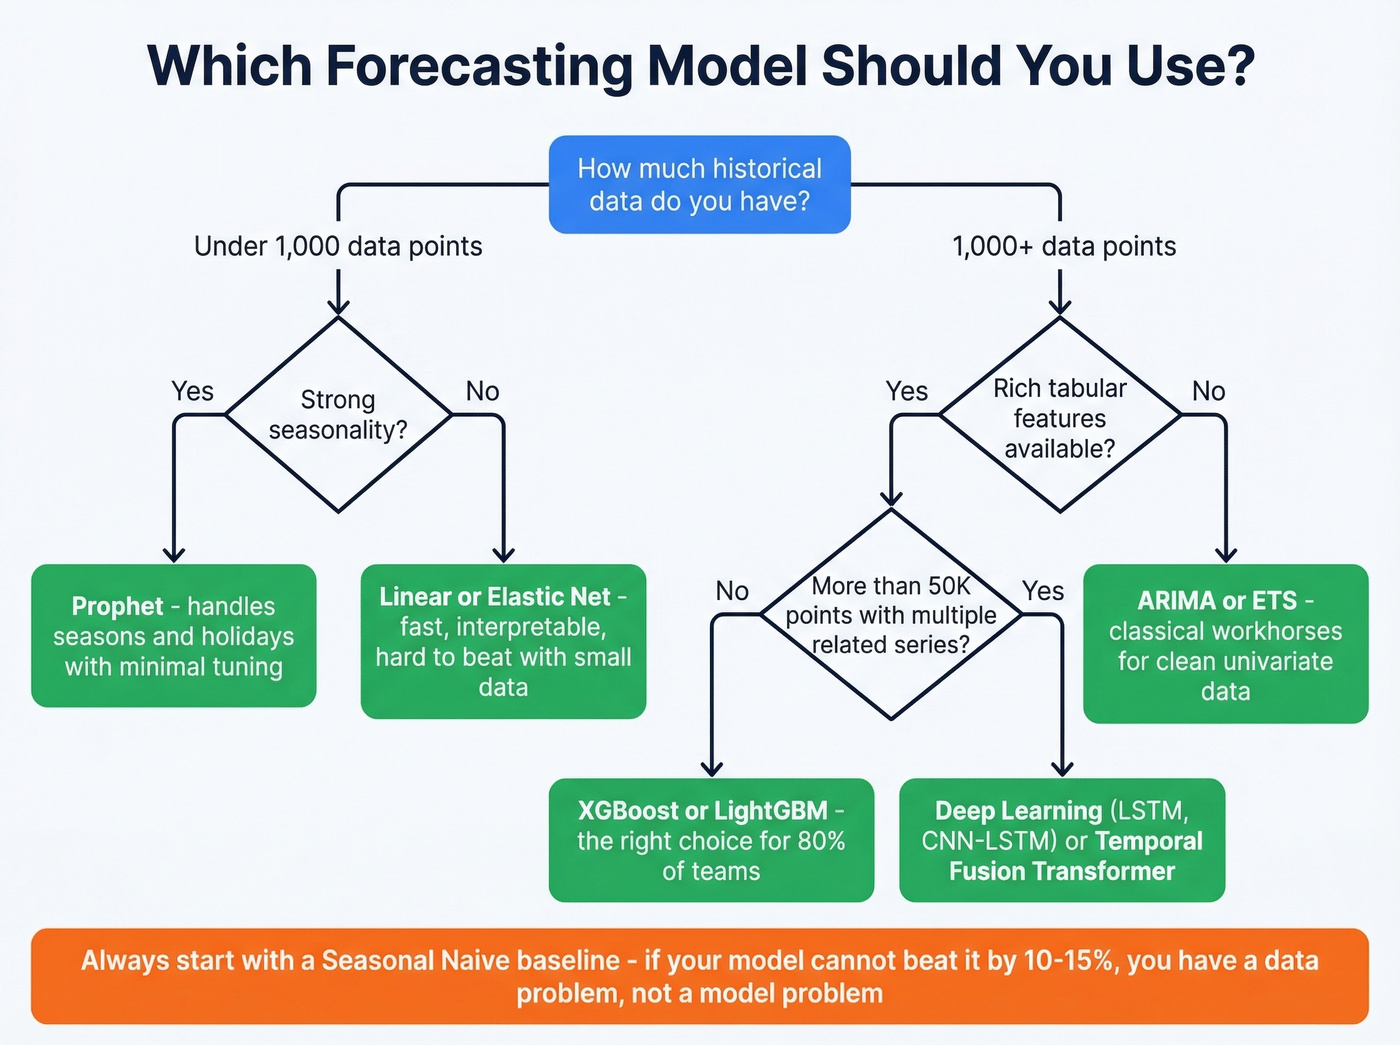
ARIMA and ETS are the workhorses of classical time-series forecasting. They're fast, interpretable, and surprisingly hard to beat on clean univariate data with strong seasonality. A seasonal naive model - literally "what happened this time last year, plus trend" - should be your first benchmark. If your fancy model can't beat seasonal naive by at least 10-15%, you don't have a modeling problem. You have a data problem.
Prophet sits in the sweet spot between classical stats and ML. It handles multiple seasonalities, holiday effects, and trend changepoints without manual ARIMA parameter tuning. For teams without a dedicated data scientist, Prophet is often the best terminal model - not just the baseline.
Workhorse Models
XGBoost, LightGBM, and CatBoost dominate tabular sales forecasting for a reason. They handle mixed feature types, they're fast to train, and they're robust to moderate noise. The key insight: you're converting a time-series problem into a supervised learning problem by engineering lag features, rolling averages, and calendar encodings as input columns.
A typical feature set for a monthly B2B pipeline forecast includes: revenue from the same month last year, 3-month rolling average, quarter-end flag, number of open deals, average deal age, and win rate over the trailing 90 days. XGBoost and ensemble methods show consistently strong performance across sales prediction benchmarks, and they're the model we'd recommend for 80% of teams reading this.
Look, if your average deal size is under $25k and your pipeline has fewer than 500 deals per quarter, you probably don't need anything fancier than LightGBM with solid feature engineering. The teams chasing deep learning architectures for B2B pipeline forecasting are almost always solving the wrong problem.
When Deep Learning Earns Its Complexity
Deep learning makes sense when you have tens of thousands of observations, multiple related series across hundreds of SKUs, and rich exogenous variables. A 2025 PeerJ study demonstrated a hybrid CNN-LSTM achieving 4.16% MAPE on retail sales data - but that result came with external variables including holidays, salary days, protests, and weather data. Strip those exogenous inputs, and the advantage over gradient-boosted trees shrinks fast.
LSTMs and GRUs capture long-range temporal dependencies that tree-based models miss. If your sales data has complex, multi-step seasonal patterns - fashion retail with trend cycles, agricultural products with harvest-dependent demand - deep learning can outperform. But the training cost, tuning complexity, and interpretability tradeoff mean you need a real data science team to maintain these in production.
Transformer Reality Check
Temporal Fusion Transformers and other attention-based architectures get a lot of press. Here's the thing: many benchmarks show simpler architectures and baselines often outperform Transformer variants unless carefully adapted to the time-series domain. Transformers were designed for language, not for the structured, relatively low-volume data most sales teams work with.
If you have fewer than 50,000 data points, a Transformer is almost certainly overkill. We've seen teams spend a quarter building a Transformer pipeline that underperformed a LightGBM model trained in an afternoon.
Features That Move Error
The model matters less than the features you feed it. A mediocre algorithm with great features beats a great algorithm with mediocre features almost every time.
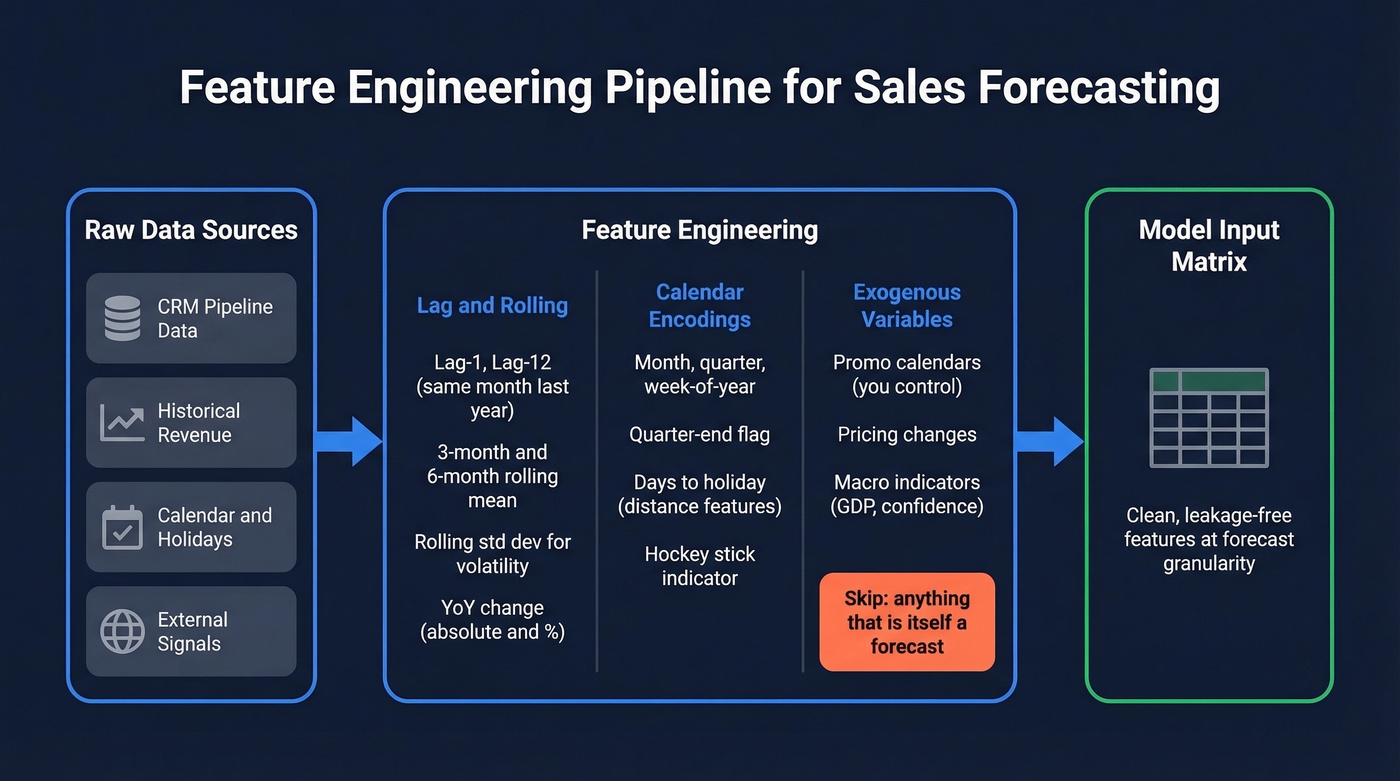
Lag and Rolling Features
For any time-series sales model, your minimum feature set should include:
- Lag values: same period last year (lag-12 for monthly, lag-52 for weekly), last period (lag-1), and lag-2 or lag-3 for short-term momentum
- Rolling statistics: 3-period and 6-period rolling mean, rolling standard deviation for volatility, rolling min/max
- Differenced values: period-over-period change and year-over-year change, both absolute and percentage
Compute these at the granularity you're forecasting. If you're predicting monthly revenue by segment, your lags and rolls should be monthly by segment. Mixing granularities is a common source of subtle leakage.
Calendar and Exogenous Signals
Encode calendar features explicitly: month, quarter, day-of-week for daily data, week-of-year, quarter-end flag, month-end flag. For B2B pipeline forecasting, quarter-end effects are massive - the classic hockey-stick pattern where 40-60% of quarterly revenue closes in the final two weeks. Prophet handles holiday encoding natively; for tree-based models, create binary or distance-to-holiday features.
External signals can sharply improve accuracy or add noise that makes everything worse. An exogenous variable helps only if it's available at prediction time and genuinely causal with your target. Good examples: promotional calendars you control, pricing changes, macroeconomic indicators like GDP or consumer confidence. Bad examples: anything that's itself a forecast, since future weather predictions compound errors, and anything that changes faster than your retraining cadence.
Stale CRM records are the #1 reason ML forecasts fail. Prospeo enriches your pipeline with 50+ data points per contact on a 7-day refresh cycle - so your model trains on reality, not last quarter's org chart. 98% email accuracy, 92% API match rate.
Fix your forecast inputs before you tune another hyperparameter.
Pitfalls That Kill Projects
More ML forecasting projects fail than succeed. Not because the math is wrong, but because the implementation ignores realities that textbooks skip.
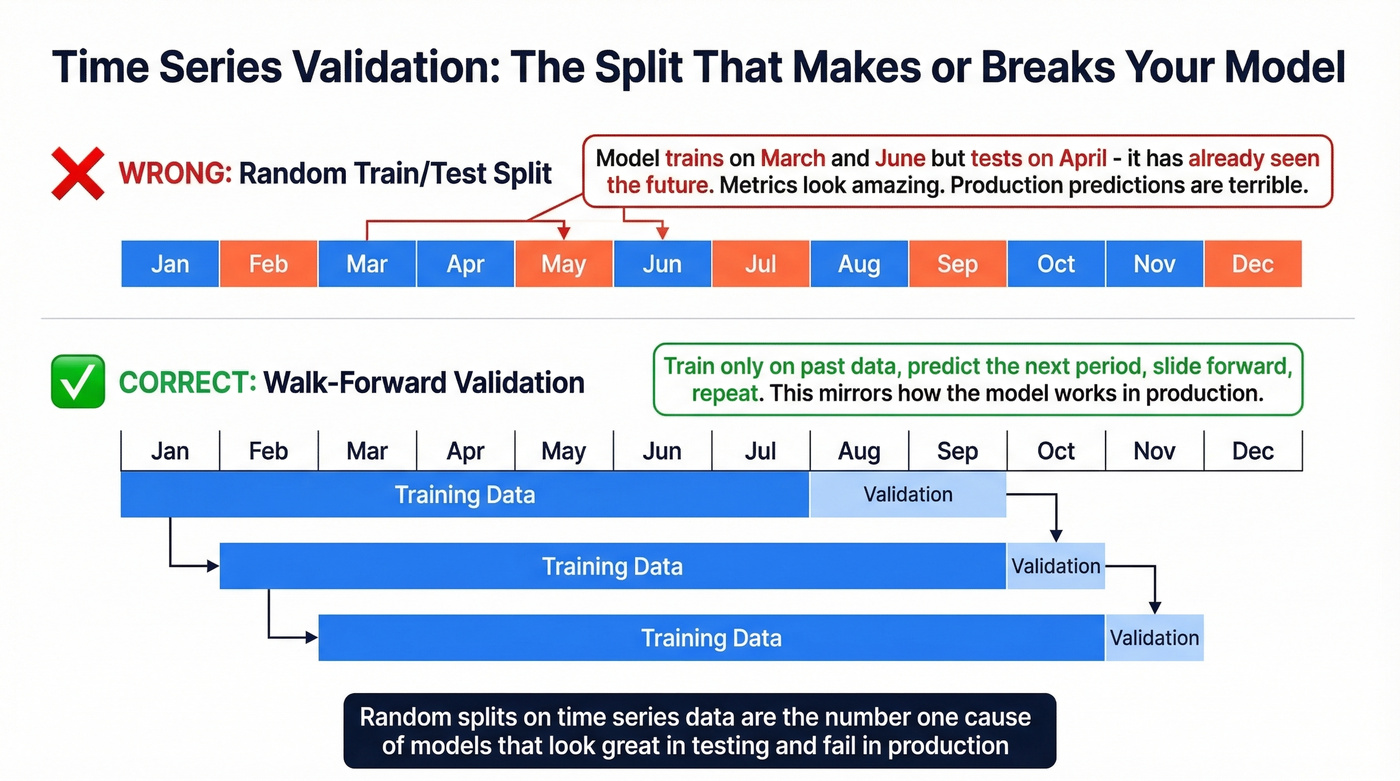
Leakage and Bad Splits
Data leakage is the silent killer. In time series, it happens when future information bleeds into training data. The most common form: using a random train/test split instead of a temporal one. If your model trains on data from March and June but tests on April, it's already "seen" the future. The metrics look great. The production predictions are worthless.
Other leakage sources: features computed using the full dataset with global averages that include future periods, target-encoded categoricals calculated across all time periods, and "actuals" columns only available after the fact. Always split temporally. Walk-forward validation - sliding the window forward and averaging performance - is the gold standard.
Overfitting From Too Many Campaigns
A practitioner on r/datascience described the classic failure mode: ~90% training R-squared with Gaussian Process Regression, but "garbage on validation." The culprit? Too many campaign and promotional features creating a model that memorized the training set.
Real-world sales data is messy. You might have dozens of overlapping campaigns, each with different start dates, channels, and discount levels. Encoding every campaign as a separate feature creates a high-dimensional input space that tree-based models will happily overfit. The fix: aggregate campaigns into categories like discount depth buckets and channel types, use PCA on campaign features, and prune anything that doesn't improve out-of-sample performance.
Drift and Regime Shifts
Models trained on 2019-2023 data didn't predict 2020. Nobody's did. The same principle applies to smaller regime shifts: a new competitor entering the market, a pricing restructure, a shift from field sales to inside sales. These structural breaks invalidate the patterns your model learned.
The Zillow cautionary tale is worth remembering - their algorithmic home-buying program's pricing failures became a widely cited example of what happens when models meet regime shifts. The lesson isn't "don't use ML." It's "monitor for drift and have circuit breakers." Build drift detection into your pipeline. Track prediction error over rolling windows. If error suddenly spikes, trigger a retrain or flag for human review.
Asymmetric Cost Functions
Optimizing RMSE or MAPE treats over-forecasting and under-forecasting as equally bad. They rarely are.
In manufacturing, over-forecasting means excess inventory and spoilage. Under-forecasting means stockouts and lost revenue. In B2B SaaS, over-forecasting means over-hiring and burning cash. Define asymmetric loss functions that reflect your actual business costs. If under-forecasting is 3x more expensive than over-forecasting, your model should be biased slightly high. This is a business decision, not a statistical one - and it's the conversation most data science teams skip.
Deployment Reality Checks
A practitioner on Reddit described their constraints: 8GB RAM, no cloud access, no Git or CI/CD, monthly manual retraining on an on-prem server, and a single person doing both data science and data engineering. This isn't unusual - it's the norm for mid-market companies without dedicated ML teams. Your model choice has to fit your deployment reality, not your ambition.
The intermittent demand problem is equally common. When ~50% of monthly values for a SKU are zero, standard regressors produce absurd predictions - forecasting 200 units for a product that sells 3 in a good month. The fix: use methods designed for intermittent demand. Croston's method and its variants decompose the forecast into two components - the probability of a non-zero demand occurring and the expected size when it does. For ML approaches, two-stage models work well: a classifier predicting "will there be a sale?" followed by a regressor predicting "how much?" only for predicted-positive periods.
When your constraint set is tight, LightGBM is your best friend. It's memory-efficient, fast to train, and serializes to small model files. Save as .pkl, retrain monthly, deploy locally. Not glamorous, but it works.
Build It End-to-End
Here's the implementation sequence that works in production.
Step 1: Audit your data. Before writing a single line of model code, profile your input data. How many missing values? How stale are your CRM records? For B2B pipeline models, check whether the contacts and accounts feeding your pipeline are still accurate. Running your CRM through an enrichment pass before modeling eliminates the "phantom pipeline" problem where deals are attached to people who left the company months ago. (If you're tightening pipeline hygiene, see B2B sales pipeline management.)
Step 2: Establish your baseline. Run a seasonal naive forecast. For monthly data, that's last year's same month adjusted for year-over-year growth rate. Document the MAE, RMSE, and MAPE. If you can't beat seasonal naive by at least 10%, you need better data, not a better model.
Step 3: Engineer features and train. Build your lag/rolling/calendar features. Start with XGBoost or LightGBM. Use walk-forward cross-validation with at least 3-5 folds. Track MAE for absolute error, MAPE or WAPE for relative error, and bias to catch systematic over- or under-prediction.
Step 4: Validate honestly. Hold out the most recent 2-3 periods as a true test set you never touch during development. A significant gap between CV performance and holdout performance means you have a stationarity problem.
Step 5: Deploy with monitoring. Set up automated drift detection. Track rolling prediction error weekly. Define retraining triggers - both scheduled and event-driven. Document your model's assumptions so the next person who inherits it understands what breaks it.
Step 6: Close the loop. Share forecast accuracy reports with stakeholders monthly. Compare ML forecast vs. rep forecast vs. manager forecast. Transparency builds trust, and trust is what gets the organization to actually use the model's output instead of overriding it with gut feel. (If you're standardizing team metrics, align on OKRs for Sales Teams.)
Data Quality Wins Over Model Tuning
Here's the uncomfortable truth: the model is rarely the bottleneck. The data is.
In B2B pipeline forecasting, your model's inputs come from CRM records that reps update inconsistently, contact data that decays at 30-40% per year, and deal stages that reflect optimism more than reality. A model trained on this data learns the noise, not the signal. We've seen teams spend months tuning hyperparameters when the real problem was that 25% of their pipeline contacts had changed jobs. (This is exactly why teams invest in data validation automation.)

Prospeo addresses the contact-data layer of this problem. With 300M+ professional profiles, 143M+ verified emails, and a 7-day data refresh cycle versus the 6-week industry average, running your CRM through enrichment catches stale records before they corrupt your forecast inputs. An 83% enrichment match rate means the vast majority of your contacts come back with fresh, verified data - 50+ data points per record including current company, title, and direct contact information. (If you're comparing sources, start with a verified contact database or the best B2B database.)
For pipeline forecasting specifically, deal-level features like "contact seniority" and "account size" are only useful if they're current. A model that thinks a deal's primary contact is still a VP when they left three months ago will misweight that opportunity. Fixing this upstream - before the data ever reaches your model - is the highest-ROI investment you can make in forecast accuracy. (Related: benefits of data enrichment.)
Phantom deals from contacts who changed jobs six months ago poison every model you build. Prospeo tracks job changes across 300M+ profiles and flags stale contacts automatically - giving your features the freshness gradient boosted trees actually need.
Stop training models on dead pipeline. Start with verified data.
Proof It Works
Two cases where ML forecasting delivered measurable results - and what made the difference.
Danone + ToolsGroup implemented ML-driven demand modeling to account for promotional lift and media effects. The results: 20% reduction in forecast error, forecast accuracy reaching 92%, 30% reduction in lost sales, and service levels hitting 98.6%. Demand planners' workload dropped by 50% - not because the model replaced them, but because it eliminated the manual data wrangling that consumed their weeks.
EU food ingredients distributor built a custom forecasting hub integrating ERP data with external variables - holiday calendars, harvest reports, shipping logistics, and commodity price indices. The system used SKU-specific modeling, assigning different algorithms to stable versus seasonal items. First-year results: 29% improvement in forecast accuracy, 34% decrease in inventory spoilage, and 21% reduction in emergency air-freight costs.
The common thread: the ML system didn't just improve a number on a dashboard. It changed operational decisions - how much to produce, when to ship, what to promote. The model is math. The system is math plus data infrastructure plus decision workflows plus monitoring. That's the difference between a forecasting model and a forecasting system.
Tools and Costs
For teams evaluating platforms rather than building from scratch, here's a quick comparison.
| Tool | Type | ~Price | Best For |
|---|---|---|---|
| Pipedrive | CRM + forecast | $39/user/mo | SMB pipeline |
| HubSpot | CRM + forecast | $50-$150/user/mo | Mid-market B2B |
| Salesforce Einstein | CRM AI add-on | $75-$200/user/mo | Enterprise CRM |
| Clari | Revenue platform | Not public | Revenue ops teams |
| Gong Forecast | Conversation intel | Not public | Call-heavy orgs |
| AWS Forecast | Cloud ML service | Usage-based | Custom builds |
| Open-source stack | Python/R libraries | Free (eng time) | Technical teams |
The CRM-native tools - Pipedrive, HubSpot, Salesforce Einstein - are the easiest path for teams that want forecasting without a data science hire. They're limited in customization but handle the basics: weighted pipeline, historical trends, rep-level rollups. Clari and Gong sit in the revenue intelligence layer, ingesting CRM data plus call and email activity to produce more signal-rich forecasts. (If you're rationalizing systems, map it to a RevOps tech stack.)
For teams building custom models, AWS Forecast offers managed time-series ML with usage-based pricing. The open-source stack is free but requires engineering time that isn't free at all - budget 2-4 months of a data scientist's time for a production-grade custom pipeline. Skip AutoML platforms that promise "one-click forecasting" unless you're comfortable not understanding the decisions the platform makes on your behalf.
None of these tools fix bad input data. That's where enrichment fits - upstream of the forecast, ensuring the CRM records feeding your model are current and accurate. (If you're cleaning up workflows, consider CRM automation software.)
FAQ
What accuracy should I expect?
Most B2B pipeline forecasts achieve 10-20% MAPE with well-tuned models. Retail/CPG demand forecasting can hit lower error rates - one study achieved 4.16% MAPE with a hybrid CNN-LSTM and rich exogenous data. Shorter horizons and aggregated forecasts are always more accurate than long-range, SKU-level predictions.
How much historical data do I need?
For monthly forecasts, aim for at least 2-3 full seasonal cycles (24-36 months minimum). Weekly data needs 2+ years. More data helps, but only if the underlying process hasn't fundamentally changed - data from before a major business model shift can actually hurt performance.
How do I prevent leakage in time-series data?
Always use temporal splits - train on past periods, validate on future periods. Never use random cross-validation. Check every feature for future information: global averages, target-encoded categoricals computed across all time, and outcome fields unavailable at prediction time. Walk-forward validation with 3-5 windows gives robust error estimates.
Should I forecast pipeline and product demand differently?
Yes. B2B pipeline forecasting is deal-centric with features like deal stage, activity signals, and win rates. Product demand forecasting is volume-centric with features like price, promotions, and seasonality. The model families overlap - both use XGBoost well - but the feature engineering differs significantly.
How can I improve forecast accuracy without changing models?
Clean your input data. Contact data decays 30-40% annually, and stale CRM records are the top source of forecast error in B2B. Running your pipeline through an enrichment pass catches job changes and outdated titles before they corrupt model inputs. In our experience, teams see a bigger accuracy lift from data hygiene than from switching algorithms.