QBR Deck Examples: 8 Slides That Win Exec Buy-In (2026)
Twenty-two slides. That's what the CSM brought to the quarterly review. The VP of Customer Success left after slide ten. The champion apologized over Slack afterward and asked for "just the highlights in an email." That deck took five hours to build. The email took twelve minutes and got more engagement than the meeting ever would have.
Most QBR decks are glorified status reports - and that's why executives stop showing up. The best QBR deck examples share a common trait: they drive decisions, not yawns. B2B customers with strong executive engagement are 2.5x more likely to renew. Meanwhile, [61% of managers](https://action.deloitte.com/insight/4477/reimagining-performance-management-for-enhanced-trust-and-human-performance) and 72% of workers don't trust their organization's performance management process, per Deloitte's Global Human Capital Trends. Your quarterly business review presentation is either building that trust or eroding it. There's no neutral.
Here's the quick version: the 8-slide structure below works for 90% of QBRs. If you just need a template right now, grab SlidesCarnival - free, no signup, 17 slides. If your QBR data is stale, clean your CRM contacts first. The scorecard slide is only as credible as the numbers behind it.
QBR vs. EBR - Know Which Deck You're Building
Before you touch a slide, figure out which meeting you're actually running. A QBR and an EBR require different decks, different audiences, and different levels of detail. (If you need the full breakdown, see QBR vs. EBR.)
| QBR | EBR | |
|---|---|---|
| Frequency | Quarterly | Annual or biannual |
| Audience | Day-to-day users, managers | Senior executives, C-suite |
| Focus | Tactical: adoption, support, roadblocks | Strategic: long-term vision, market trends |
| Slide count | 8-10 for execs, 12-15 operational | 10-15 max |
| Tone | Data-driven, action-oriented | Visionary, partnership-focused |
The contrarian take? Stop calling it a "Quarterly Business Review." Call it a "Quarterly Decision Meeting." If there's no decision to make, cancel the meeting and send a Loom instead. That framing alone will change how you build the deck.
Slide-by-Slide Walkthrough: 8 QBR Presentation Examples
This structure moves from context to insight to action. Every slide earns its place. We've seen this framework work across SaaS, agencies, and professional services - the specifics change, but the arc doesn't. (For more on the narrative arc, borrow a few ideas from sales deck storytelling.)
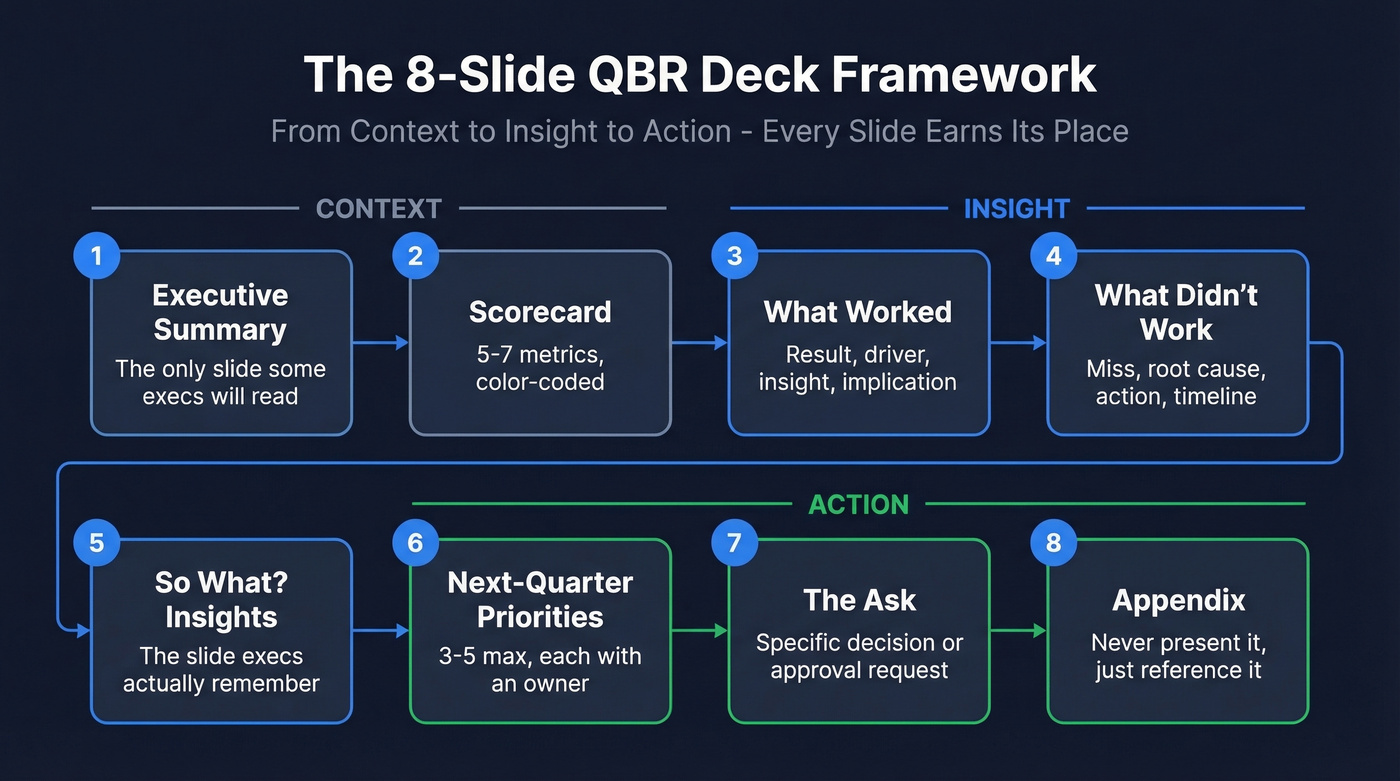
Slide 1: Executive Summary
This is the only slide some executives will read. Treat it like a memo, not a title card. One sentence on performance, one on the key insight, one on your recommendation, and one on what you need from leadership.
Filled-in example:
Q4 exceeded target by 12% ($2.4M vs $2.1M goal). Customer acquisition cost dropped 23% due to referral program. Recommend doubling referral budget in Q1. Need approval for $50K incremental spend.
Don't open with "Thank you for joining today" or a company logo slide. You've already lost 30 seconds of executive attention on nothing.
Slide 2: Scorecard
One table. Five to seven metrics. Strict color-coding. If a metric doesn't connect to a business outcome, cut it. When you have peer benchmark data, add a column showing how the customer compares to similar companies - nothing gets an executive's attention faster than seeing they're behind their competitors. (If you want a tighter set of pipeline indicators, use these pipeline health metrics as a filter.)
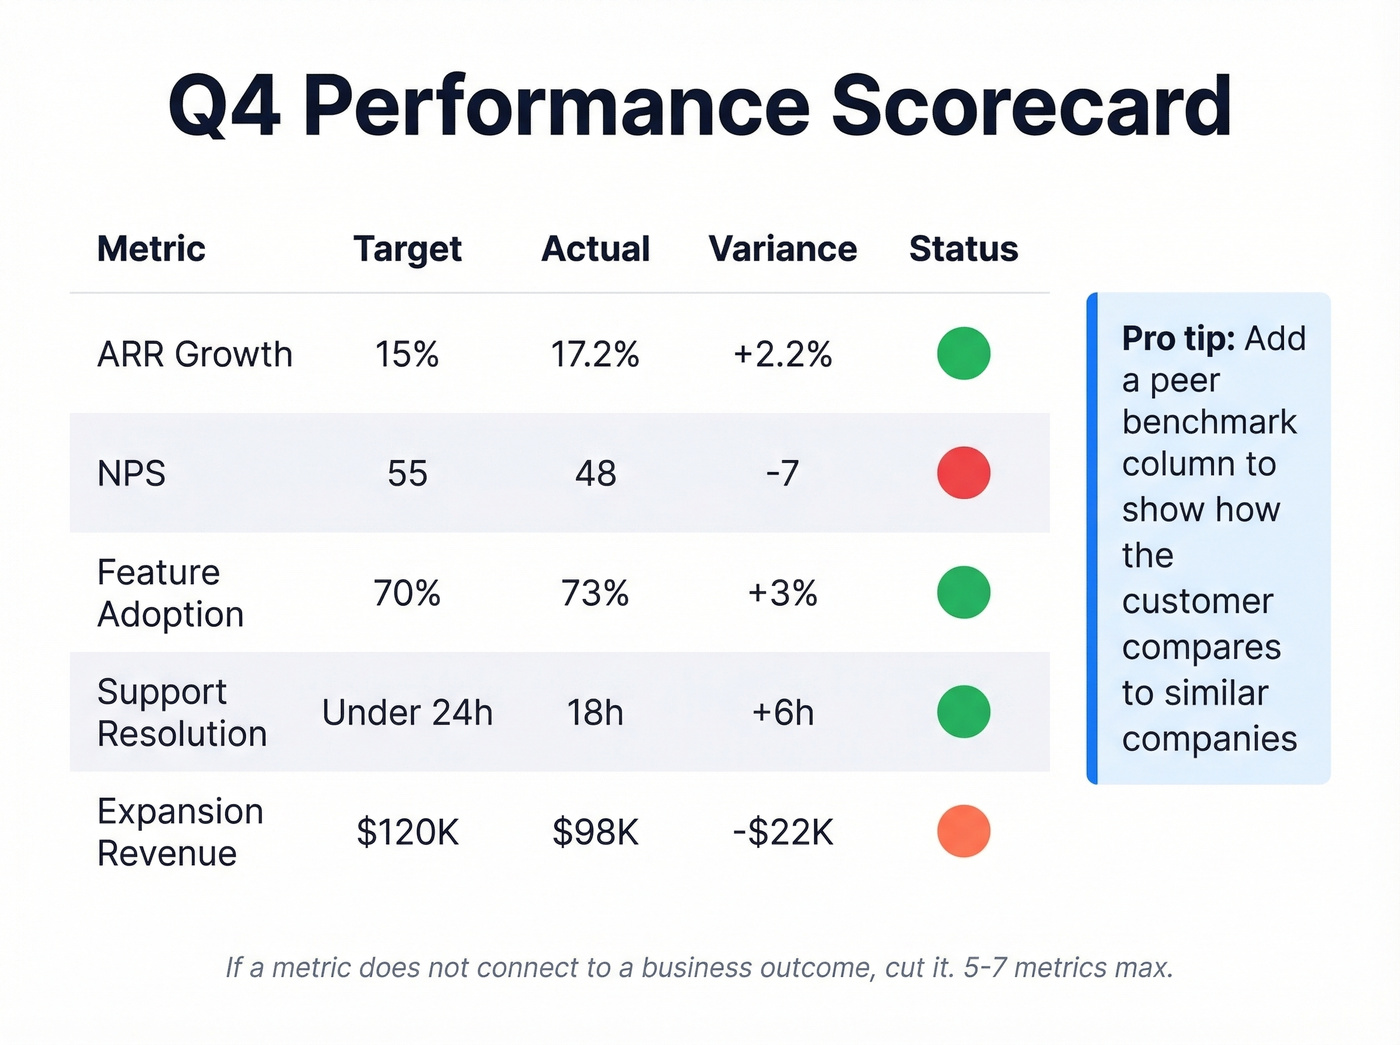
| Metric | Target | Actual | Variance | Status |
|---|---|---|---|---|
| ARR growth | 15% | 17.2% | +2.2% | 🟢 |
| NPS | 55 | 48 | -7 | 🔴 |
| Feature adoption | 70% | 73% | +3% | 🟢 |
| Support resolution | <24h | 18h | +6h | 🟢 |
| Expansion revenue | $120K | $98K | -$22K | 🟡 |
The scorecard isn't a dashboard - it's a conversation starter. Including 15+ metrics because every team wants representation is the fastest way to ensure nobody reads any of them.
Slide 3: What Worked
Structure this as: result (quantified) -> driver -> insight -> implication. Don't just celebrate wins - explain why they happened so the audience can replicate them.
Filled-in example:
Referral revenue up 47% ($340K -> $500K). Driver: simplified referral process from 5 steps to 2. Insight: friction reduction had 3x the impact of incentive increases. Implication: apply friction analysis to onboarding flow next quarter.
"Revenue was up" isn't an insight. "Revenue was up because we reduced friction in the referral flow" is. The difference between those two sentences is the difference between a deck that gets forwarded to the CEO and one that gets archived.
Slide 4: What Didn't Work
Lead with the miss everyone already knows about. Nothing kills credibility faster than burying bad news on slide 12. Same structure as Slide 3, but with accountability: miss (quantified) -> root cause -> action -> expected improvement timeline.
Filled-in example:
Enterprise pipeline down 18% ($2.1M -> $1.7M). Root cause: average deal cycle extended from 62 to 87 days after procurement added a new security review step. Action: pre-build security documentation package for enterprise prospects. Expected improvement: cycle time back to 70 days by end of Q2.
Writing "market conditions" as a root cause is not analysis. It's a shrug. Executives see through it immediately, and it kills credibility for the rest of the deck.
Slide 5: "So What?" Insights
This is the slide that separates a status report from a strategic conversation. Most quarterly review decks jump from "what happened" to "what's next" without the connective tissue. The "so what" is where executives actually lean in. (If you want a more rigorous way to turn signals into actions, borrow from data-driven selling.)
| Observation | Implication |
|---|---|
| Enterprise deals taking 40% longer to close | Revisit sales process and pre-qualification criteria |
| Mid-market churn concentrated in accounts with <3 active users | Trigger CSM intervention at 2 users |
| Referral-sourced customers retain 22% longer | Shift Q2 budget toward referral incentives over paid acquisition |
Skip this slide at your peril. It's the one executives remember when they're deciding whether to attend next quarter's review.
Slide 6: Next-Quarter Priorities
Three to five priorities max. Each one tied to an insight from the previous slides, with an owner and a success metric. If you can't name an owner, it's not a priority - it's a wish. (If you need a clean way to define owners and operating cadence, this RevOps Manager guide is a good reference point.)
Filled-in example:
Priority 1: Reduce enterprise deal cycle to 70 days. Owner: VP Sales. Success metric: avg cycle time in CRM. Priority 2: Launch referral budget expansion. Owner: Marketing. Success metric: $150K referral revenue in Q2. Priority 3: Deploy CSM intervention at 2-user threshold. Owner: CS Ops. Success metric: mid-market churn below 5%.
Listing eight priorities isn't a plan; it's a to-do list. Force-rank and cut.
Slide 7: The Ask
Most QBR decks end with "Any questions?" That's a waste of the most valuable moment in the meeting. The room is full, the context is fresh, and you're handing the floor back with zero direction.
End with a specific decision or approval request instead.
Filled-in example:
We're requesting approval for a $50K incremental referral budget in Q2 and executive sponsorship for the security documentation initiative. Decision needed by March 15.
"We'd love your support" isn't an ask. "We need $50K approved by March 15" is.
Slide 8: Appendix
Everything that didn't make the cut goes here. Never present it - it exists so you can say "that's on slide 14 in the appendix" instead of cramming it into the main deck. Typical contents: detailed NPS breakdown by segment, full support ticket log, competitive win/loss analysis, ad hoc reports requested by individual stakeholders.
Adapting the Framework by Context
The 8-slide structure is universal, but the content shifts depending on your business model.
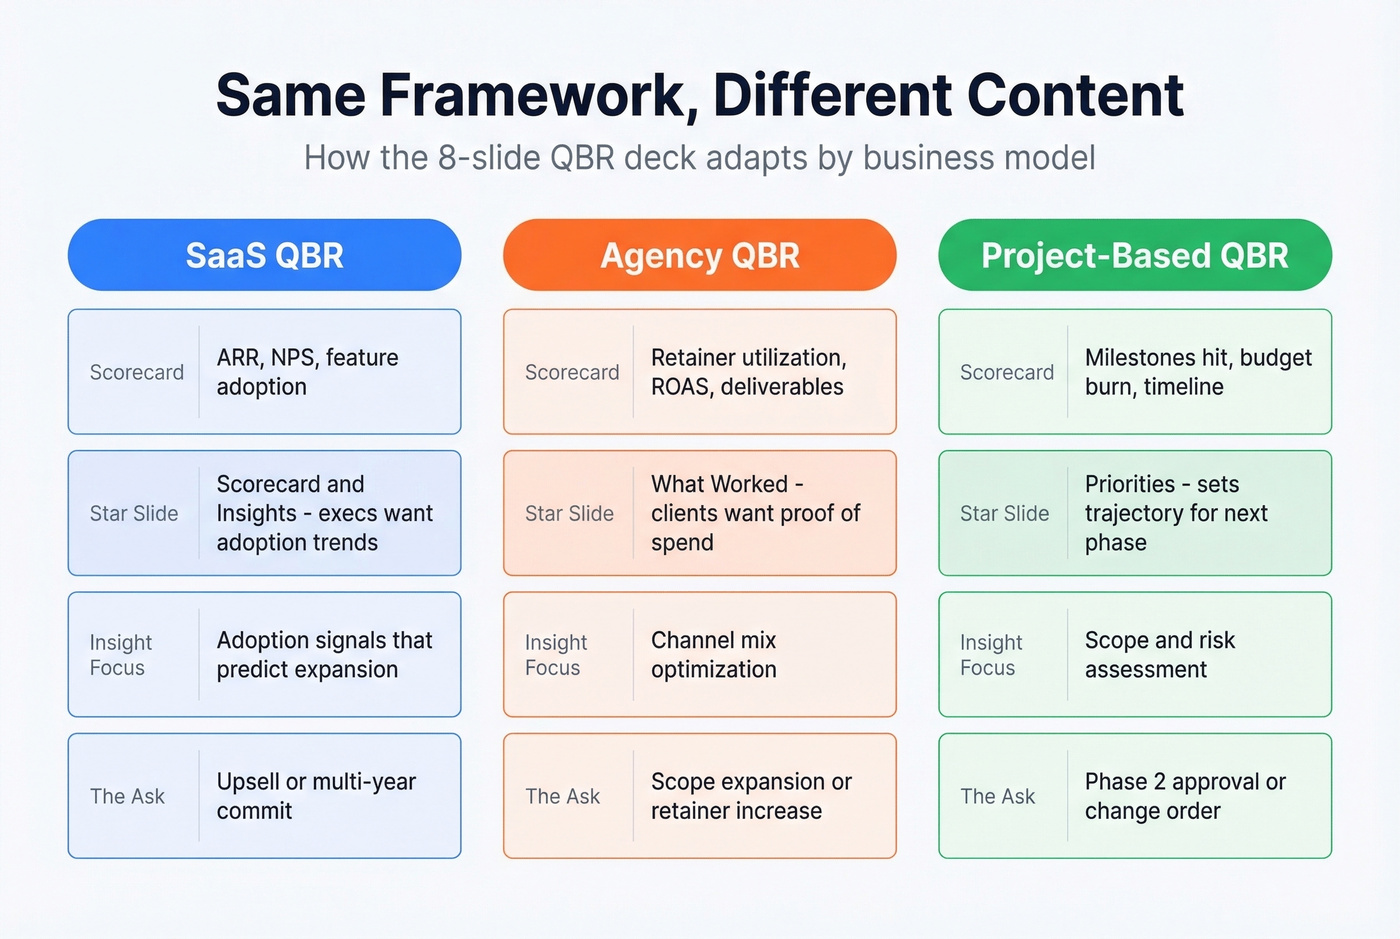
| Slide | SaaS QBR | Agency/Services QBR | Project-Based QBR |
|---|---|---|---|
| Scorecard | ARR, NPS, feature adoption | Retainer utilization, ROAS, deliverables | Milestones hit, budget burn, timeline |
| What Worked | Product usage wins | Campaign performance | Completed phases |
| Insights | Adoption -> expansion signals | Channel mix optimization | Scope/risk assessment |
| The Ask | Upsell or multi-year commit | Scope expansion or retainer increase | Phase 2 approval or change order |
For SaaS reviews, the scorecard and insights slides carry the most weight - executives want adoption trends that justify renewal. For agency reviews, "What Worked" is your star because clients want proof their spend is performing. Project-based reviews lean hardest on the priorities slide because it sets the trajectory for the next phase.
Match Your Deck to the Customer Lifecycle
Not every quarterly review carries the same weight. The emphasis shifts depending on where the customer sits in their journey, and teams running consistent QBRs maintain net retention 15-20 points higher than reactive teams - but only if the content matches the moment. (If you want to quantify the renewal side, use this renewal rate breakdown.)
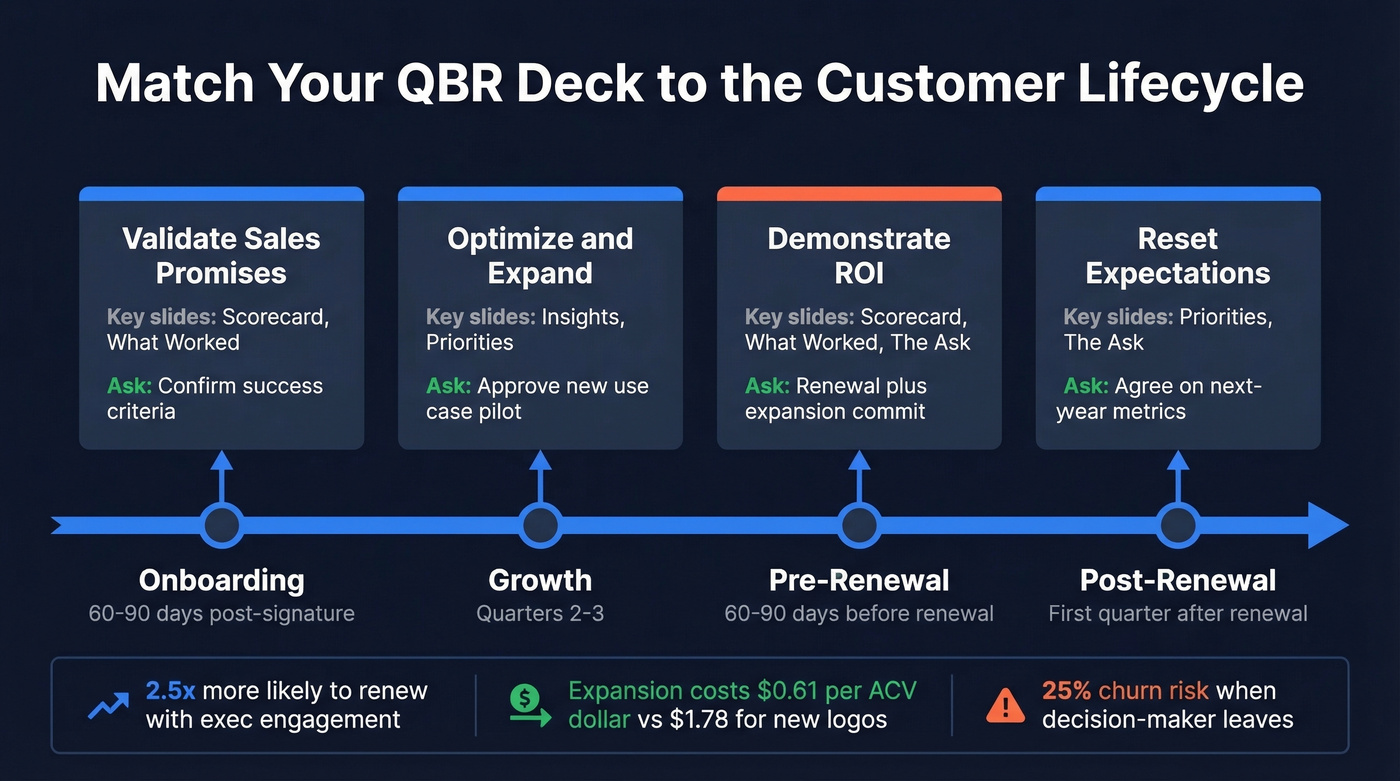
| Lifecycle Stage | Timing | Deck Emphasis | Key Slides | Example Ask |
|---|---|---|---|---|
| Onboarding | 60-90 days post-signature | Sales promise validation | Scorecard, What Worked | Confirm success criteria |
| Growth | Quarters 2-3 | Optimization + expansion | Insights, Priorities | Approve new use case pilot |
| Pre-Renewal | 60-90 days before renewal | ROI demonstration | Scorecard, What Worked, The Ask | Renewal + expansion commit |
| Post-Renewal | First quarter after renewal | Reset expectations | Priorities, The Ask | Agree on next-year metrics |
The pre-renewal QBR deserves special attention. Only 1 in 26 unhappy customers actually complain before churning. By the time you hear about dissatisfaction, it's usually too late. And here's the stat that should keep every CSM up at night: churn jumps to 25% when the decision-maker leaves the account, compared to just 8% when they stay. Your pre-renewal deck needs to surface both product concerns and stakeholder changes. If your champion's job title changed three months ago and nobody noticed, your scorecard is built on fiction. (If you need a framework for diagnosing churn drivers, see churn analysis.)
The economics reinforce why this matters: expansion costs $0.61 per ACV dollar vs $1.78 for new customer acquisition. A strong pre-renewal QBR doesn't just prevent churn - it's the cheapest pipeline you'll ever build.
That scorecard slide falls apart when your CRM is full of stale contacts. Prospeo's enrichment fills in 50+ data points per record with a 92% match rate - refreshed every 7 days, not every 6 weeks like competitors.
Clean data makes your QBR numbers credible. Start enriching for $0.01 per email.
QBR Metrics Cheat Sheet
The scorecard slide needs the right metrics. Here's a cheat sheet organized by category, with benchmark estimates by segment. (If you want a broader KPI map, use these funnel metrics as a starting point.)
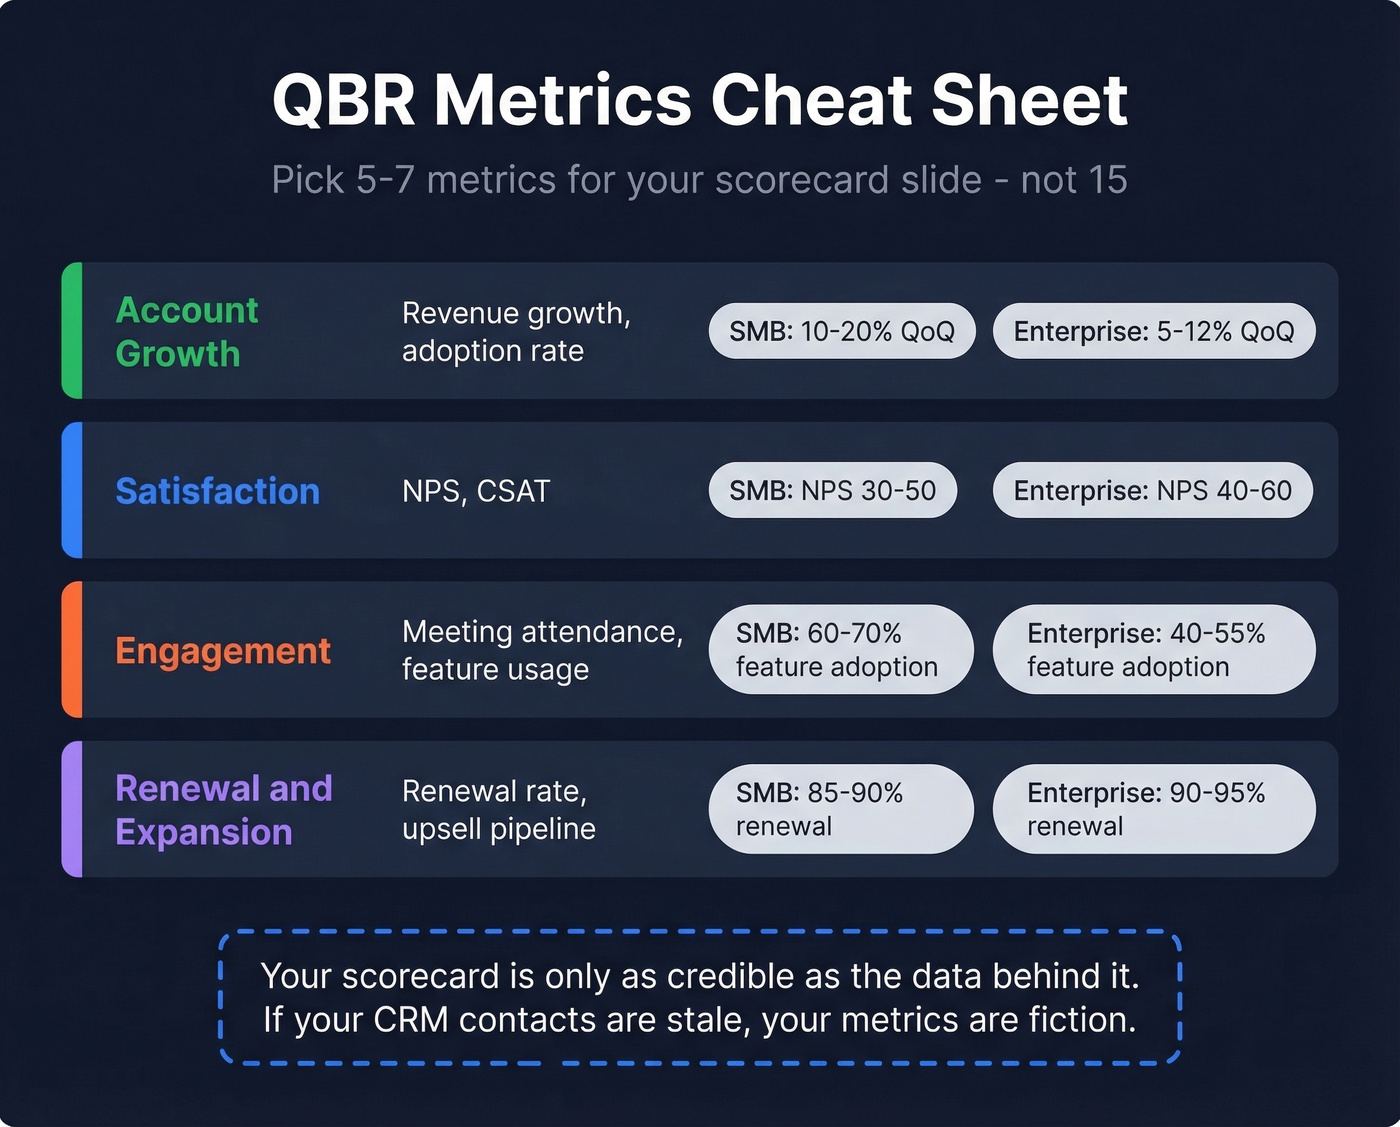
| Category | Example Metrics | SMB Benchmark | Enterprise Benchmark |
|---|---|---|---|
| Account growth | Revenue growth, adoption rate | 10-20% QoQ growth | 5-12% QoQ growth |
| Satisfaction | NPS, CSAT | NPS 30-50 | NPS 40-60 |
| Engagement | Meeting attendance, feature usage | 60-70% feature adoption | 40-55% feature adoption |
| Renewal/expansion | Renewal rate, upsell pipeline | 85-90% renewal | 90-95% renewal |
| Project performance | Completion rate, on-time delivery | 75-85% on-time | 80-90% on-time |
These benchmarks shift by vertical and product maturity. The point isn't to hit a universal number - it's to have a target on the scorecard so the variance column actually means something.
Pick five to seven metrics total. One or two from each category that matters most to your customer's stated goals. If the customer cares about adoption, load up on engagement metrics. If they care about ROI, lean into account growth and renewal signals.
5 Mistakes That Kill Executive Attention
These come straight from practitioner discussions on r/CustomerSuccess - and we've seen every one of them in the wild.
Too many ad hoc reports crammed in. Move them to the appendix. If someone asks, you've got it. If they don't, you saved five minutes of everyone's time.
Rebuilding from scratch every quarter. Standardize on a template. The 8-slide structure above works. Use it every time and only update the content - the thinking time is what matters, not the formatting time.
Manual screenshot-to-Excel-to-PowerPoint workflow. Automate data pulls where possible. The hours teams spend on prep are mostly wasted on formatting, not analysis.
Decks that run 20+ slides. Eight slides for executives. Period. If you need more, you're presenting to the wrong audience or haven't done the filtering work.
No stated objectives for the meeting. Write the purpose on slide 1 and use it to push back on scope creep. "This meeting is about renewal readiness" gives you permission to say "let's take that offline."
Build a Sample QBR Deck in Under an Hour
The multi-hour prep cycle is a symptom of bad infrastructure, not a necessary evil. Three steps fix it.
Step 1: Clean your data. Your scorecard falls apart when the CRM says your champion is still "Director of Marketing" but she got promoted to VP six months ago. Run your account contacts through Prospeo's CRM enrichment - 83% match rate, 50+ data points per contact, refreshed every 7 days. At roughly $0.01 per email with a free tier of 75 emails per month, stale job titles and bounced addresses have no excuse. Accurate stakeholder data is the difference between a deck that lands and one that misses the room entirely. (If you’re comparing vendors, start with these data enrichment services.)

Step 2: Use a template. Don't start from a blank slide. Grab one of the free templates below, map it to the 8-slide structure, and reuse it every quarter. The structure stays the same - only the numbers and insights change.
Step 3: Fill slides with the framework. For each slide, use the structure from the walkthrough above. If you're stuck on the insights slide, try this AI prompt: "Given these three metrics [paste scorecard], what are the two most important implications for next quarter?" It won't replace your judgment, but it'll break writer's block in 30 seconds. Within an hour you'll have a presentation that's tighter and more persuasive than most teams produce in a full day.
Your 'What Didn't Work' slide keeps blaming pipeline gaps, but the real root cause is bad prospect data. Prospeo gives you 300M+ verified profiles with 98% email accuracy so your pipeline numbers actually hold up in the next QBR.
Stop presenting pipeline misses caused by bad data. Fix the source.
Best Free QBR Templates
Not every template is actually free. Here's what we found after testing the download flows.
| Template Source | Slides | Format | Truly Free? | Best For |
|---|---|---|---|---|
| SlidesCarnival | 17 | PPT, Google Slides, Canva | Yes, no signup | Design-forward decks |
| Smartsheet | Multiple (exec, sales, supplier) | PPT, Excel, Word | Yes, free download | Structural variety |
| Beautiful.ai | Varies | Web-based | 14-day trial, ~$12/mo after | Polished visuals |
| SlideBazaar | 6 | PPT, Google Slides | Login required - skip it | Not worth the hassle |
| WinningPresentations | Full deck + guidance | PPT | Paid (~$39) | Filled-in content examples |
SlidesCarnival and Smartsheet are the two best genuinely free options with no annoying hoops. SlidesCarnival wins on design. Smartsheet wins on variety - they've got exec, sales, supplier, and small business versions. Start with one of those and customize using the 8-slide framework above.
FAQ
How many slides should a QBR deck have?
Eight for executive audiences, twelve to fifteen max for operational reviews. Anything over fifteen belongs in an appendix. The goal is decisions per minute, not slide count.
What's the difference between a QBR and an EBR?
QBRs are quarterly and tactical - adoption metrics, support trends, and near-term roadblocks with day-to-day stakeholders. EBRs happen once or twice a year with C-suite executives, focused on long-term strategic alignment and partnership vision.
How often should you run QBRs?
Quarterly is standard for mid-market and enterprise accounts. Consistent quarterly reviews correlate with 15-20 points higher net retention. For accounts under $25K ACV, biannual reviews often work fine - supplement with async Loom updates in between.
What metrics belong in a QBR scorecard?
Five to seven metrics across account growth, satisfaction, engagement, and renewal signals. Always show a target and variance column - a scorecard without baselines is just a list of numbers with no actionable meaning.
How do you keep QBR data accurate?
Automate CRM enrichment so job titles, emails, and phone numbers stay current. Prospeo refreshes contact data every 7 days with an 83% match rate and 50+ data points per record, ensuring your stakeholder map reflects reality rather than six-month-old snapshots.