Revenue Optimization: Framework, Benchmarks, and Tactics That Work
A RevOps lead we know ran a full-quarter revenue audit last year. The finding that stung most wasn't a pricing problem or a churn spike - it was that 40% of their "high-intent" leads had stale email addresses, so every downstream optimization they'd built was running on garbage inputs. Revenue optimization isn't a strategy problem for most teams. It's a data problem wearing a strategy costume.
The Short Version
Maximizing revenue across the customer lifecycle requires a system spanning acquisition, retention, expansion, and pricing - not a single tactic.
The biggest unlock for most SaaS companies right now is shifting more investment from net-new acquisition to expansion: expansion ARR now represents 40% of total new ARR at the median SaaS company, and over 50% at companies above $50M. Start by fixing your data, then run structured experiments on each lever.
What Revenue Optimization Actually Means
Revenue optimization is the practice of maximizing income across the entire customer lifecycle without sacrificing customer satisfaction or long-term financial health. It touches pricing, demand, cost structures, margin, and customer behavior - every variable that determines how much money flows through your business and how much of it you keep. The global revenue management market alone hit $22B in 2024, and the broader optimization discipline encompasses it.
People confuse three related terms constantly.
| Term | Scope | Typical Industries |
|---|---|---|
| Yield Management | Fixed inventory | Hotels, airlines |
| Revenue Management | Right product, right customer, right time | Hospitality, media |
| Revenue Optimization | Full lifecycle: pricing, acquisition, retention, expansion, product, cost efficiency | SaaS, ecommerce, B2B |
Yield management is the narrowest - squeezing maximum revenue from a fixed number of hotel rooms or airline seats. Revenue management broadens that to include customer targeting and timing. The optimization lens is the widest: it spans pricing, acquisition, retention, and product development across every stage of the customer relationship, while also accounting for cost efficiency and bottom-line outcomes.
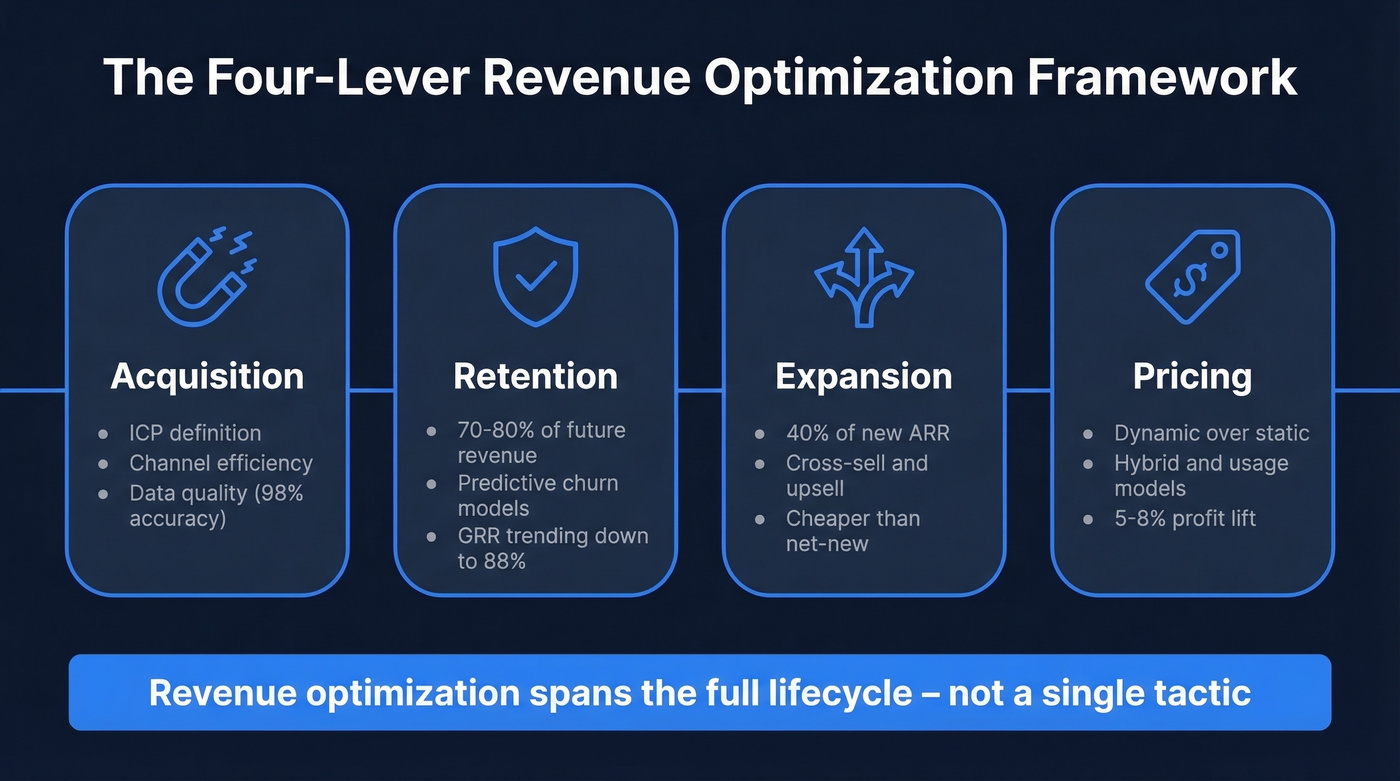
For SaaS and B2B teams, the four levers that matter most are acquisition, retention, expansion, and pricing. Most tactics, tools, and experiments you'll run fall into one of these buckets.
2026 SaaS Benchmarks
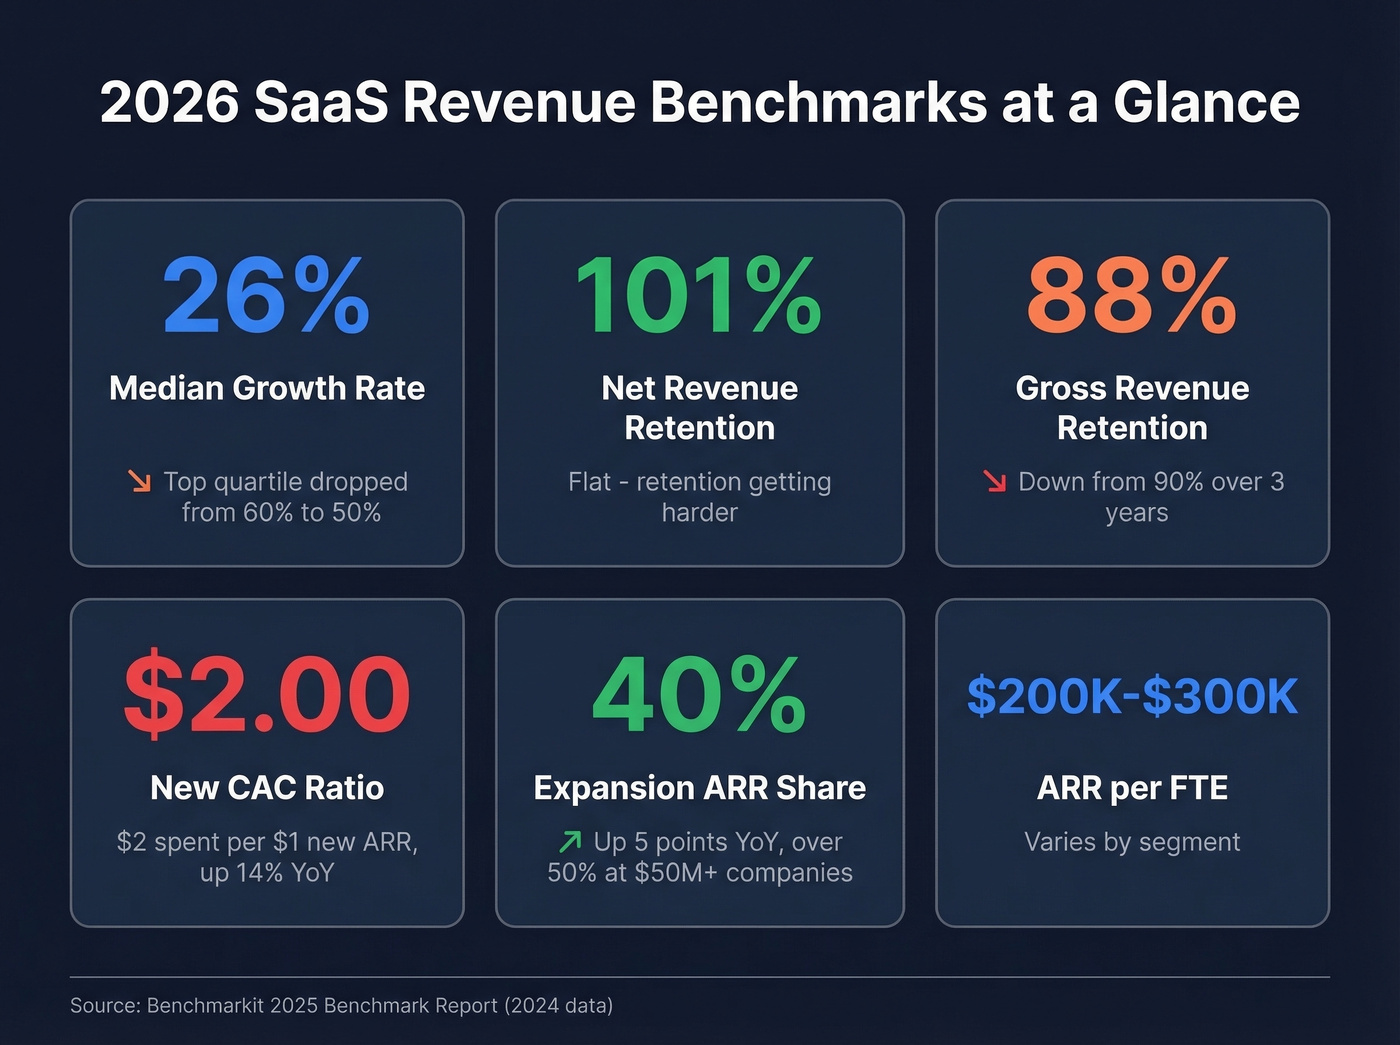
Numbers ground the conversation. Here's where SaaS companies actually sit, per Benchmarkit's benchmark report covering 2024 data:
| Metric | Latest Median | Trend |
|---|---|---|
| Growth Rate | 26% | Top quartile down from 60% to 50% |
| NRR | 101% | Flat - retention harder |
| GRR | 88% | Down from 90% over 3 years |
| New CAC Ratio | $2.00 per $1 ARR | Up 14% YoY |
| Expansion ARR % | 40% of new ARR | +5pp YoY |
| ARR per FTE | $200K-$300K | Varies by segment |
Two things jump out. Acquisition is getting more expensive - a $2.00 CAC ratio means you're spending two dollars in sales and marketing for every dollar of new ARR. Fourth-quartile companies sit at $2.82. That's brutal math for anyone without deep pockets.
Expansion is quietly becoming the growth engine. At companies above $50M ARR, expansion represents more than half of all new ARR. We've watched teams pour 80% of their budget into net-new acquisition while sitting on an existing customer base that's begging for attention. If that's you, you're fighting the most expensive battle on the field.
Here's the thing: if your average deal size is under five figures, you probably don't need a $100K+ revenue intelligence platform. You need clean data, a structured experimentation habit, and a relentless focus on expansion. The fancy tooling can wait.
The Four-Lever Framework
Acquisition
Acquisition optimization starts with ICP definition and channel efficiency, but the foundation is data quality. Aligned RevOps companies grow 12-15% faster, and proper implementation yields 100-200% increases in digital marketing ROI. The catch: lead scoring models miss 40% of high-intent prospects when enrichment data is stale.
In B2B contact data, a six-week refresh cycle is the industry average. When your contact database runs on that cadence, you're scoring ghosts. Prospeo's 7-day refresh cycle closes this gap - 98% email accuracy means your scoring models actually reflect reality, and your SDRs reach real humans instead of bouncing into the void.
Retention
Existing accounts represent 70-80% of future revenue potential, and the compounding effect on customer lifetime value makes retention the highest-leverage play. Predictive churn models drive 25% reductions in churn when implemented well. But GRR has declined from 90% to 88% over three years.
For a $20M ARR company, that two-point drop is $400K in additional annual leakage from the existing base - money that walked out the door before your expansion team got a chance. More than half of revenue decision-makers now prioritize retention and expansion into new markets, and we think the other half is behind the curve.
Expansion
Expansion ARR at 40% of total new ARR isn't a trend. It's the new normal.
Cross-sell, upsell, and seat expansion are cheaper motions than net-new acquisition, and they compound on existing trust. If you need a clean way to frame the motion internally, use upsell vs cross-sell language so CS, Sales, and Product are aligned. Post-purchase optimization is an emerging lever, but practitioner skepticism is healthy - people want clean A/B tests before committing budget. That's the right instinct. Run structured experiments rather than bolting on a tool and hoping for lift.
Pricing
Static pricing is one of the most common revenue killers. Dynamic pricing lifts profit 5-8% on average. Amazon updates prices 2.5 million times daily and attributes a 25% revenue increase to the practice.
The broader shift in 2026 is toward hybrid, consumption, and outcome-based models - especially for AI-embedded products. A High Alpha survey of 800+ respondents found this accelerating as companies try to align price with the value AI actually delivers. If you're still reviewing pricing once a year during planning season, you're leaving money on the table every single quarter.
You just read that lead scoring models miss 40% of high-intent prospects when enrichment data goes stale. Prospeo refreshes every record on a 7-day cycle - not the 6-week industry average - with 98% email accuracy and a 92% API match rate. Stop optimizing revenue on top of garbage inputs.
Fix the data layer and every downstream revenue lever compounds.
Quick Wins That Moved Revenue
These are all from a Shopify practitioner on Reddit who shared actual numbers - no new tools, no bigger budget required.
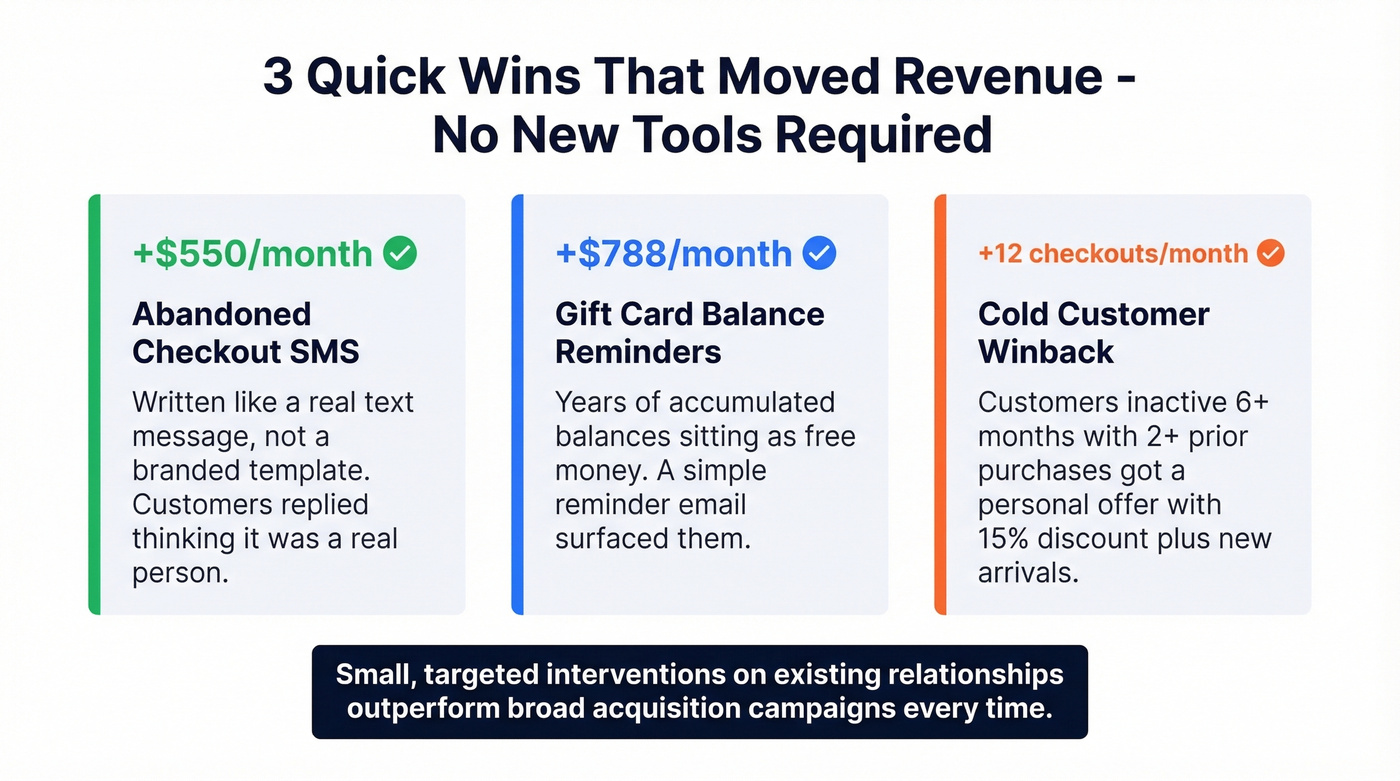
Abandoned checkout SMS written like a real text - not a branded template, but something like "Any questions I can help with?" Generated ~$550 in additional revenue last month. Customers replied thinking it was a real person, which is exactly why it worked.
Gift card balance reminder emails unlocked $788 last month. Years of accumulated gift card balances were sitting there as free money. A simple reminder app surfaced them.
Cold customer winback segmentation - customers inactive 6+ months with 2+ prior purchases got a "we miss you" offer with a 15% code plus new arrivals. Result: ~12 additional checkouts per month.
Small, targeted interventions on existing relationships outperform broad acquisition campaigns dollar-for-dollar. Every time.
Running Optimization Experiments
The difference between teams that optimize revenue and teams that talk about it is a structured experimentation loop. Here's the eight-step process:
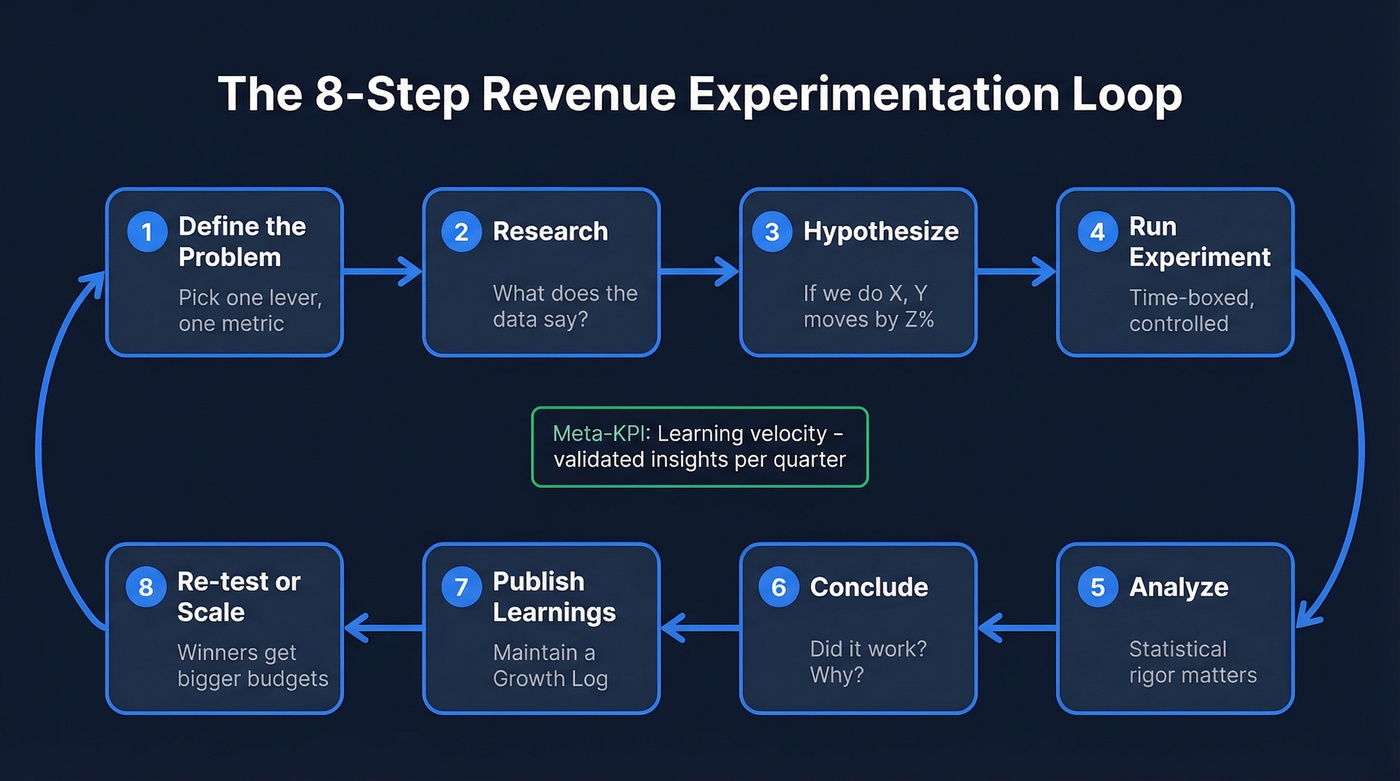
- Define the problem - pick one lever, one metric
- Research - what does the data say? What have others tested?
- Hypothesize - "If we do X, metric Y will move by Z%"
- Run the experiment - time-boxed, controlled
- Analyze - statistical rigor matters; Bayesian testing works well for smaller sample sizes
- Conclude - did it work? Why or why not?
- Publish learnings - maintain a Growth Log so institutional knowledge compounds
- Re-test or scale - winners get bigger budgets; losers get documented
Use AARRR as your organizing compass: Acquisition, Activation, Retention, Revenue, Referral. The meta-KPI to track is learning velocity - validated insights per quarter. A team running 15 experiments per quarter and documenting every result will crush a team that ships one big initiative and prays. If you want a tighter measurement layer, map each test to funnel metrics so you can compare across levers.
Costly Mistakes to Avoid
These aren't theoretical. Each one has a quantified cost.
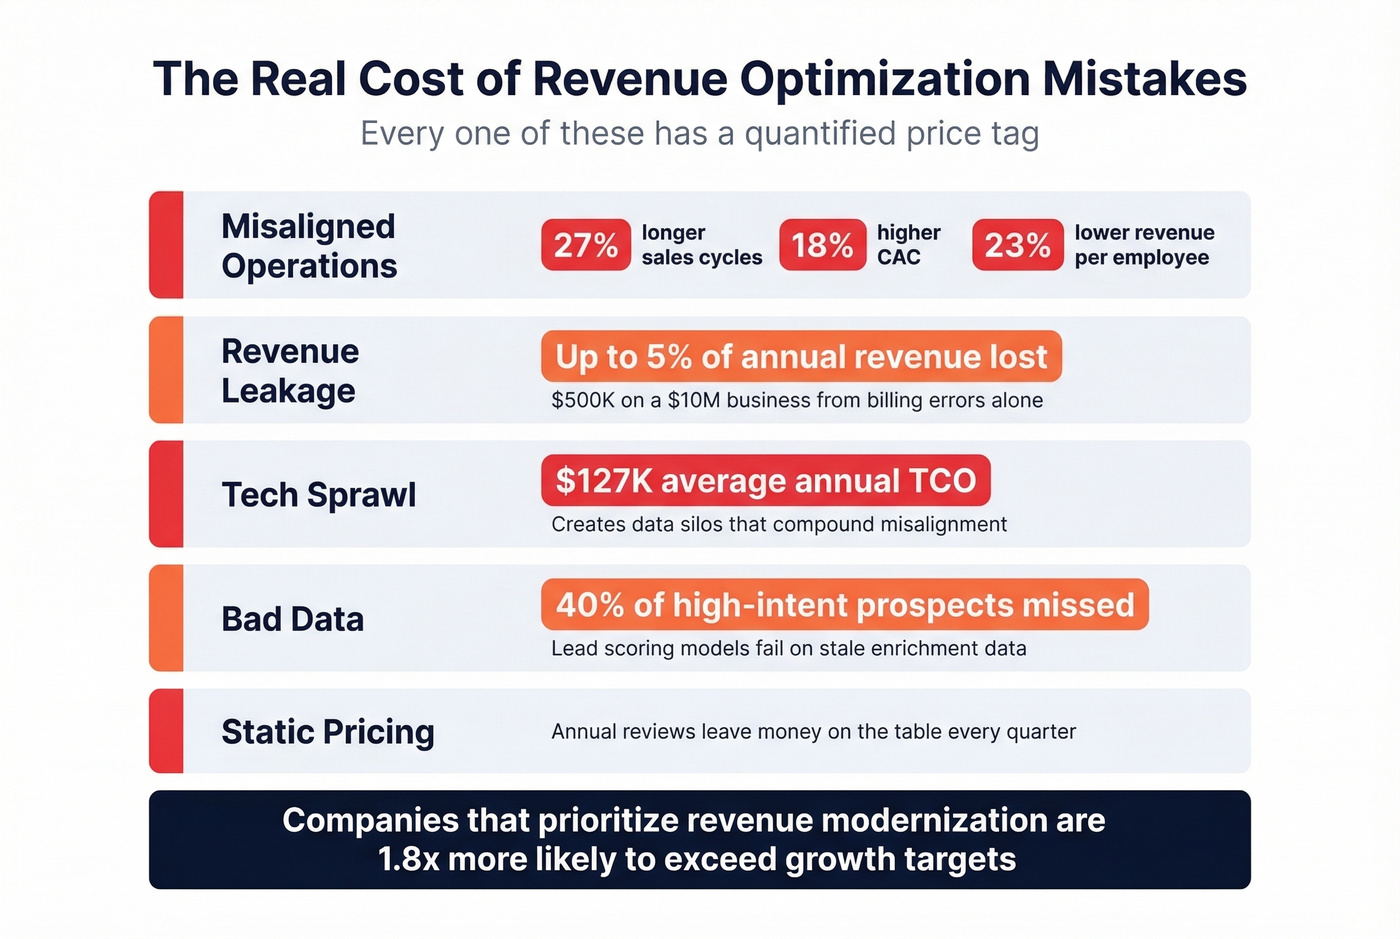
Misaligned operations correlate with 27% longer sales cycles, 18% higher CAC, and 23% lower revenue per employee. Attribution complexity alone delays optimization 2-3 weeks and increases reporting time by 40%. When marketing, sales, and CS aren't sharing data and goals, every motion gets more expensive.
Revenue leakage from billing and payout errors costs firms up to 5% of annual revenue. On a $10M business, that's $500K walking out the door through preventable mistakes.
Tech sprawl adds ~$127K in annual TCO on average. Stacks that don't integrate create data silos, which feed the misalignment problem. It compounds fast.
Bad data means lead scoring models miss 40% of high-intent prospects. Your SDRs are calling the wrong people. Your sequences are bouncing. Every optimization downstream is compromised. If you're diagnosing the root cause, start with churn analysis and data hygiene in parallel so you don't misattribute symptoms.
Static pricing in a dynamic market. Independent hotels learned this the hard way - even one day of mispriced inventory tanks a promotion. SaaS companies make the same mistake by reviewing pricing annually instead of continuously.
Sales reps spending less than 30% of their time selling. That's 70% of your most expensive headcount doing work a system should handle.
We've seen teams compound three or four of these mistakes simultaneously for entire quarters before catching them. Firms that prioritize revenue modernization are 1.8x more likely to exceed growth targets. The cost of inaction isn't zero - it's compounding.
AI's Role in 2026
AI is the current dividing line between fast-growing companies and everyone else. Products with AI deeply embedded grow ~2x as fast as those treating AI as a supporting feature. In the $1-$5M ARR cohort, AI differentiation drives ~70% faster growth.
The operational impact is just as stark. AI automation saves reps 2 hours and 15 minutes per day on average. Clari reduces manual data entry by 80% through automated capture and sync. That's the difference between reps spending 30% of their time selling and 60%. If you're building the stack, prioritize data-driven selling workflows before adding more tools.
Let's be honest about the gap: AI is core to 100% of products for companies founded in 2025. For companies founded a decade earlier, that number is essentially zero. The gap is widening, and it shows up directly in revenue growth rates.
Tools and Costs
| Category | Tool | Starting Price |
|---|---|---|
| Data Quality | Prospeo | Free tier; ~$0.01/email |
| CRM / RevOps | HubSpot Ops Hub | $20/mo - $2,000/mo |
| CRM / RevOps | Salesforce Revenue Cloud | $75/user/mo (CPQ); $150-300+/user/mo (full) |
| Revenue Intel | Clari | ~$50-100/user/mo |
| Revenue Intel | Gong | ~$100-150/user/mo |
| Customer Success | Vitally | ~$150/mo |
| Customer Success | Gainsight | Custom; typically $2,500-$10,000+/mo |
Many revenue intelligence platforms start at $30K/year before implementation, training, and scope creep. The right stack depends on your stage. A Series A company doesn't need Gong at $50K+/year. But every company, at every stage, needs clean data feeding its CRM and RevOps tools - that's the non-negotiable foundation, and it's why data quality sits at the top of the table. If you're evaluating vendors, start with data enrichment services and work outward.
Skip the enterprise platforms if you're under $5M ARR. You'll spend more time configuring dashboards than actually optimizing anything. If you're still tightening outbound fundamentals, a lightweight set of SDR tools can outperform a bloated stack.
Expansion drives 40% of new ARR, but you can't upsell contacts who've changed roles or companies. Prospeo tracks job changes across 300M+ profiles and returns 50+ data points per enrichment - so your expansion plays hit real buyers, not last quarter's org chart.
Reach the right people in your existing accounts for $0.01 per email.
FAQ
What's the difference between revenue optimization and revenue management?
Revenue management focuses on selling the right product to the right customer at the right time - most common in fixed-inventory industries like hospitality and airlines. Revenue optimization is broader, spanning pricing, acquisition, retention, expansion, and product development across the entire customer lifecycle. Think of management as one component within the larger optimization system.
What KPIs should I track?
Start with net revenue retention (NRR), gross revenue retention (GRR), new CAC ratio, expansion ARR as a percentage of total new ARR, and ARR per FTE. Current SaaS medians: NRR 101%, GRR 88%, CAC ratio $2.00, expansion ARR 40%. If your numbers fall below these benchmarks, you've got a clear starting point for where to focus experiments.
How does funnel optimization differ from full-lifecycle optimization?
Funnel optimization zeroes in on conversion rates and drop-off points at each stage of the buyer journey - from first touch through closed-won. Full-lifecycle optimization encompasses the funnel but also includes pricing strategy, cost efficiency, expansion motions, and retention programs that sit outside the traditional funnel model. Most teams benefit from tackling funnel conversion first, then broadening to the complete lifecycle approach.
How do I start with a small team?
Fix your data first - stale contacts undermine every downstream effort. Then pick one lever: expansion is usually the highest-ROI starting point because it builds on existing relationships. Run structured experiments using the AARRR framework and track learning velocity. In our experience, a team of three running ten experiments per quarter will outperform a team of ten running one big initiative.