Sales and Marketing KPIs: Track These, Skip the Rest
It's Monday morning. Marketing's Slack channel is celebrating 500 new MQLs from last week's webinar campaign. Meanwhile, the sales leader is staring at a pipeline report that's down 15% quarter-over-quarter. Both teams hit their numbers. Neither team moved the business forward.
This disconnect isn't rare - it's the default. An Influ2 study of 105 companies found that 53% have a "broken hand-off" where sales contacts fewer than 35% of marketing-engaged prospects. Only 11% achieve both an effective hand-off and high audience overlap between sales and marketing. The leads come in, and nobody follows up. The consensus on r/sales is blunter: marketing's metrics incentivize cheap traffic that produces garbage leads, and sales wastes hours chasing people who don't remember filling out a form.
The fix isn't more metrics. It's fewer, better ones - and making half of them shared.
The Only Metrics That Matter for Revenue Teams
Most KPI guides list 20+ metrics. That's a spreadsheet, not a strategy. You need 8-10 max, with at least half co-owned by sales and marketing. The SMART framework applies - and as NetSuite puts it, "often, less is more."
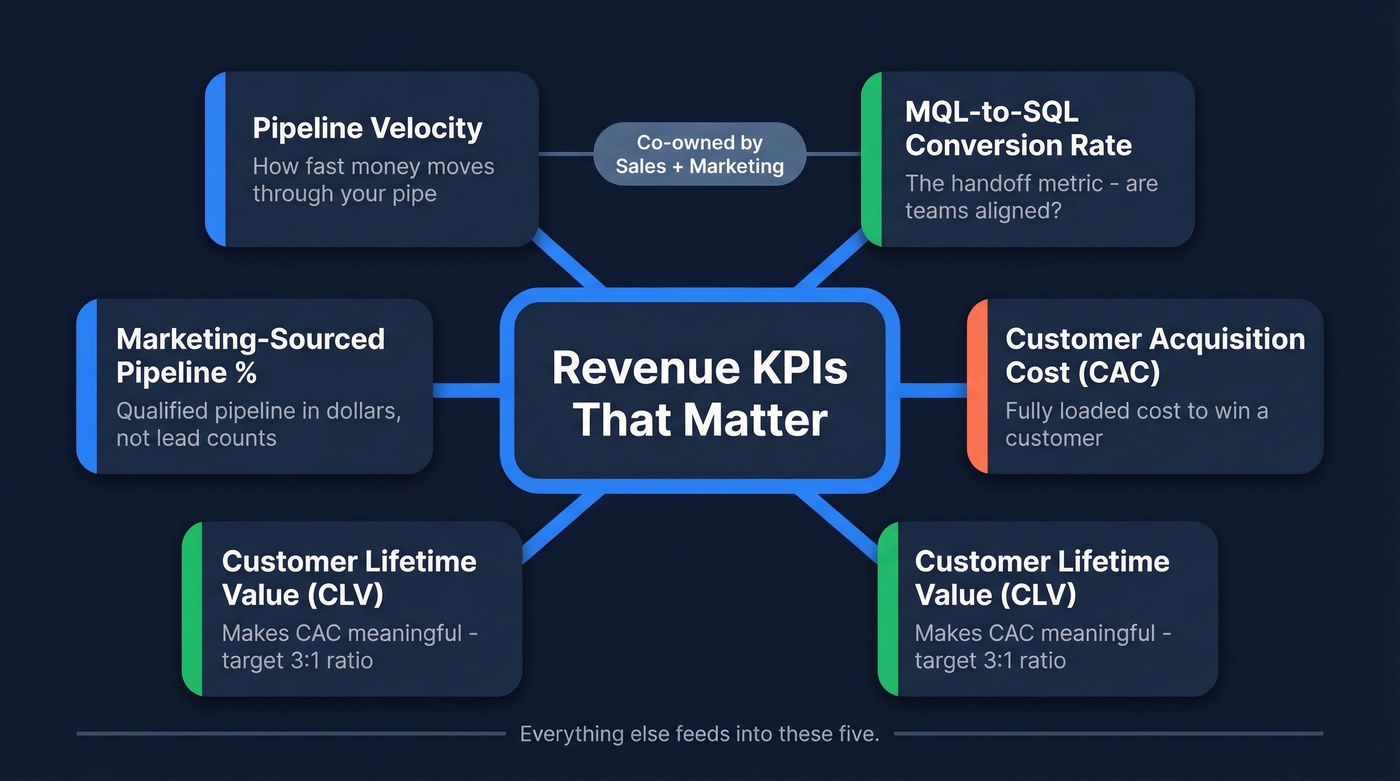
Here are the five shared KPIs every revenue team should start with:
- Pipeline velocity - if you could only track one metric, this is it. It combines deal volume, win rate, deal size, and cycle length into a single number per time period.
- MQL-to-SQL conversion rate - the handoff metric. If this is low, your teams aren't aligned on what "qualified" means.
- Customer acquisition cost (CAC) - what you're actually paying to win a customer, fully loaded.
- Customer lifetime value (CLV) - the counterpart that makes CAC meaningful.
- Marketing-sourced pipeline % - how much qualified pipeline originates from marketing touchpoints, measured in dollars.
Everything else in this article feeds into or supports these five.
Vanity Metrics to Stop Tracking
Before we add KPIs, let's kill a few. The usual suspects - likes, impressions, followers, circulation - mislead when viewed in isolation. High impressions can mean your ads are reaching the wrong audience entirely. A large social following without engagement? Bots and engagement pods.
If you want the deeper argument, read this breakdown of Vanity Metrics and why they persist.
But the real damage comes from metrics that look operational but create perverse incentives. When marketing optimizes for lead volume and low CPL, teams buy cheap display traffic to hit targets. The leads look great in a dashboard. Then sales calls them and nobody picks up. Reddit's r/sales threads are full of reps describing exactly this scenario - "garbage leads" from display campaigns where prospects don't even remember opting in.
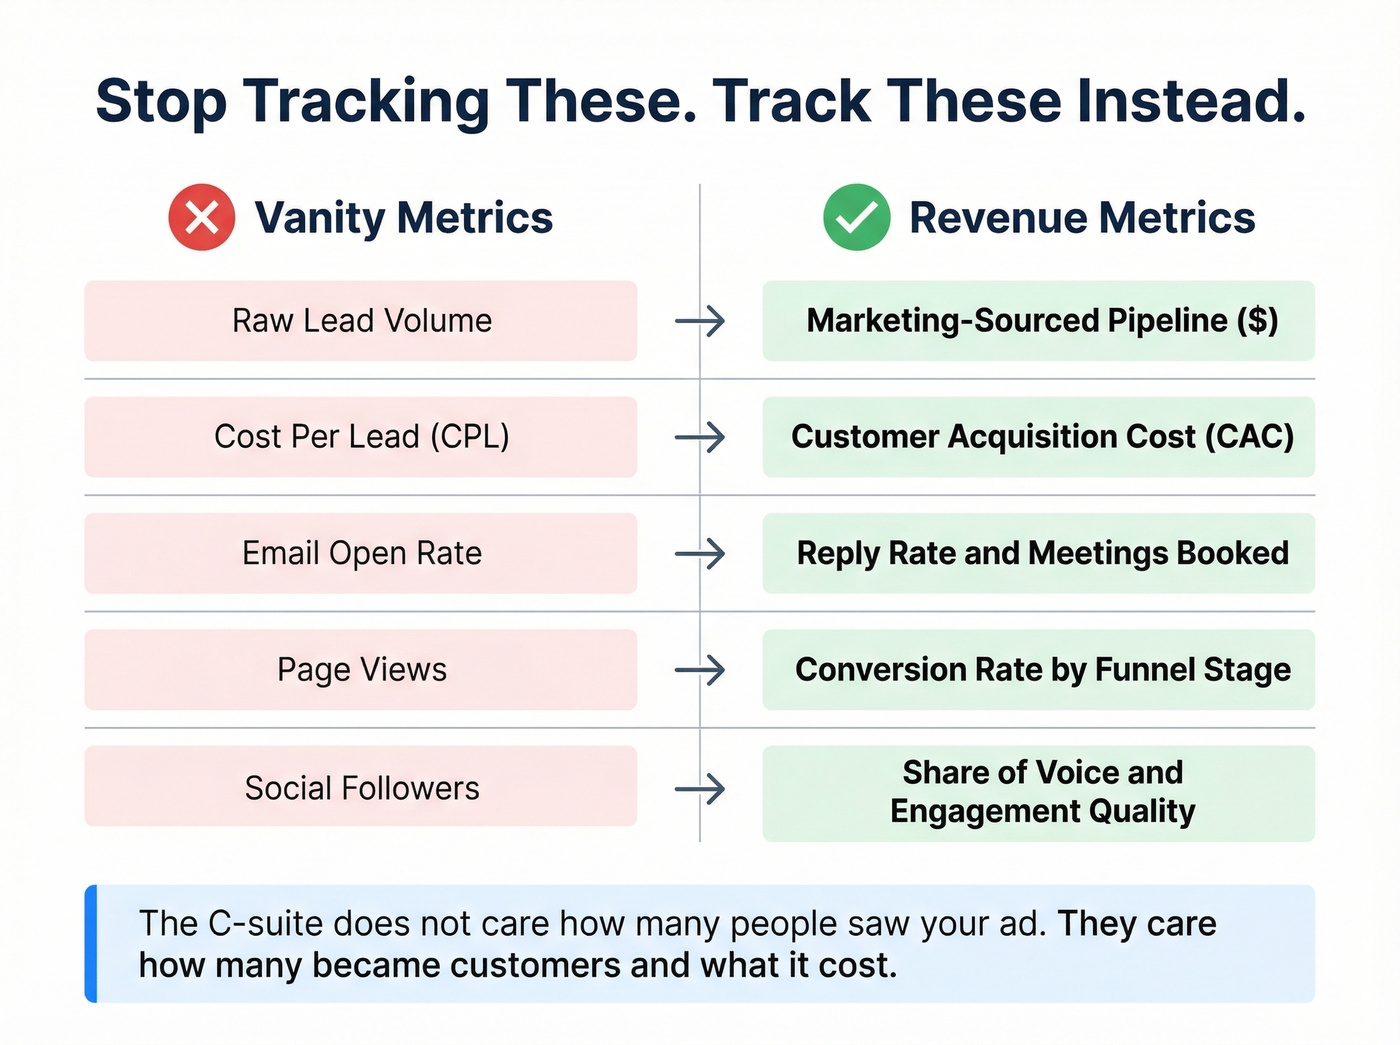
Stop tracking these in isolation. Track these instead:
- Raw lead volume → Marketing-sourced pipeline (in dollars)
- CPL → CAC
- Email opens → Reply rate and meetings booked
- Page views → Conversion rate by funnel stage
- Social followers → Share of Voice and engagement quality
The C-suite doesn't care how many people saw your ad. They care how many became customers and what it cost.
Shared KPIs for Sales and Marketing Alignment
These are the metrics both teams co-own. Building a shared scorecard ensures that when these numbers move, revenue moves. When they don't, finger-pointing starts - and that's when you know the scorecard is working, because at least everyone's arguing about the same number.
MQL-to-SQL Conversion Rate
Formula: (SQLs / MQLs) x 100
The average B2B SaaS MQL-to-SQL conversion rate is 13%. That means 87% of marketing-qualified leads go nowhere. This is the single most overrated metric in B2B when tracked by marketing alone - and the most valuable when co-owned with sales. The r/b2bmarketing community regularly debates whether MQL is even a meaningful concept anymore. It is, but only when both teams agree on the definition.
Here's what "good" looks like by industry:
| Industry | MQL-to-SQL Rate |
|---|---|
| B2B SaaS | 13% |
| eCommerce | 23% |
| Cybersecurity | 15% |
| Fintech | 11% |
| Higher Education | 21% |
| Business Insurance | 26% |
| Construction | 12% |
| HVAC | 26% |
If your rate is well below your industry benchmark, the problem is almost always a qualification gap. Marketing and sales don't agree on what "qualified" means. Joint ownership of this metric with regular reviews to align criteria is non-negotiable - especially if you’re tightening your lead scoring rules.
Pipeline Velocity
Formula (per day): (# Opportunities x Avg Deal Size x Win Rate) / Sales Cycle Length (days)
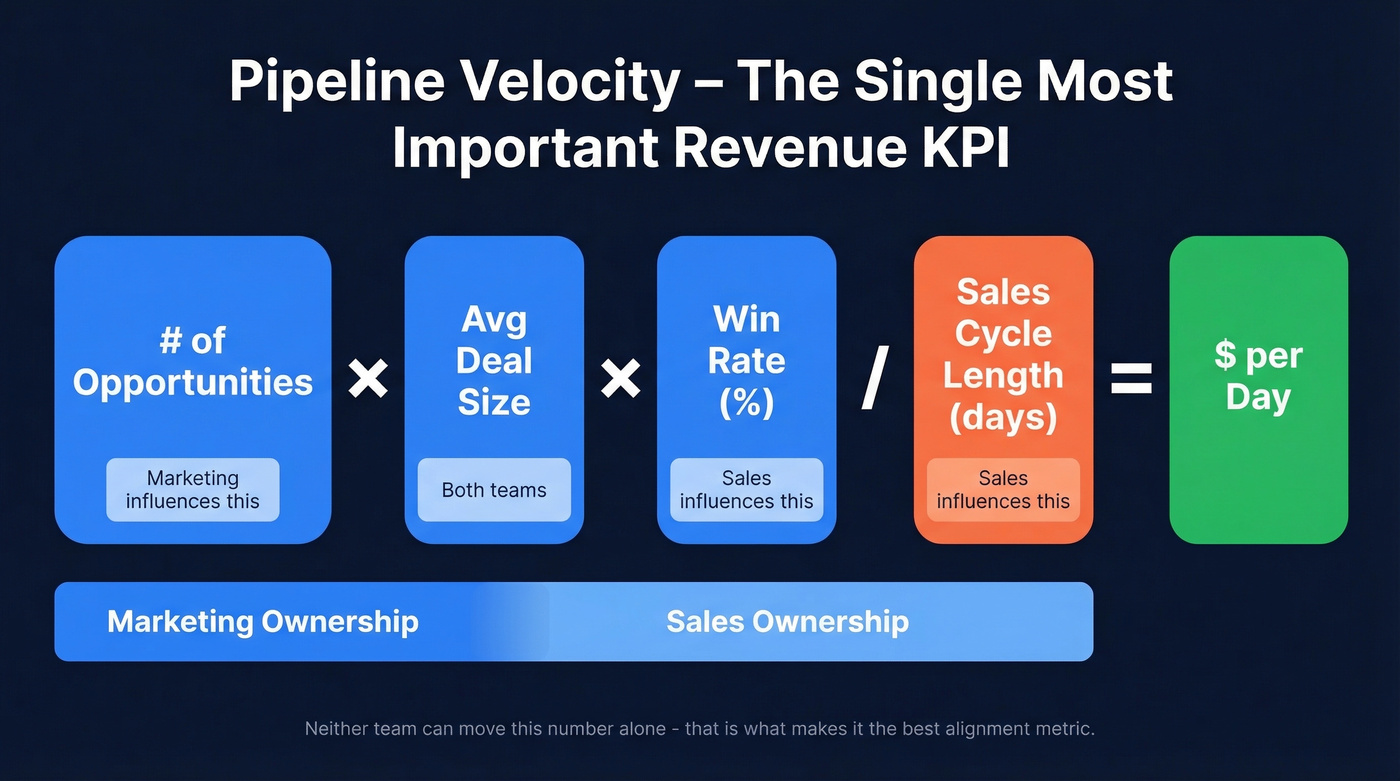
This is the single most important revenue KPI. It tells you how fast money moves through your pipeline, and it requires both teams to be aligned to improve it. Marketing influences the number and quality of opportunities entering the pipe. Sales influences win rate and cycle length. Neither team can move this number alone, which is precisely what makes it the best alignment metric we've found.
The common pitfall is limited stage visibility - if your CRM stages are poorly defined, velocity calculations become meaningless. Run regular velocity reviews to find bottlenecks between stages - this is also where pipeline health tracking pays off.
Customer Acquisition Cost (CAC)
Formula: (Total Sales + Marketing Spend) / New Customers Acquired
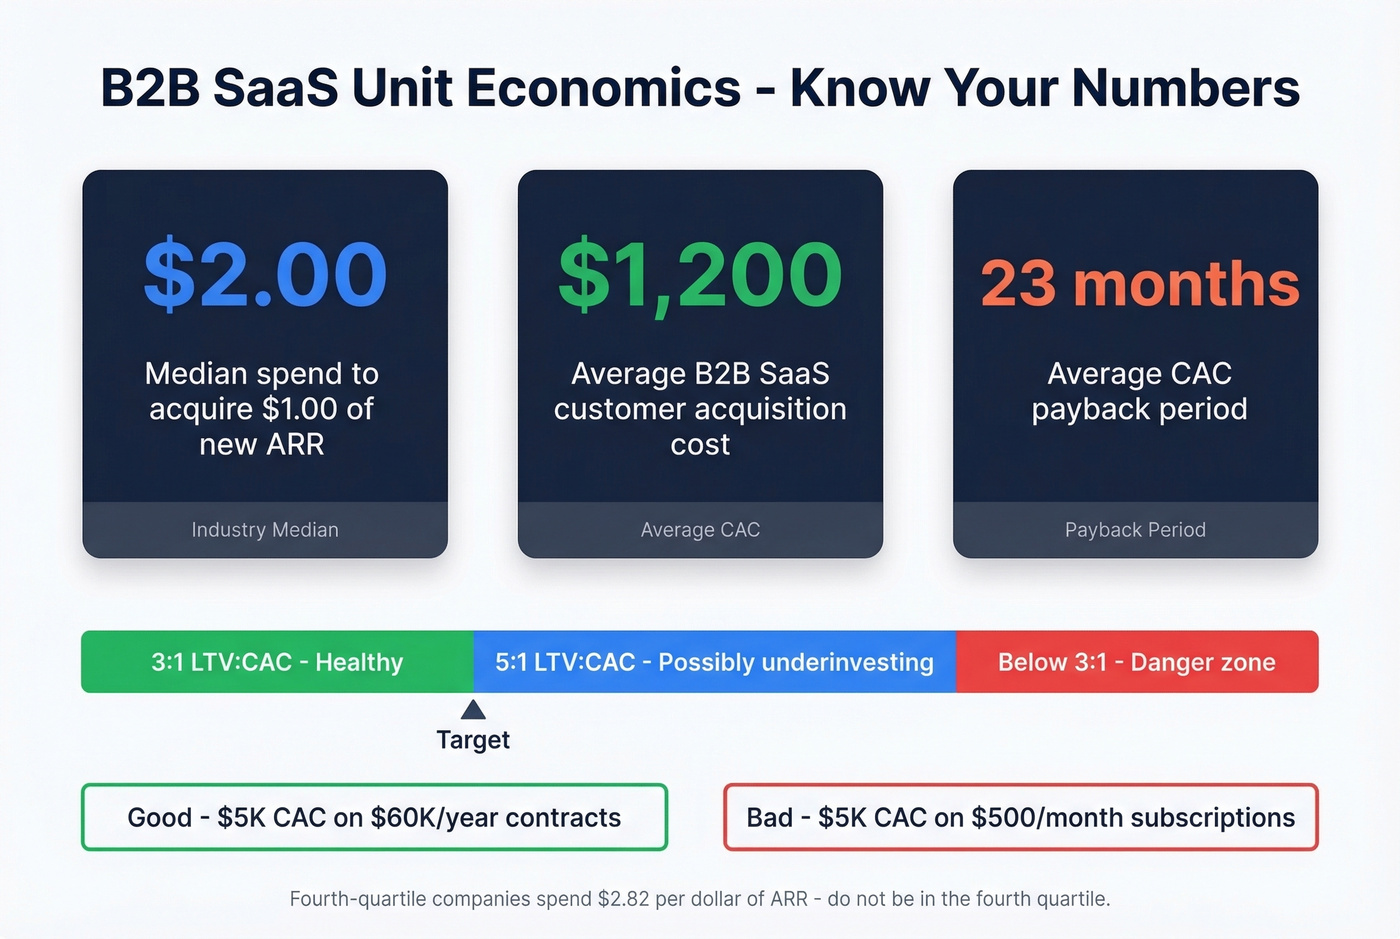
The median B2B SaaS company spends $2.00 to acquire $1.00 of new ARR. Average B2B SaaS CAC is about $1,200, with an average payback period of 23 months. Fourth-quartile companies spend $2.82 per dollar of ARR - that's the danger zone where unit economics break.
Most teams track CAC wrong because they exclude marketing salaries, tooling costs, and agency fees. If your CAC calculation doesn't include every dollar spent on acquiring customers, you're lying to yourself. A $5,000 CAC is fine if your average contract is $60,000/year. It's a disaster if you're selling $500/month subscriptions. Keeping your spend ratio in check starts with an honest, fully loaded number.
Customer Lifetime Value (CLV)
Formula: Average Revenue Per Account x Gross Margin % x Average Customer Lifespan
The number that makes CAC meaningful. A healthy LTV:CAC ratio is 3:1. Below 3:1, you're spending too much to acquire. Above 5:1, you're probably underinvesting in growth.
Marketing-Sourced Pipeline %
The percentage of qualified pipeline (measured in CRM dollar value) that originates from marketing touchpoints. For mature B2B organizations, this typically runs 30-50% of total pipeline. Earlier-stage companies with founder-led sales might see 10-20%. Track this in dollars, not lead counts - a hundred leads worth $5K total matter less than ten leads worth $500K.
Sales-Specific KPIs
These live primarily with sales leadership, but marketing should have visibility into all of them.
Win Rate and Quota Attainment
Formula: (Deals Won / Total Opportunities) x 100
Win rates vary dramatically by segment. SMB teams selling self-serve products often see 20-30% win rates with high volume. Mid-market teams running demos typically land 15-25%. Enterprise deals with longer cycles close at 10-20% but at much higher values. Industry consensus puts average quota attainment at 55-65% of reps hitting target - if your number is significantly below that, the problem is probably quota-setting, not rep performance.
Average Deal Size
Skip this if you're blending new business and expansion into one number - you're masking the signal. Track them separately. If average new deal size is shrinking while expansion holds steady, you've got a positioning or targeting problem that marketing needs to help solve - often by revisiting your ideal customer profile.
Sales Cycle Length
Here's what "normal" looks like by segment:
| Segment | Typical Cycle | Red Flag If... |
|---|---|---|
| SMB | 2-4 weeks | Exceeds 6 weeks - likely a qualification issue |
| Mid-market | 1-3 months | Exceeds 4 months - check for single-threaded deals |
| Enterprise | 3-9 months | Exceeds 9+ months - procurement bloat or champion turnover |
When cycle length creeps up, it's usually bad-fit deals clogging the pipe or single-threaded deals stalling when the champion goes dark. In our experience, the fastest fix is tightening qualification criteria at the top of the funnel rather than trying to accelerate deals that shouldn't be in the pipeline at all.
Activity Metrics
Benchmarks worth knowing: cold email open rates run 20-30%, email response rates 8-10%, and calls-to-meeting ratios land between 1:8 and 1:15. If you want to operationalize this, document your sales activities so reps aren’t “freestyling” what counts.
Rep Ramp Time
How long it takes a new rep to hit full quota. Typical range is 3-6 months depending on deal complexity. GreyScout cut rep ramp time from 8-10 weeks to 4 weeks by giving new reps verified prospect lists on day one instead of making them build from scratch. If your ramp time is increasing, your onboarding, content, or territory design needs work - start with a tighter 30-60-90 day plan.
Your MQL-to-SQL rate tanks when sales can't reach the leads marketing sends over. Prospeo's 98% email accuracy and 30% mobile pickup rate mean reps actually connect with prospects - turning your hand-off metric from a blame game into a revenue driver.
Align your teams around data that actually converts.
Marketing-Specific KPIs
These are marketing-owned, but sales should see them on the shared dashboard.
Conversion Rate by Funnel Stage
The benchmarks that separate good from great:
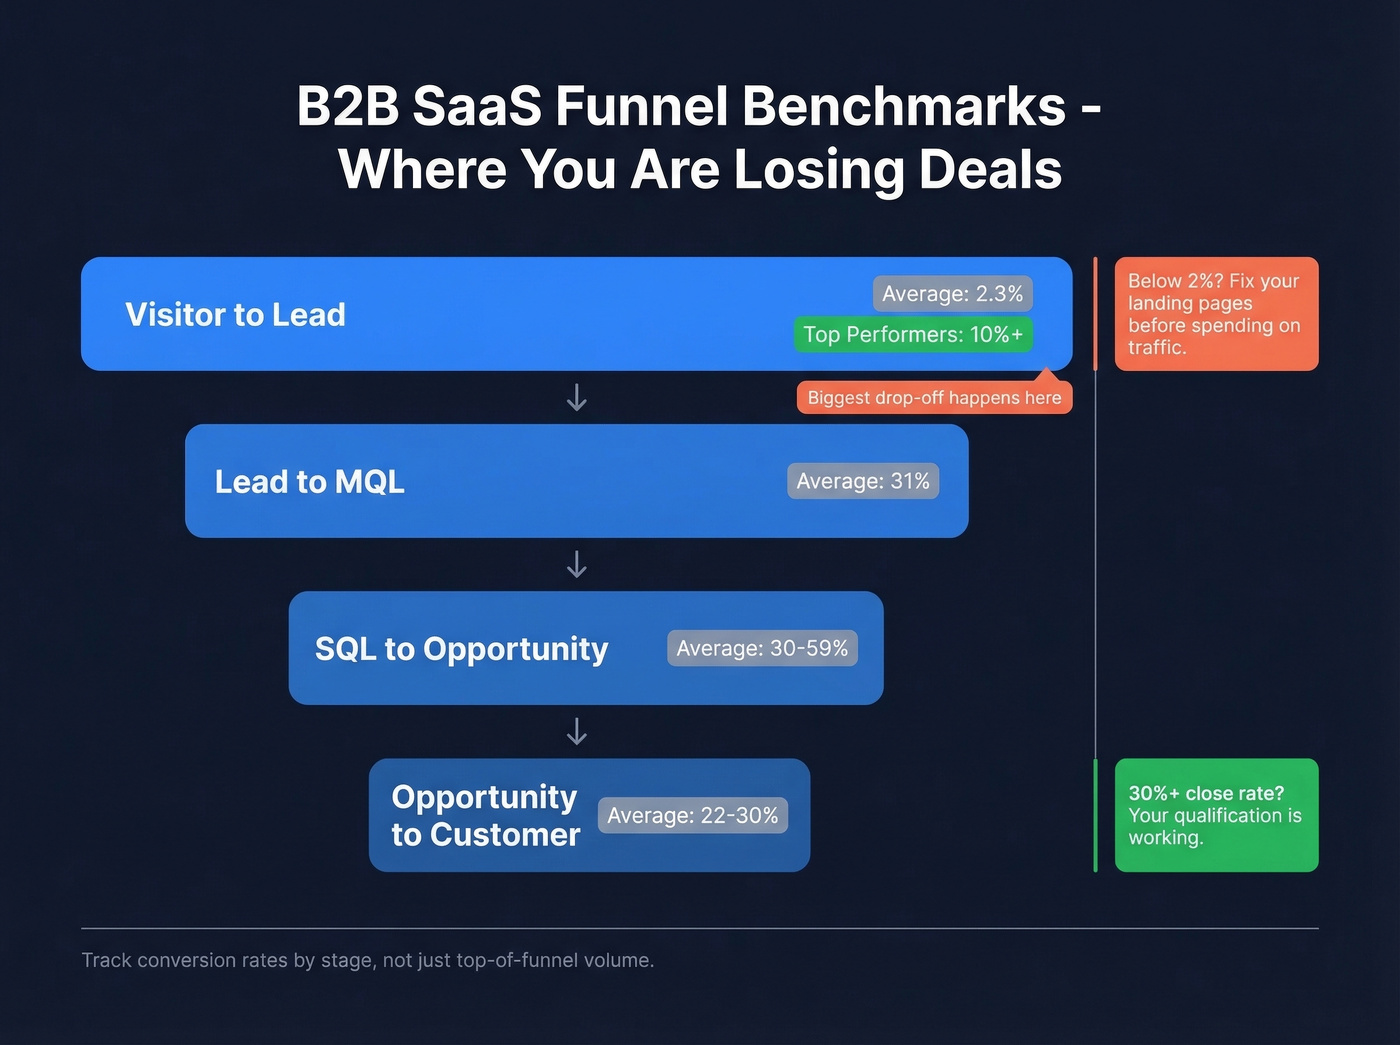
- Visitor to Lead: 2.3% average, 10%+ for top performers
- Lead to MQL: 31%
- SQL to Opportunity: 30-59%
- Opportunity to Customer: 22-30%
The biggest drop-off is always visitor-to-lead. If you're below 2%, your landing pages or offers need work before you spend another dollar on traffic. If you need a clean framework for diagnosing each stage, map it to a B2B sales funnel.
CTR, CPC, and Campaign ROI
CTR is more meaningful than opens alone because it measures intent, not just delivery. Track CTR by channel and creative to understand what's actually driving engagement. A $15 CPC that converts at 8% beats a $3 CPC that converts at 0.5% - always optimize for downstream conversion, not the cheapest click.
Every campaign should have a revenue attribution path, even if it's imperfect. A rough attribution model beats no attribution model every time.
Engagement Quality and Share of Voice
Stop counting clicks and start measuring meaningful engagement. Repeat visits, time on page, scroll depth, shares, and saves tell you whether content is actually resonating. A blog post with 500 views and 4-minute average time on page is more valuable than one with 5,000 views and a 12-second bounce.
Share of Voice - your brand's share of total market visibility relative to competitors - is an underused KPI that the C-suite actually cares about. Track it across organic search, social mentions, and earned media. When SOV exceeds market share, growth typically follows. Most of your competitors ignore this metric entirely, which is exactly why you should track it.
Retention and Expansion KPIs
Revenue teams that only track acquisition are flying half-blind.
Net Revenue Retention (NRR)
The gold standard for SaaS health. Median NRR runs 106%, meaning the average company grows revenue from existing customers by 6% annually before counting new logos. Top performers hit 120%+. Below 100%, you're leaking faster than you're filling.
Gross Revenue Retention (GRR)
Strips out expansion to show pure retention. Median is 90%. Below 85% and you've got a churn problem that no amount of new business will outrun.
Expansion Revenue
Upsells, cross-sells, and seat additions are the lever that turns a good GRR into a great NRR. Marketing plays a bigger role here than most teams realize - through customer marketing, product adoption content, and expansion campaigns. If your marketing team isn't running post-sale campaigns, you're leaving the easiest revenue on the table. (If you’re not sure where to start, use a simple churn analysis to find the biggest leaks.)
KPI Ownership Matrix
Shared accountability sounds great in theory. In practice, it means nobody's accountable unless you define ownership explicitly.
| KPI | Owner | Co-Owner | Review Cadence | Common Pitfall |
|---|---|---|---|---|
| MQL-to-SQL Rate | Marketing | Sales | Weekly | Misaligned definitions |
| Pipeline Velocity | Sales | Marketing | Bi-weekly | Poor stage visibility |
| CAC | Finance | Mktg + Sales | Monthly | Incomplete cost capture |
| CLV | CS/Finance | Marketing | Quarterly | Ignoring churn impact |
| Mktg-Sourced Pipeline | Marketing | Sales | Weekly | Dollar vs lead count |
| Win Rate | Sales | - | Weekly | Blending segments |
| Sales Cycle Length | Sales | Marketing | Monthly | Including dead deals |
| Activity Metrics | Sales | - | Daily | Dirty contact data |
| Funnel Conversion | Marketing | - | Weekly | Vanity stage inflation |
| NRR | CS | Mktg + Sales | Monthly | Ignoring downgrades |
One finding from the Influ2 study that stuck with us: 36% of companies have an effective hand-off but a large cold sales audience that marketing never targets. That's the silent killer. Your hand-off process works, but marketing is reaching the wrong people. Make engagement scores visible across both teams. When marketing can see which accounts sales is prioritizing, and sales can see which accounts are engaging with content, both teams make better decisions.
How to Build a Shared Dashboard
Teams spend 10-20 hours per week on manual reporting. Automated dashboards cut that by 80%+. But the dashboard isn't the hard part - the data feeding it is.
Your CMO needs marketing-sourced pipeline by channel and CAC trends. Sales managers need activity metrics and stage conversion rates. Individual reps need their own pipeline velocity and quota attainment. Same data source, different lenses.
The "single source of truth" only works if the truth is accurate. If your CRM is full of stale contacts and bouncing emails, every conversion rate on the dashboard is wrong. Prospeo's enrichment returns verified contact data for 83% of records on a 7-day refresh cycle - so the numbers on your shared dashboard actually reflect reality, not a snapshot from six months ago.

Before you launch your shared dashboard:
- Clean your CRM data (verify emails, remove duplicates, update stale records) - a lightweight lead generation workflow helps keep it clean.
- Define role-based views for each stakeholder
- Set a weekly review cadence with both teams in the room
- Agree on KPI definitions - especially what counts as an MQL
Let's be honest: the dashboard is the easy part. Getting sales and marketing to sit in the same room weekly and review the same numbers - that's where alignment actually happens. The tool doesn't matter as much as the habit. Companies that improve cross-functional efficiency almost always point to a consistent review cadence as the turning point, not a new BI tool.
Choosing the right sales and marketing KPIs isn't about tracking more. It's about tracking fewer metrics that both teams actually act on. Start with the five shared KPIs above, build the ownership matrix, and commit to a weekly review. Everything else is noise.
CAC bloats when reps waste hours chasing bad contact data. At $0.01 per verified email, Prospeo cuts your cost-per-contact by 90% vs. ZoomInfo - and teams using it book 26% more meetings. That's pipeline velocity you can measure on Monday morning.
Lower your CAC and accelerate pipeline with data refreshed every 7 days.
FAQ
What's the difference between a KPI and a metric?
A KPI is a metric tied directly to a strategic goal with clear ownership and a target - it drives behavior change. Website traffic is a metric; marketing-sourced pipeline is a KPI. If nobody adjusts their actions based on the number, it's a metric, not a KPI.
How many KPIs should a revenue team track?
Eight to ten max across both teams, with at least half shared. More than that and you're tracking a spreadsheet, not running a strategy. The teams that obsess over 25 metrics end up optimizing none of them.
What's the single most important shared KPI?
Pipeline velocity. It combines deal volume, win rate, average deal size, and sales cycle length into one number - and it requires both teams to move it. Better-fit leads from marketing lift win rate; sharper execution from sales shortens cycles. No other metric captures cross-functional performance this cleanly.
How do you measure sales and marketing alignment?
Start with the MQL-to-SQL conversion rate - it's the clearest signal of whether both teams agree on lead quality. Then track pipeline velocity trends and the percentage of marketing-engaged prospects that sales actually contacts. If marketing celebrates lead volume while pipeline shrinks, alignment is broken regardless of what your org chart says.
How does dirty CRM data affect KPI accuracy?
Stale or invalid contacts inflate every funnel metric. A "25% open rate" on a list with 40% bounces is really 15%. Verifying emails before measuring - using tools like Prospeo at 98% accuracy on a 7-day refresh - gives you a clean denominator so conversion rates, activity benchmarks, and pipeline figures reflect what's actually happening.