Sales Efficiency: How to Calculate, Benchmark, and Improve It
The S&M multiple for private B2B SaaS crashed from 6.08 to 3.19 in a single year. Median revenue growth dropped from 47.25% to 28.29% over the same period. Only 43.5% of reps are hitting quota. And just 11% of sales orgs successfully drive commercial success while executing transformations.
That's the reality right now. Sales efficiency - how much revenue you generate per dollar of go-to-market spend - is the metric boards care about most in 2026. Growth is harder, budgets are tighter, and the companies that answer the efficiency question well are still hiring. The rest are doing layoffs and calling it "optimization."
Most guides hand you a formula and wish you luck. You need to know which formula to use, what goes in the denominator (where most teams get it wrong), how to benchmark against companies that actually look like yours, and what to fix first when the number isn't where it needs to be.
The Short Version
If you're pressed for time:
- Three formulas matter: Basic Sales Efficiency Ratio, Net Sales Efficiency, and the SaaS Magic Number. Each tells you something different. Learn all three.
- Benchmarks shift by stage. A 0.8 Magic Number is median for public SaaS. Private companies under $10M ARR operate in a different universe. Jump to the benchmarks table below.
- Start with data quality. Before you redesign comp plans or buy another AI tool, check your bounce rate. If it's above 5%, you're burning budget reaching nobody.
- Read the denominator section. If you don't know what's in the denominator, the ratio is meaningless.
What Does Sales Efficiency Mean?
Sales efficiency measures how much revenue you generate per dollar you spend on sales and marketing. Revenue out divided by S&M dollars in. Simple concept, surprisingly hard to calculate correctly.
A distinction that matters: efficiency vs effectiveness are two different levers. Efficiency is output per dollar spent, while effectiveness is whether your reps are doing the right things. You can be extremely efficient at the wrong activities. A team that sends 50,000 perfectly templated emails to the wrong ICP is efficient. They're also wasting everyone's time.
You need both. Efficiency without effectiveness means you're wasting money efficiently, and effectiveness without efficiency means you're doing great work that doesn't scale.
How to Calculate the Ratio
The Core Formulas
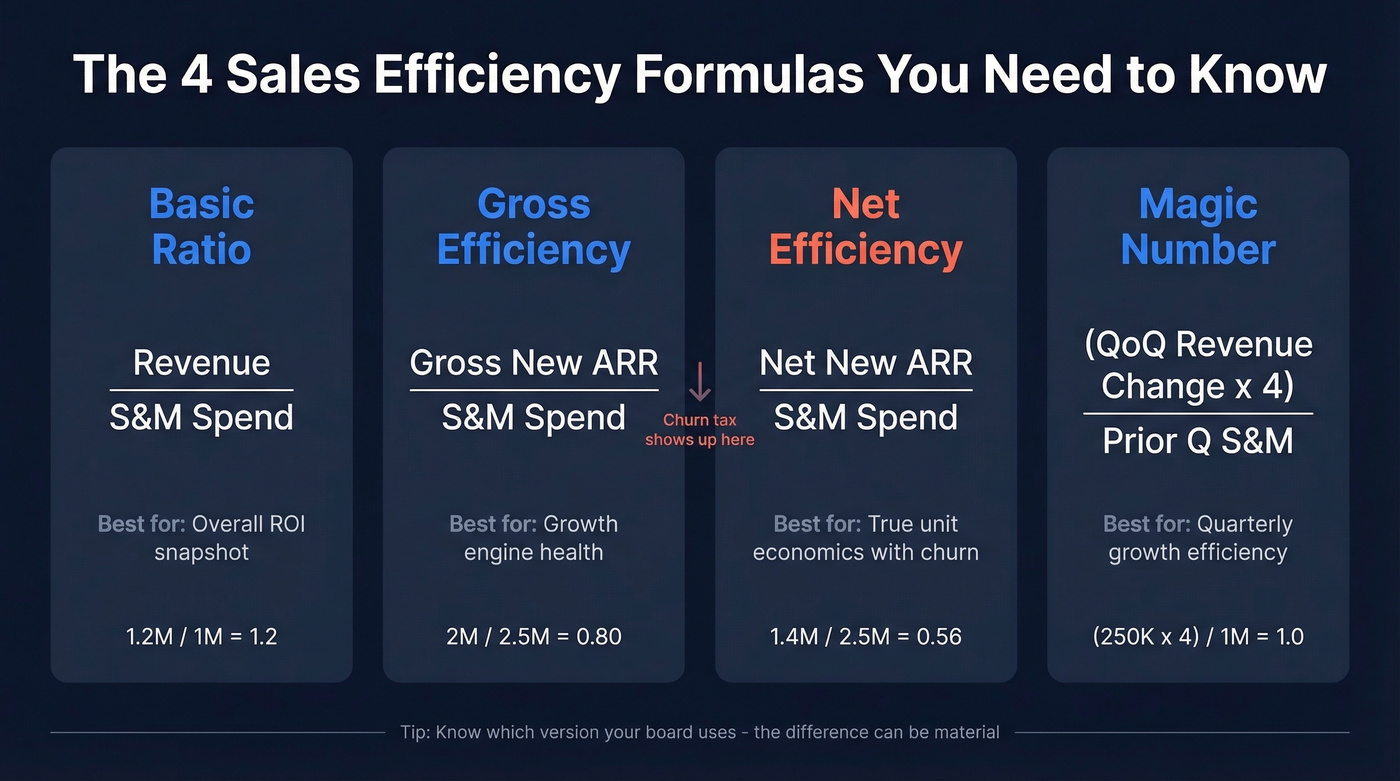
Four calculations are worth knowing. Each answers a slightly different question.
| Formula | Calculation | What It Reveals |
|---|---|---|
| Basic Ratio | Revenue / S&M Spend | Overall ROI on go-to-market |
| Gross Efficiency | Gross New ARR / S&M | Growth engine health (before churn/downsells) |
| Net Efficiency | Net New ARR / S&M | True unit economics (with churn) |
| Magic Number | (Change in Revenue x 4) / Prior S&M | Quarterly growth efficiency |
The Basic Ratio is the starting point. Revenue divided by total sales and marketing spend. If you spent $1M and generated $1.2M, your ratio is 1.2.
Gross Sales Efficiency uses ARR math: Gross New ARR (ending ARR minus beginning ARR) divided by S&M expense. It's a clean view of growth before churn and downsells show up.
Net Sales Efficiency adjusts for reality. Net New ARR subtracts lost and contracted ARR, then divides by S&M expense. This is where churn shows up and ruins the picture.
The SaaS Magic Number uses a GAAP revenue-based formula: take current quarter GAAP revenue minus prior quarter GAAP revenue, multiply by four to annualize, then divide by prior quarter S&M expense. One important note: Tunguz's variant adjusts for gross margin (revenue x GM) rather than raw GAAP revenue. Know which version your board uses - the difference can be material depending on your margin profile.
What Goes in the Denominator
Most guides skip this entirely. Here's the thing: if you don't know what's in the denominator, the ratio is meaningless.
Your S&M expense denominator should be fully burdened - base salaries, commissions, benefits, payroll taxes, software tools, advertising spend, travel, events, and training. Everything your sales and marketing org costs you to operate. If you sell through partners or channels, include partner program costs too.
The tricky part is Customer Success. The rule from The SaaS CFO: if CS carries a quota and sells expansions, that headcount belongs in Sales OpEx. If CS is purely retention and adoption focused, it goes into COGS. If it's mixed - and it usually is - you need to allocate.
One more landmine: the Lighter Capital data showing a 3.19 S&M multiple explicitly excludes salaries from the denominator. Don't compare that number to a fully loaded efficiency ratio. Apples and oranges will make your board deck look either brilliant or catastrophic depending on which definition you grabbed.
Worked Example
Take a hypothetical $8M ARR SaaS company. Beginning ARR is $6M, ending ARR is $8M, lost/contracted ARR is $600K, and total S&M spend is $2.5M.
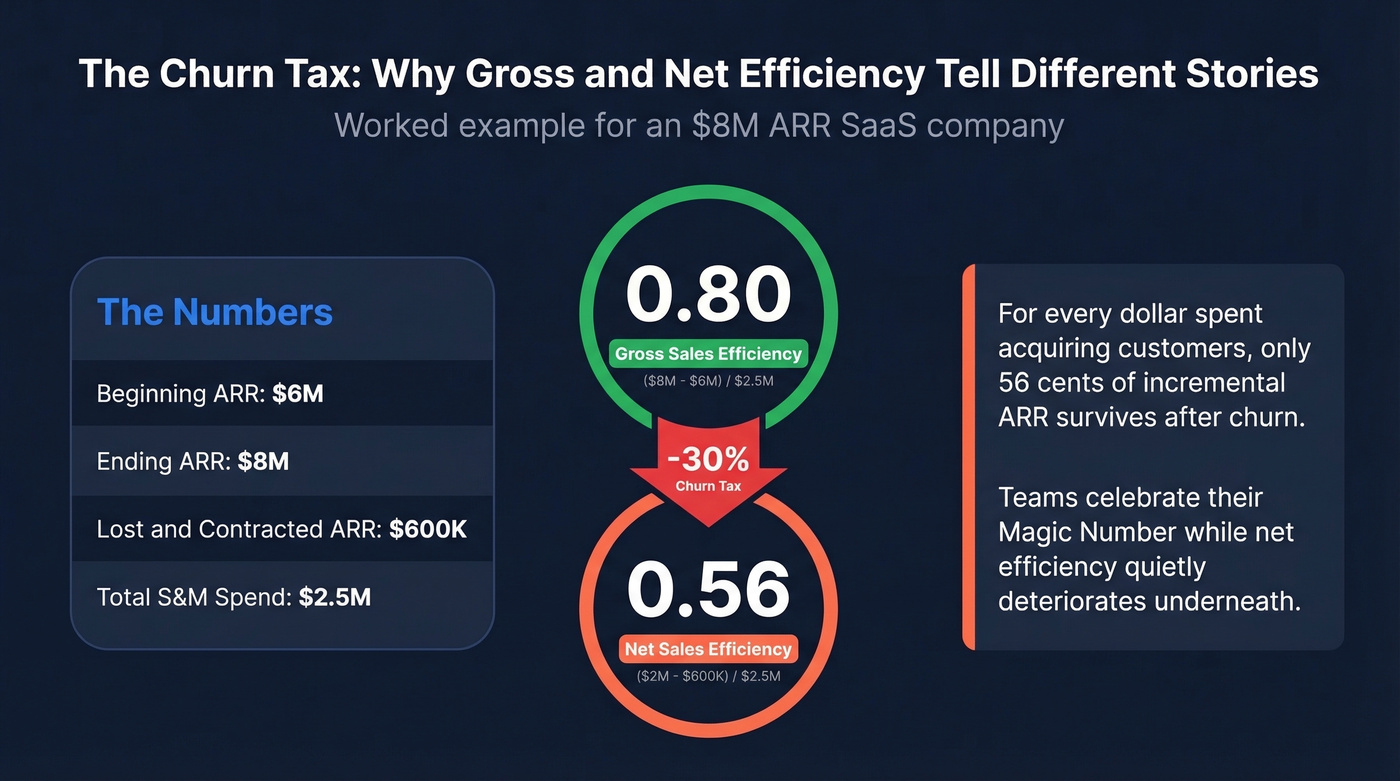
- Gross Sales Efficiency: ($8M - $6M) / $2.5M = 0.80
- Net Sales Efficiency: ($2M - $600K) / $2.5M = 0.56
That gap is the churn tax. Gross looks healthy - right at the public SaaS median. Net tells you that for every dollar spent acquiring customers, you're only keeping 56 cents of incremental ARR after churn eats its share. We've seen this pattern repeatedly: teams celebrate their Magic Number while net efficiency quietly deteriorates underneath.
Benchmarks by Stage
A 0.8 Magic Number is the median for public SaaS companies, per Tunguz's analysis of roughly 20 publicly traded companies using revenue x gross margin. Software Equity Group puts the "acceptable" band at 0.75-1.0, with anything below 0.75 signaling inefficiencies.
But those are public company benchmarks. Private B2B SaaS operates in a different reality:
| Metric | 0-$1M ARR | $1-$10M ARR | $10-$50M ARR | $50M+ ARR |
|---|---|---|---|---|
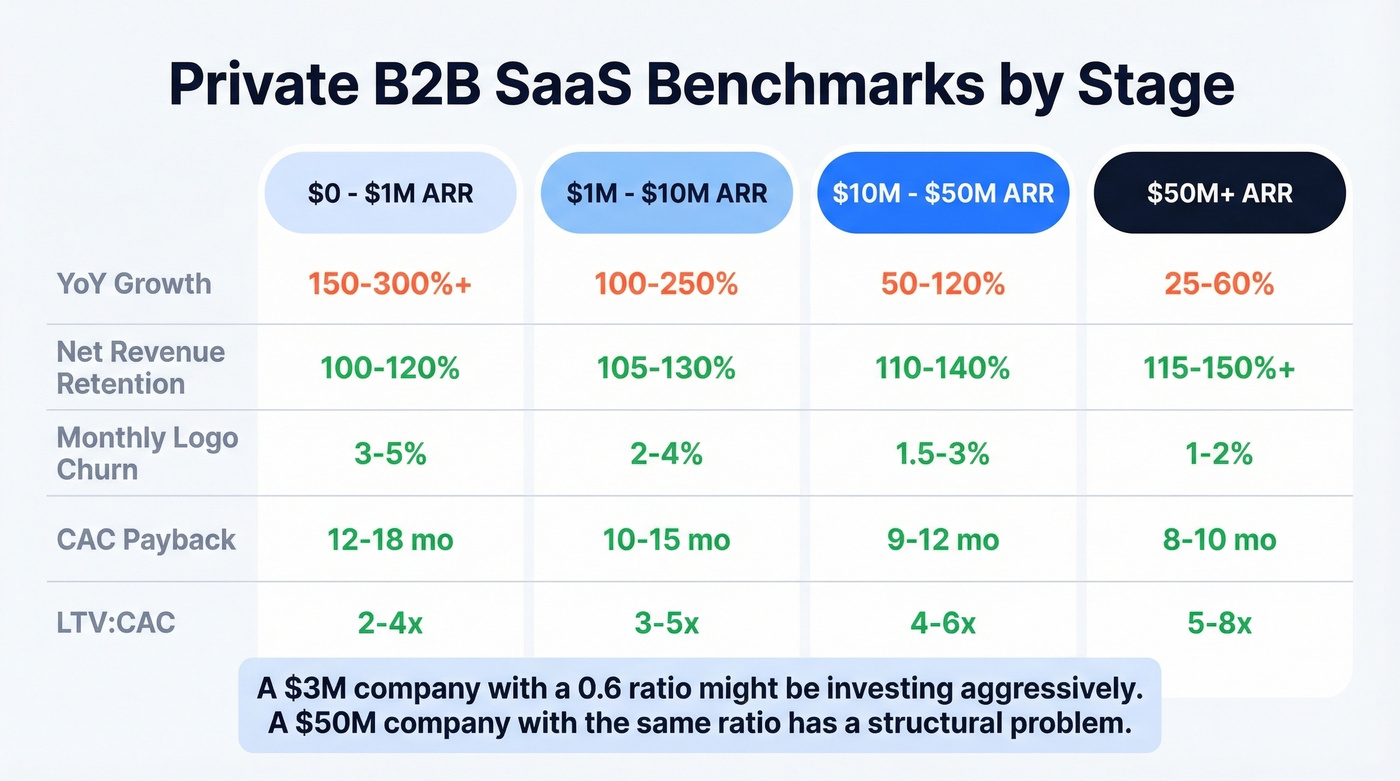
| YoY Growth | 150-300%+ | 100-250% | 50-120% | 25-60% |
| NRR | 100-120% | 105-130% | 110-140% | 115-150%+ |
| Monthly Logo Churn | 3-5% | 2-4% | 1.5-3% | 1-2% |
| CAC Payback (mo) | 12-18 | 10-15 | 9-12 | 8-10 |
| LTV:CAC | 2-4x | 3-5x | 4-6x | 5-8x |
SMB-focused companies typically see faster CAC payback, while enterprise-focused companies endure longer payback periods but generate higher LTV:CAC ratios. As companies scale, growth rates compress but retention and unit economics improve. A $3M ARR company with a 0.6 ratio isn't necessarily in trouble - they may be investing aggressively in a market that rewards land-grab speed. A $50M company with the same ratio has a structural problem.
If your ratio is above 3.0, you're not running a tight ship - you're underinvesting in growth. You've found a channel that works and you're not pouring enough fuel on it. That's a strategic mistake that looks like discipline on a spreadsheet.
The Lighter Capital data adds important context. Their dataset of 155 private B2B SaaS companies shows the biggest S&M effectiveness slowdowns among startups under $1M ARR and those above $10M ARR - the bookends of the growth curve where either product-market fit is still shaky or market saturation starts biting.
You read it above: if your bounce rate is above 5%, you're burning S&M budget reaching nobody. That tanks your efficiency ratio before strategy even enters the picture. Prospeo delivers 98% email accuracy with a 7-day refresh cycle, so every dollar in your denominator actually reaches a real buyer.
Stop inflating your S&M spend on emails that bounce.
Why Your Ratio Is Dropping
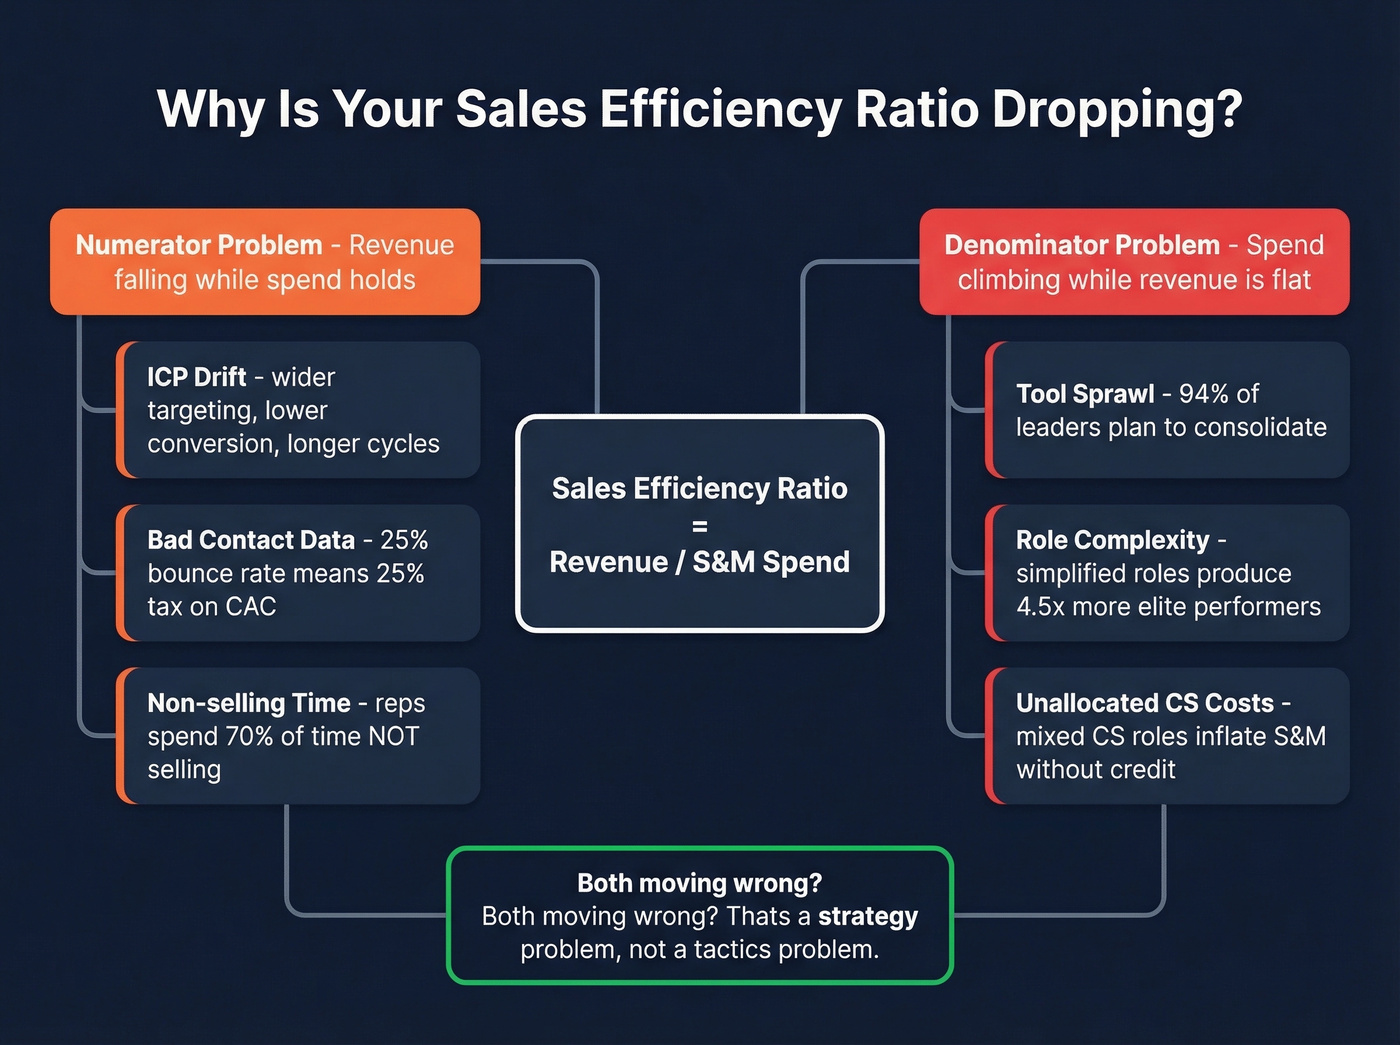
Before you fix anything, diagnose whether it's a numerator problem or a denominator problem. Revenue falling while spend holds steady? That's a demand or conversion issue. Revenue flat while spend climbs? Cost discipline. Both moving the wrong direction? That's a strategy problem.
The most common culprits we see:
Bad contact data. If 25% of your emails bounce, you're burning a quarter of your outbound capacity reaching nobody. That's a direct 25% tax on your CAC. Teams obsess over messaging and sequences while sending to addresses that haven't been valid in months. (If you want to go deeper, start with bounce rate benchmarks and fixes.)
Tool sprawl. The average sales enablement stack has ballooned, and 94% of revenue leaders plan to consolidate. The problem isn't the number of tools - it's tools that don't integrate and produce conflicting data, creating busywork for reps and ops alike. A quick RevOps audit usually surfaces the worst offenders.
Role complexity. Gartner found that simplified seller roles produce 4.5x more elite performers. When you ask reps to prospect, demo, negotiate, manage renewals, and update the CRM, you get mediocrity across all five.
Non-selling time. Reps spend roughly 70% of their time on non-selling activities. That's not a productivity problem - it's a systems problem. Your ratio can't improve when the majority of your payroll investment goes toward data entry and internal meetings. This is where sales process optimization pays back fast.
ICP drift. Teams start focused, then expand targeting to hit pipeline goals. Wider targeting means lower conversion rates, longer cycles, and worse pipeline velocity - even if top-line pipeline looks healthy. Use an ideal customer profile to force focus.
How to Improve Sales Efficiency
Fix Data Quality First
This is the most overlooked lever, and it's the fastest to fix. Your SDR team sent 10,000 emails last month and 2,800 bounced. That's 28% of your outbound motion wasted before a single conversation happened.
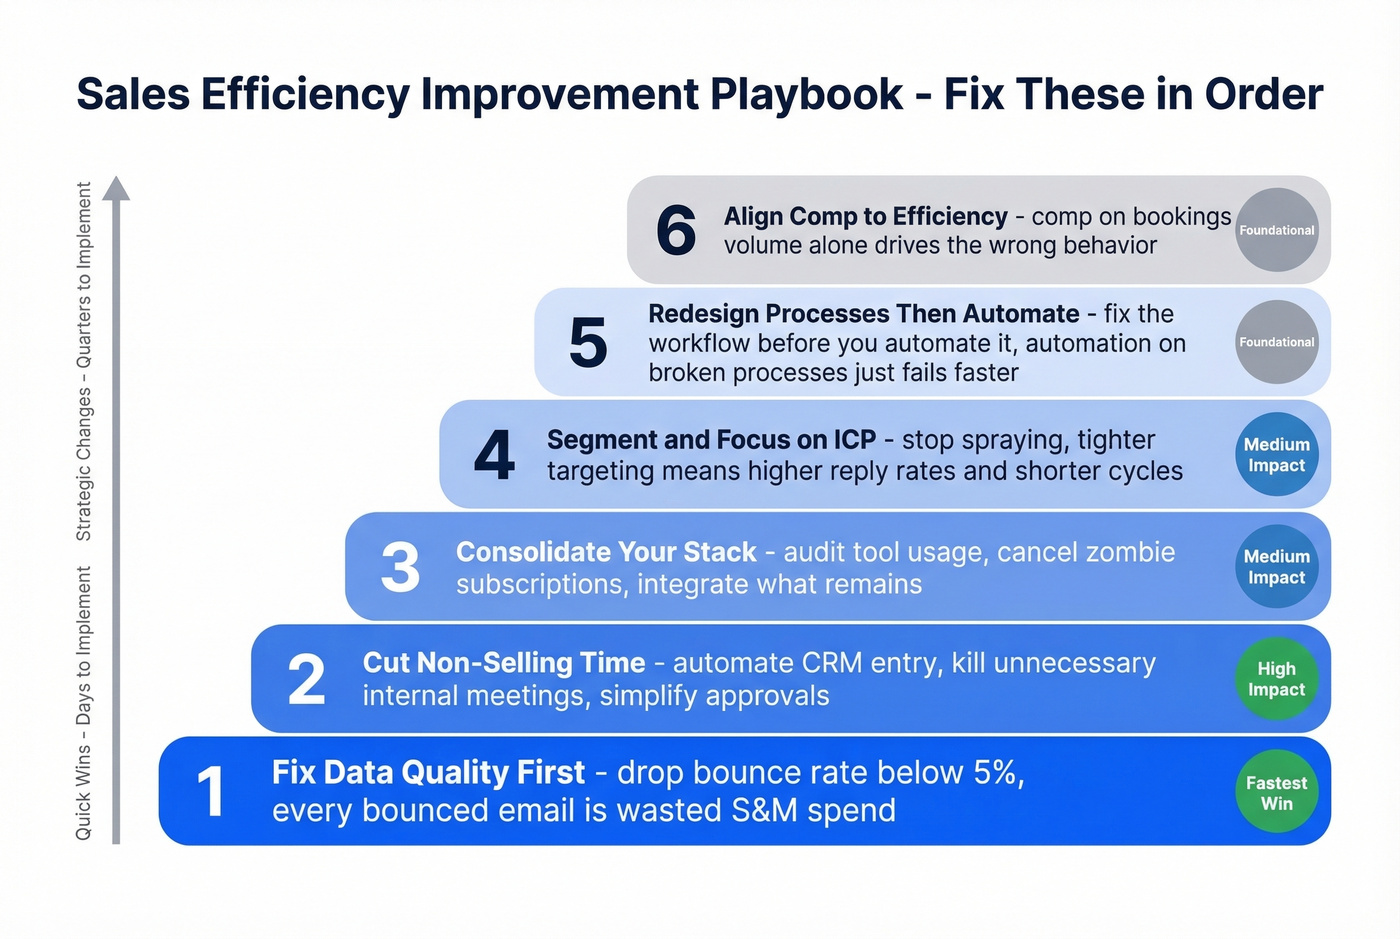
Prospeo tackles this at the source - 98% email accuracy on a 7-day data refresh cycle, compared to the six-week industry average. Snyk's sales team dropped their bounce rate from 35-40% to under 5% after switching, with AE-sourced pipeline jumping 180% and 200+ new opportunities per month. That's what happens when reps stop wasting cycles on dead addresses. If you're evaluating vendors, compare data enrichment services and email deliverability impact side-by-side.
Cut Non-Selling Time
If reps spend 70% of their time not selling, even a 10% improvement in that ratio moves the needle significantly. Start with CRM entry automation - it's one of the biggest time sinks. Simplify approval workflows. Kill the internal meetings that exist because someone once had a bad handoff.
Consolidate Your Stack
Cutting tools isn't a strategy. Cutting bad tools is. Audit usage, kill the zombies, and consolidate around platforms that actually talk to each other. If nobody's logged into a tool since onboarding, cancel it today. (A practical starting point: shortlist SDR tools by integration depth, not feature count.)
Segment and Focus on ICP
Stop spraying. Every email sent outside your ICP is a direct hit to your ratio. Tighter targeting means higher reply rates, shorter sales cycles, and better conversion - all of which improve the numerator without touching the denominator. If you need a playbook, use proven sales prospecting techniques.
If you can't describe your ICP in two sentences, that's your first problem.
Redesign Processes, Then Automate
Automating a bad process just makes it fail faster. Before you buy the AI tool, map the workflow. Where do deals stall? Where do handoffs break? Fix the process first, then automate the fixed version. We learned this the hard way watching teams layer automation on top of broken routing logic and wonder why nothing improved.
Align Comp to Efficiency Metrics
If you comp reps purely on bookings volume, don't be surprised when they chase low-quality deals that churn in six months. Tie variable comp to net new ARR efficiency - not just gross bookings. When reps feel the churn impact in their wallet, deal quality improves fast. This is also why teams track CAC alongside efficiency.
Simplify Seller Roles
Gartner's data is striking: simplified roles produce 4.5x more elite performers. Let prospectors prospect. Let closers close. Let CS manage renewals. The generalist AE who does everything is a relic of the "do more with less" era, and the data says it doesn't work.
Snyk cut bounce rates from 35-40% to under 5% and grew AE-sourced pipeline 180%. That's a sales efficiency transformation driven entirely by data quality - same team, same spend, radically more revenue out. Prospeo gives you 300M+ verified profiles at $0.01/email so your Magic Number actually moves.
Triple your pipeline output without touching the denominator.
How AI Changes the Equation
Bain's research puts a number on the opportunity: sellers spend roughly 25% of their time actually selling. AI could double that. Early adopters are seeing 30%+ improvement in win rates when AI optimizes conversion across funnel stages.
But Bain emphasizes something most teams miss - the biggest gains come from process redesign, not from layering AI on top of existing workflows. They call it the "micro-productivity trap." You save a rep 15 minutes on email drafting, declare victory, and wonder why the ratio didn't move. It didn't move because the rep still spends two hours a day on CRM hygiene and internal Slack threads.
The teams getting real AI ROI rethink entire workflows. Instead of "AI writes the email," think "AI identifies which accounts show buying signals, routes them to the right rep, drafts personalized outreach based on the prospect's tech stack and recent activity, and auto-logs everything to the CRM." That's a process redesign. That moves the number.
Let's be honest: most sales orgs aren't there yet. The gap between "we use AI" and "AI has changed our unit economics" is enormous. Start with the fundamentals - clean data, focused ICP, simplified roles - and layer AI on top of a process that already works.
The Investor Lens
Investors don't look at sales efficiency in isolation. They look at it through composite frameworks, and two dominate board conversations right now.
Rule of 40 says your revenue growth rate plus EBITDA margin should equal or exceed 40%. BCG's analysis of 107 private SaaS companies shows how scale-dependent this is: 26% of companies above $80M revenue beat it, 22% between $30-$80M, and just 9% below $30M. If you're a $5M ARR company benchmarking against Rule of 40, you're setting yourself up for disappointment.
Bessemer's Rule of X argues that equal weighting is misleading. Growth should be weighted 2-3x more than margin because growth compounds while margin is linear. Top decile public cloud companies score around 48% on Rule of 40 but roughly 80% on Rule of X.
The implication: don't over-optimize for margin at the expense of growth. Cutting your S&M budget to improve the ratio looks great for one quarter - and then your pipeline dries up. Stop benchmarking against public companies. The Lighter Capital data proves private B2B SaaS operates in a fundamentally different reality, and the frameworks built for Salesforce and Snowflake will mislead a $7M ARR startup every time.
FAQ
What's a good sales efficiency ratio?
For public SaaS, the Magic Number median is about 0.8, and Software Equity Group considers 0.75-1.0 acceptable. Private companies under $10M ARR should target gross efficiency of 1.0+. Above 3.0 likely signals underinvestment in growth rather than operational discipline.
How often should I measure it?
Quarterly at minimum, monthly during high-growth phases or after GTM changes. A trailing-twelve-month view smooths out seasonality and one-time spikes, giving you the truest read on trend direction.
What's the difference between efficiency and effectiveness?
Efficiency measures revenue output per dollar of S&M spend - it's a financial ratio. Effectiveness measures whether reps are doing the right activities at the right time. You need both. A team can score well on one while failing the other, which is why the best operators track them together.
How does bad contact data affect the ratio?
If 25% of your emails bounce, you're burning a quarter of your outbound budget reaching nobody - directly inflating CAC and deflating your ratio. Fixing data quality is the single fastest lever most teams overlook. Snyk cut their bounce rate from 35-40% to under 5% with Prospeo and saw AE-sourced pipeline jump 180%.
Should I use gross or net efficiency?
Below $10M ARR, gross efficiency works for tracking growth momentum. Above $10M, net efficiency matters more because churn compounds and can mask deteriorating unit economics behind healthy-looking gross numbers. Track both once churn becomes material.