Sales Funnel and Pipeline: Benchmarks, Formulas, and Frameworks You Actually Need
A RevOps lead we know spent two quarters rebuilding her team's pipeline reporting - only to realize half the leadership team was using "pipeline" and "funnel" interchangeably in every forecast meeting. Nobody agreed on what the numbers meant because nobody agreed on the terms. Understanding the difference between a sales funnel and pipeline isn't academic. It's the foundation every forecast, conversion metric, and velocity calculation sits on.
A thread on r/sales makes this painfully obvious: practitioners genuinely mix these concepts up, and the downstream damage shows up in forecasts that don't match reality.
The Short Version
- Pipeline = your sales process (seller-side). Funnel = the buyer's journey (buyer-side). You need both views to forecast accurately.
- Pipeline coverage should be 3x-5x quota; MQL-to-SQL is the biggest drop-off stage.
- 40-60% of pipeline deals die not from a competitor but from no decision at all.
- Stop counting stages, start measuring velocity - the formula is below.
- None of these metrics matter if your contact data is bad. Verify before you optimize.
What Is a Sales Pipeline?
A sales pipeline maps the seller's process - every step your team takes to move a deal from first touch to closed-won. It's internal, action-oriented, and built around what reps do next.
Most B2B pipelines follow a structure like this:
- Lead generation - sourcing new contacts through outbound, inbound, or referrals (see free lead generation tools)
- Qualification - applying frameworks like BANT to filter fit
- Meeting/discovery - first real conversation with a decision-maker (use a tighter discovery questions set)
- Proposal/negotiation - pricing, terms, stakeholder alignment (use an anchor in negotiation)
- Close - signed deal, handoff to onboarding
- Retention - often omitted, but smart teams track it because expansion revenue starts here (track renewal rate)
The pipeline answers one question: "Where is this deal right now, and what needs to happen next?" It's horizontal. Stages move left to right, and each deal sits in exactly one stage at a time.
What Is a Sales Funnel?
A sales funnel maps the buyer's journey - how many prospects enter at the top and how many survive each stage to become customers. It's external, volume-oriented, and built around conversion rates.
- Awareness - prospect learns you exist
- Interest - prospect engages with content, visits your pricing page, or responds to outreach
- Decision - prospect evaluates your solution against alternatives
- Purchase - prospect becomes a customer
The funnel answers a different question: "How many buyers survive each stage, and where are we losing them?" It's shaped like an inverted triangle because volume shrinks at every step.
One important nuance for 2026: modern SaaS funnels aren't strictly linear. They loop through onboarding, retention, and upsell stages because ARR growth depends on expansion, not just new logos. If your funnel model ends at "purchase," you're missing the revenue that actually compounds.
Side-by-Side Comparison
| Dimension | Sales Pipeline | Sales Funnel |
|---|---|---|
| Perspective | Seller (internal) | Buyer (external) |
| Focus | Process & actions | Conversion & volume |
| Key metrics | Deal stage, velocity | Conversion rate, drop-off |
| Structure | Linear stages | Narrowing volume |
| Visualization | Horizontal | Inverted triangle |
| Reporting use | Forecasting | Marketing optimization |
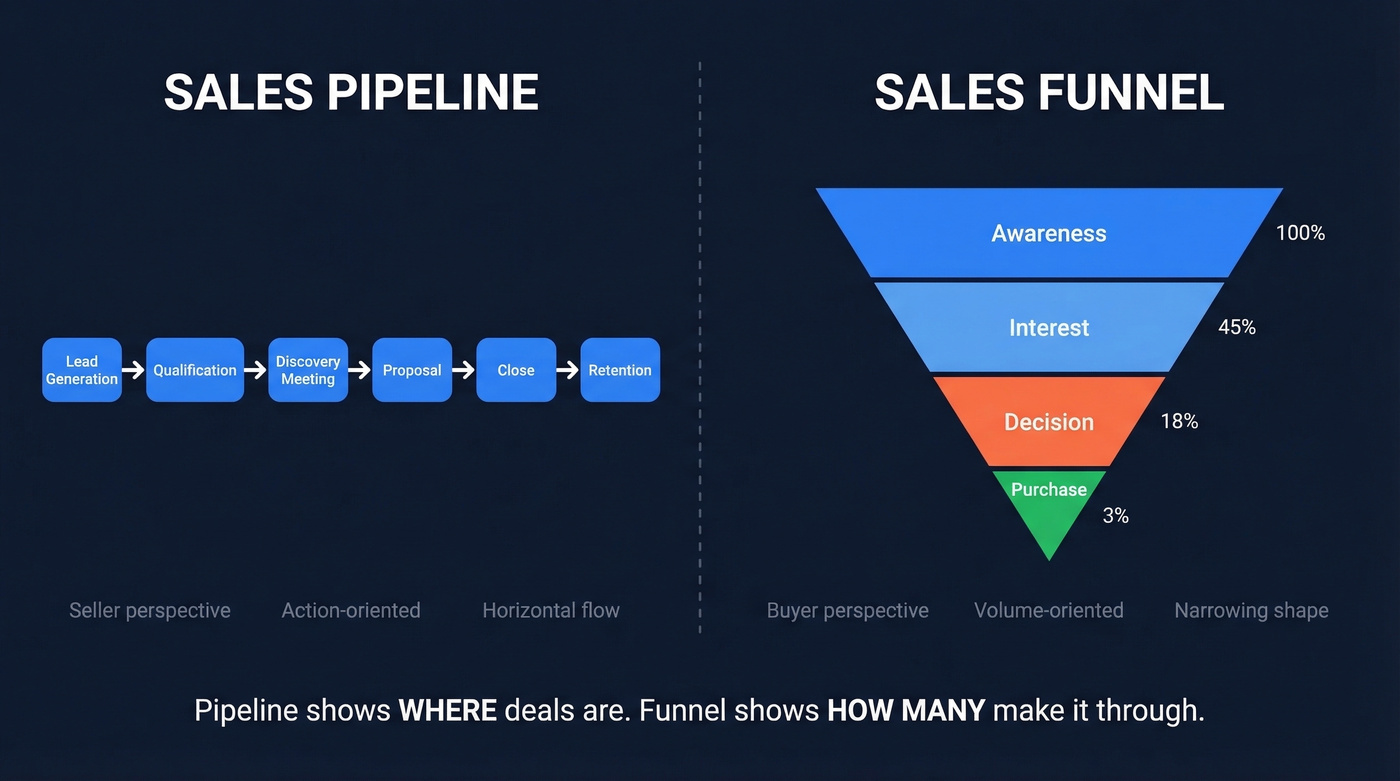
Pipeline tells you where deals are. Funnel tells you how many make it through. One without the other leaves you either blind to process or blind to volume.
Conversion Benchmarks by Industry
Let's get specific. These are the numbers your team should be benchmarking against.

Industry-specific benchmarks from First Page Sage's conversion rate report:
| Industry | Lead-to-MQL | MQL-to-SQL | SQL-to-Opp | SQL-to-Closed Won |
|---|---|---|---|---|
| B2B SaaS | 39% | 38% | 42% | 37% |
| Cybersecurity | 24% | 40% | 43% | 46% |
| IT & Managed Services | 19% | 38% | 41% | 46% |
Aggregate B2B benchmarks from MarketJoy's pipeline data:
| Stage | Typical Range | Benchmark |
|---|---|---|
| Lead-to-MQL | 20-25% | 22% |
| MQL-to-SQL | 12-18% | 15% |
| SQL-to-Opportunity | 10-12% | 11% |
| Opp-to-Closed Won | 6-9% | 7% |
The biggest drop-off is consistently MQL-to-SQL. That's where marketing's definition of "qualified" collides with sales' definition of "worth my time." If you're only going to fix one stage, fix that handoff.
End-to-end, the median B2B lead-to-customer conversion rate is roughly 2.9%. That means about 971 of every 1,000 leads won't close. Let that number inform every capacity model and budget conversation you have.
Sales cycle length matters too. Enterprise deals run 6-18 months. SMB cycles compress to 2-6 months. Your velocity calculations need to reflect this segmentation - blending them into one number produces a metric that's useless for either segment.
The biggest funnel drop-off is MQL-to-SQL - and bad contact data makes it worse. When 35%+ of your emails bounce, deals stall before reps even get a conversation. Prospeo's 98% verified emails and 7-day data refresh mean your pipeline stays filled with reachable buyers, not dead ends.
Stop losing pipeline to bounced emails. Verify before you prospect.
Pipeline Metrics That Matter
Two numbers matter more than everything else in pipeline management.
Pipeline coverage ratio: How much pipeline do you need to hit quota? The benchmark is 3x-5x your target. Below that, you don't have enough qualified volume. Above that, you're usually carrying too many low-probability deals and inflating your forecast. (If you want a deeper diagnostic, use a pipeline health checklist.)
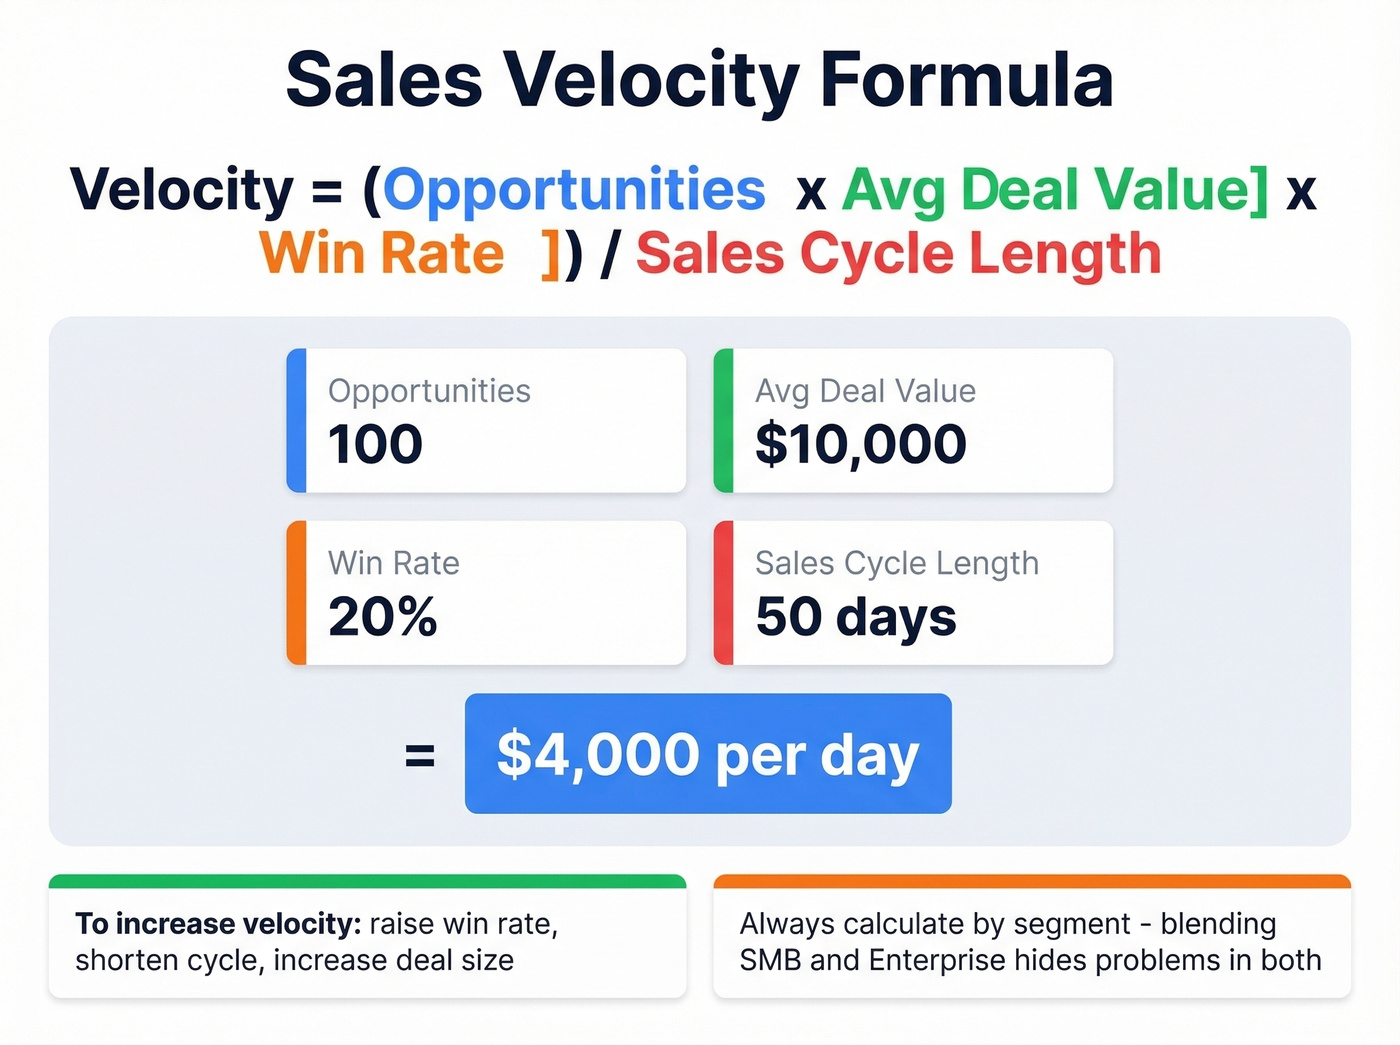
Sales velocity formula:
Sales Velocity = (Opportunities x Avg Deal Value x Win Rate) / Sales Cycle Length
Here's a worked example: 100 opportunities x $10,000 average deal x 20% win rate / 50-day cycle = $4,000/day in pipeline throughput.
Calculate this by segment. Your SMB velocity and enterprise velocity are completely different animals - a blended number hides problems in both. We've seen teams miss quota by 20% while their "overall velocity" looked healthy, because a stalled enterprise segment was masked by high-volume SMB deals.
One more stat worth internalizing: sales cycles are running 21% longer than they were in 2020, and win rates have fallen alongside. Velocity is the early warning system that catches these trends before they hit your quarterly number.
Funnel Formulas for RevOps
These are the formulas your RevOps team should have in a dashboard by end of week:
- MQL-to-SQL conversion rate = (SQLs / MQLs) x 100
- Lead-to-customer conversion rate = (Customers / Total leads) x 100
- Funnel drop-off rate = (Leads leaving at stage / Leads entering stage) x 100
- Lead-to-meeting conversion rate = (Meetings booked / Leads) x 100 - 5-15% is a common benchmark for strong SDR performance, depending on channel and ICP fit (see more funnel metrics)
The formula that matters most depends on where your funnel is leaking. If top-of-funnel volume is strong but closed deals are flat, work backward from the bottom. Your drop-off rate by stage will tell you exactly where the problem lives.
One benchmark worth pinning to the wall: teams with aligned sales and marketing see 67% higher funnel conversion rates and generate 208% more revenue from marketing efforts. Alignment isn't a soft skill - it's a conversion multiplier.
Where Leakage Happens
Here's the thing: 40-60% of pipeline deals aren't lost to a competitor. They're lost to no decision at all. The prospect goes dark, the deal stalls, and it sits in your CRM aging like milk. That's the real enemy - not the other vendor in the bake-off.
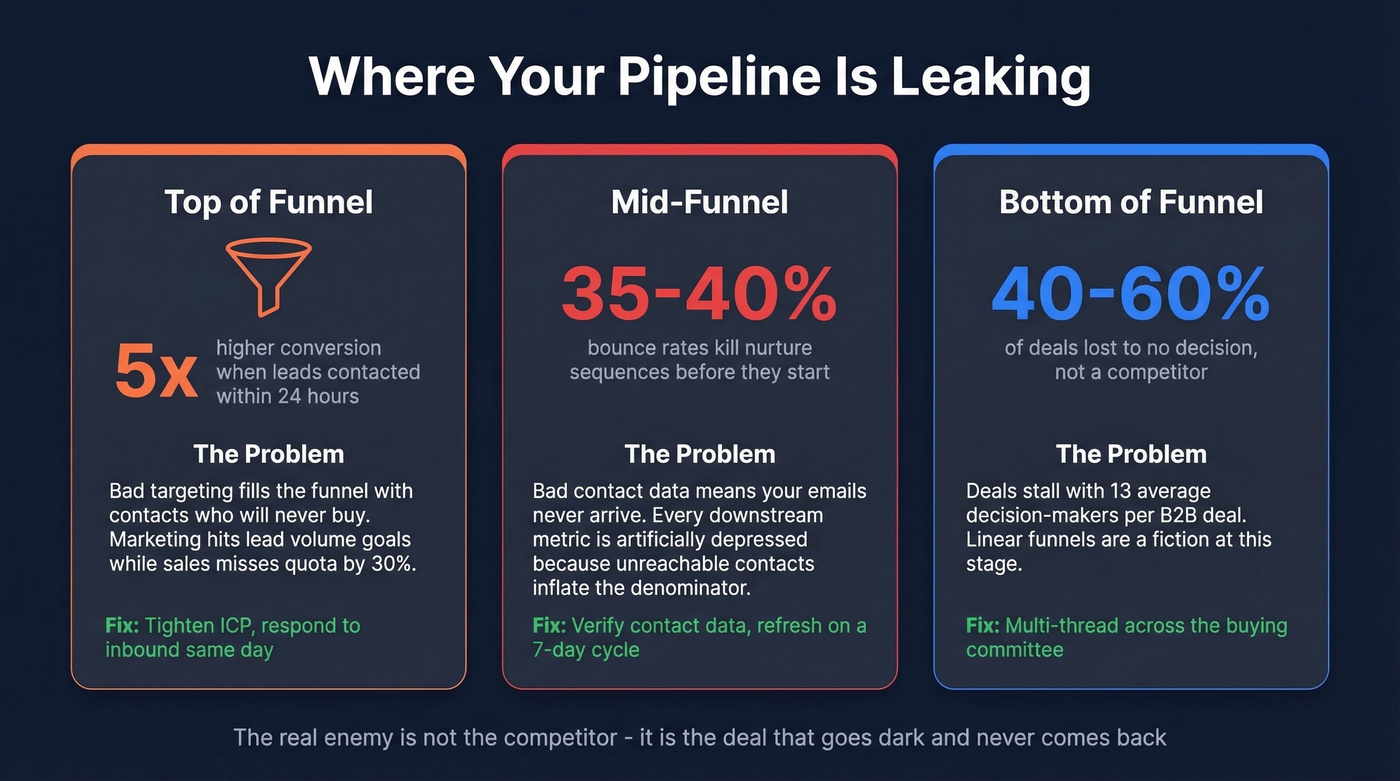
Top of funnel: Bad targeting. You're filling the funnel with contacts who were never going to buy. Marketing hits lead volume targets while sales misses quota by 30% - a pattern that shows up constantly on r/b2bmarketing. Speed matters here too: contacting leads within 24 hours increases conversion by 5x, yet most teams let inbound leads sit for days. (If you need a refresh, revisit sales prospecting techniques.)

Mid-funnel: Weak nurturing and bad data. If your bounce rate is 35-40%, your nurture sequences are dead on arrival and every downstream conversion rate is artificially depressed because the denominator includes contacts who were never reachable. Snyk's team saw this firsthand - bounce rates dropped from 35-40% to under 5% and AE-sourced pipeline jumped 180% after switching to Prospeo's verified contact data on a 7-day refresh cycle. (To benchmark and fix this, track your email bounce rate.)
Bottom of funnel: Stalled deals and no-decision losses. With an average of 13 decision-makers per B2B deal, linear funnels are a fiction. Deals loop, stall, and require multi-threading across the buying committee.
Pipeline Mistakes That Kill CRM Adoption
These nine mistakes come from Onpipeline's implementation research, and we've seen every single one play out in real teams:
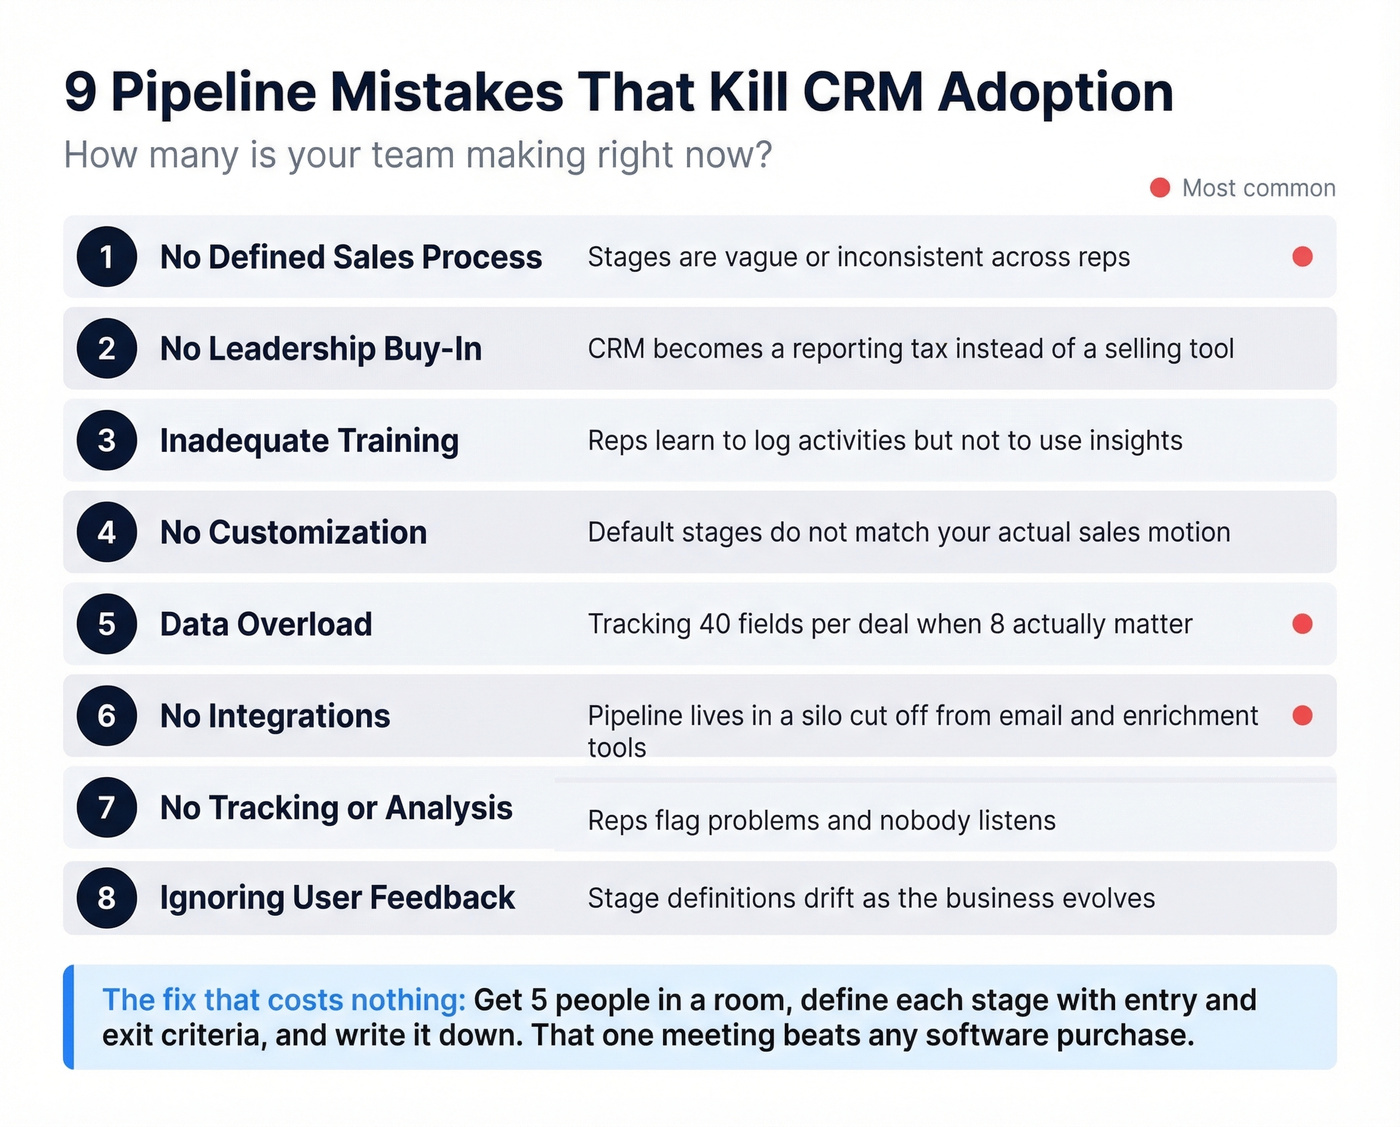
- No defined sales process - stages are vague or inconsistent across reps (see sales process optimization)
- No leadership buy-in - CRM becomes a reporting tax instead of a selling tool
- Inadequate training - reps learn just enough to log activities, not enough to use insights
- No customization - default stages don't match your actual sales motion
- Data overload - tracking 40 fields per deal when 8 matter
- No integrations - pipeline lives in a silo disconnected from email, calendar, and enrichment tools
- No tracking or analysis - data goes in, nothing comes out
- Ignoring user feedback - reps flag problems, nobody listens
- No maintenance - pipeline stages and definitions drift as the business evolves
If reps aren't updating stages weekly, your forecast is fiction. Teams on r/msp actively evaluating CRMs hit this wall as they scale from ~$2-3M toward ~$5-10M in revenue. The CRM isn't the problem. The process discipline is.
Most pipeline problems aren't pipeline problems. They're definition problems. If your team can't agree on what "qualified" means or when a deal moves from discovery to proposal, no CRM on earth will save your forecast. Get five people in a room, define each stage with entry and exit criteria, and write it down. That one meeting will do more for your pipeline accuracy than any software purchase.
A quick weekly review framework: Every Friday, each rep answers three questions. Which deals moved stages this week and why? Which deals haven't moved in 14+ days? What's the single next action on your top three deals? If you can't run this meeting in 15 minutes, your pipeline has too many stale deals.
AI-Era Pipeline Management
89% of revenue organizations now use AI in their sales process, up from 34% in 2023. With 80% of buyer interactions happening digitally, tools like Salesforce Einstein, Pipedrive AI, and Clay are flagging stalled deals, recommending next actions, and scoring opportunities based on engagement patterns.
The signal layer matters as much as the CRM layer now. Intent data that tracks in-market buyer signals - not just which deals have the most recent activity - turns your sales funnel and pipeline from a static report into a dynamic system that surfaces which accounts are actually ready to buy. Prospeo's intent data covers 15,000 Bombora topics and pairs with 30+ search filters covering technographics, job changes, and headcount growth, so teams can prioritize pipeline based on real buying signals rather than gut feel. (If you want a scoring model, start with identifying buying signals.)
Skip the AI hype if your data foundation isn't solid, though. An AI model scoring leads against a database full of bounced emails and outdated titles is just automating garbage. Clean your data first, then layer intelligence on top.
Your velocity formula is only as good as the opportunities feeding it. If reps waste hours chasing outdated contacts, cycle length inflates and win rates drop. Prospeo gives you 300M+ profiles with 30+ filters - intent data, job changes, headcount growth - so every opportunity in your pipeline is real.
Fill your pipeline with verified decision-makers at $0.01 per email.
FAQ
Is a sales funnel the same as a pipeline?
No. A pipeline tracks seller actions and deal stages - it answers "where is this deal?" A funnel tracks buyer progression and conversion volume - it answers "how many buyers survive each stage?" You need both for accurate forecasting. If you can't calculate velocity from your pipeline and stage-by-stage drop-off from your funnel, you're missing a view.
What's a good pipeline coverage ratio?
3x-5x your quota is the standard benchmark for B2B teams. Below 3x, you don't have enough qualified volume to absorb deal slippage. Above 5x, run an aging report - deals with no logged activity in 30+ days should be moved to "at risk" or removed entirely. Inflated coverage masks forecast risk.
Where do most deals stall?
MQL-to-SQL is the biggest conversion drop-off across most B2B companies, and 40-60% of pipeline deals ultimately die from no decision rather than a competitor win. Multi-threading across the buying committee - reaching 3+ stakeholders per deal - is the best defense against both problems.
How does bad contact data affect funnel and pipeline metrics?
High bounce rates inflate top-of-funnel numbers and depress every downstream conversion rate. When Snyk cut bounces from 35-40% to under 5% with verified data on a 7-day refresh cycle, AE-sourced pipeline jumped 180%. If your bounce rate is above 5%, every metric in your funnel is lying to you.