Sales Funnel Conversion Rate Benchmarks: 2026 Data by Stage, Size, and Funnel Type
A SaaS founder posted on r/SaaS that their 2.1% freemium-to-paid conversion rate was "actually good." The math checked out: 180,000 free users x 2.1% = 3,800 paying customers x $200 average revenue = roughly $760K ARR. A single percentage, stripped of context, tells you nothing.
Here's the uncomfortable part: Gradient Works dug into the sourcing behind many widely cited sales funnel conversion rate benchmarks and found that some trace back to Salesforce and HubSpot reports that don't appear to exist. The numbers everyone recycles? A lot of them are ghosts.
So let's do this differently - real ranges, segmented by what matters, with honest caveats about where the data comes from.
Quick B2B Funnel Benchmarks
Here's the table you came for - general B2B stage-by-stage ranges compiled from multiple sources including Causal Funnel's 2026 rollup:
| Stage | Weak | Average | Strong |
|---|---|---|---|
| Visitor to Lead | <1% | 1.5-2.5% | 3-5% |
| Lead to MQL | <20% | 37-41% | 45%+ |
| MQL to SQL | <25% | 32-42% | 50%+ |
| SQL to Opportunity | <30% | 40-48% | 50%+ |
| Opportunity to Customer | <20% | 31-39% | 40%+ |
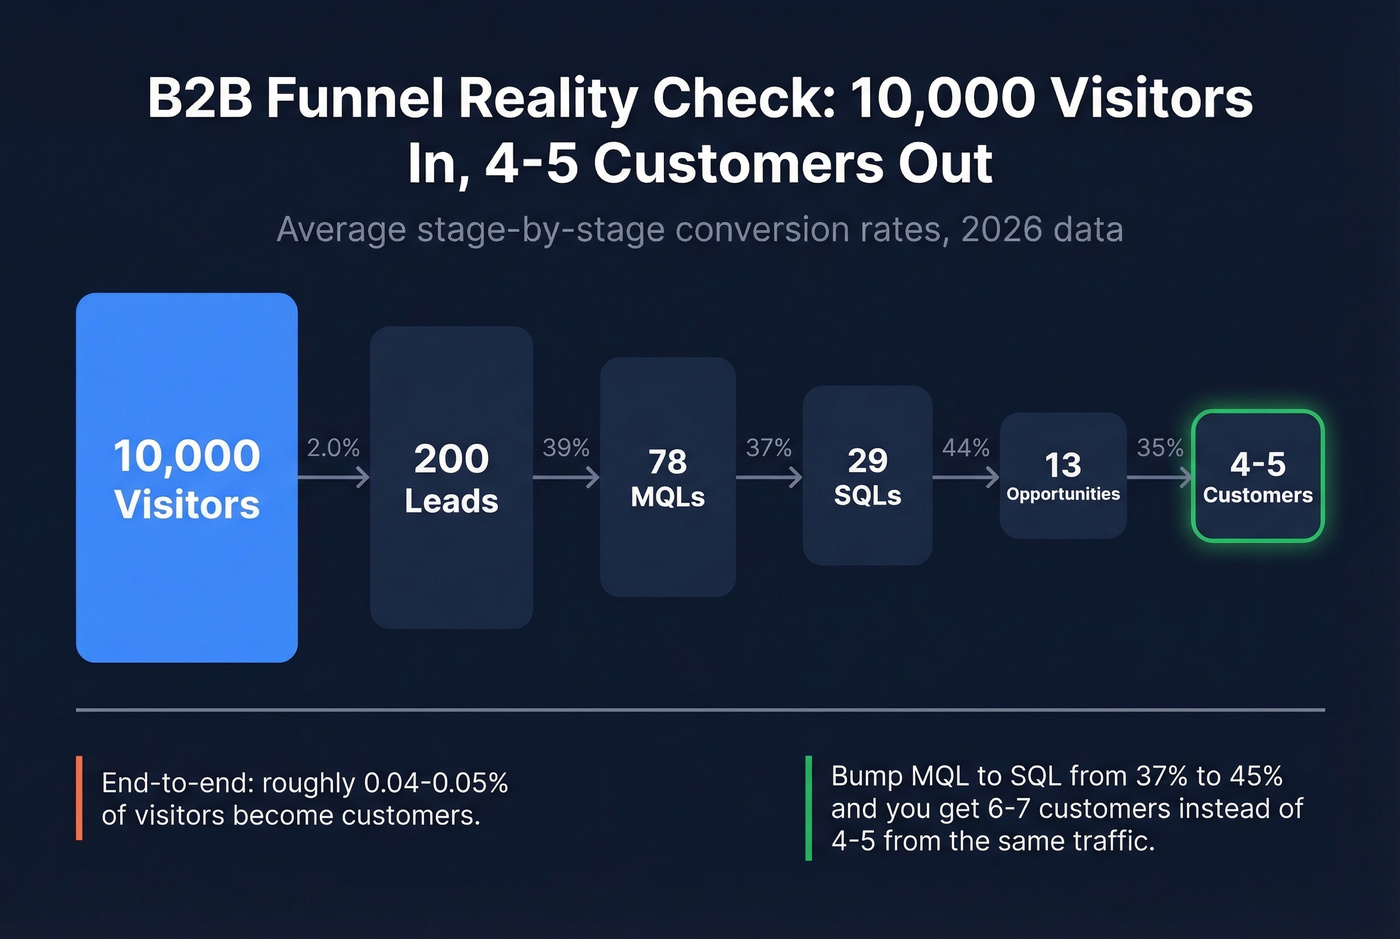
Now apply these to real numbers. Start with 10,000 visitors:
- 10,000 x 2% = 200 leads
- 200 x 39% = 78 MQLs
- 78 x 37% = 29 SQLs
- 29 x 44% = ~13 opportunities
- 13 x 35% = ~4-5 customers
That's roughly 0.04-0.05% end-to-end. Tiny. But small improvements at any single stage compound fast - bump MQL-to-SQL from 37% to 45% and you're looking at 6-7 customers instead of 4-5 from the same traffic.
For landing pages specifically, practitioners report lead capture at 3-7% and direct purchase at 1-3%, which is useful if you're benchmarking individual pages rather than the full funnel.
Define Your Stages First
A "good" MQL-to-SQL rate is meaningless if your MQL definition is broken. And most are. 90% of MQLs never convert into SQLs - not because sales drops the ball, but because marketing classified them too early.
Here's a working framework adapted from First Page Sage's definitions:
- Lead - Any non-spam contact: form fill, content download, webinar registration. No buying intent yet.
- MQL - Expressed clear buying interest and can afford it, but not yet qualified by sales.
- SAL - An MQL that sales has reviewed and accepted per your SLA. Accepted, not yet qualified. When properly defined, SAL-to-SQL conversion averages 52.7%, which proves the acceptance step filters effectively.
- SQL - Sales-vetted with demonstrated intent. A meeting has typically occurred.
- Opportunity - Proposal or contract in hand, actively evaluating.
- Closed Won - Signed contract (not yet the first payment).
If your MQL-to-SQL rate is below 25%, fix your lead scoring definition before blaming sales. The stage boundary is the problem, not the people.
Benchmarks by Company Size and Channel
A single benchmark table without segmentation is useless. SMB and enterprise funnels behave completely differently.
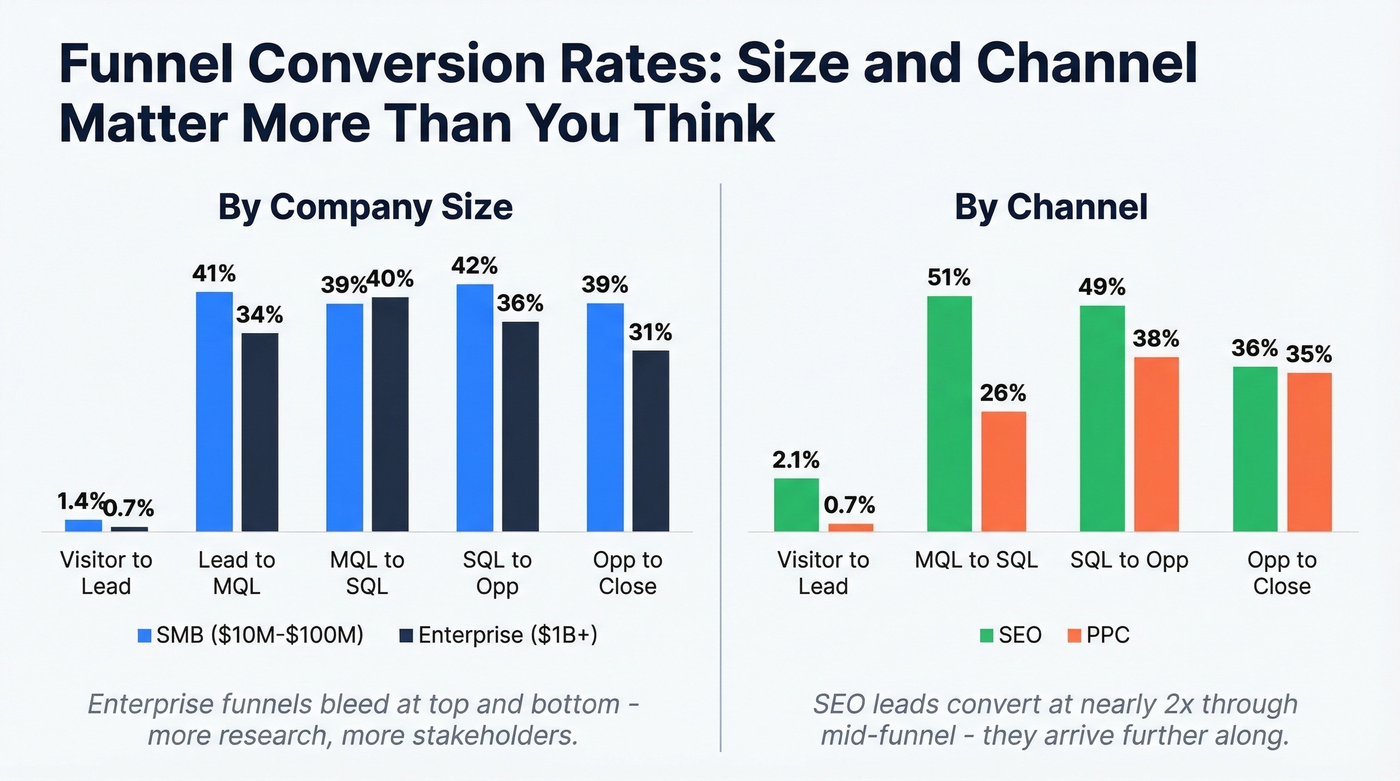
By company size:
| Stage | SMB ($10M-$100M) | Enterprise ($1B+) |
|---|---|---|
| Visitor to Lead | 1.4% | 0.7% |
| Lead to MQL | 41% | 34% |
| MQL to SQL | 39% | 40% |
| SQL to Opportunity | 42% | 36% |
| Opportunity to Close | 39% | 31% |
Enterprise funnels convert less at the top because traffic is pickier and research cycles run longer. They bleed more at the bottom because more stakeholders get involved and procurement drags everything out - we've seen enterprise deals stall for months over a single procurement review that an SMB would skip entirely.
By channel:
| Stage | SEO | PPC |
|---|---|---|
| Visitor to Lead | 2.1% | 0.7% |
| MQL to SQL | 51% | 26% |
| SQL to Opportunity | 49% | 38% |
| Opportunity to Close | 36% | 35% |
SEO leads convert at nearly double the rate through the mid-funnel. They're further along in their research when they arrive. PPC leads are cheaper to generate but need significantly more nurturing to qualify, so don't panic if your paid campaigns show lower stage-by-stage numbers - that's structural, not a performance problem.
Benchmarks by Deal Size
Larger deals don't just close slower. They require exponentially more effort at every stage.
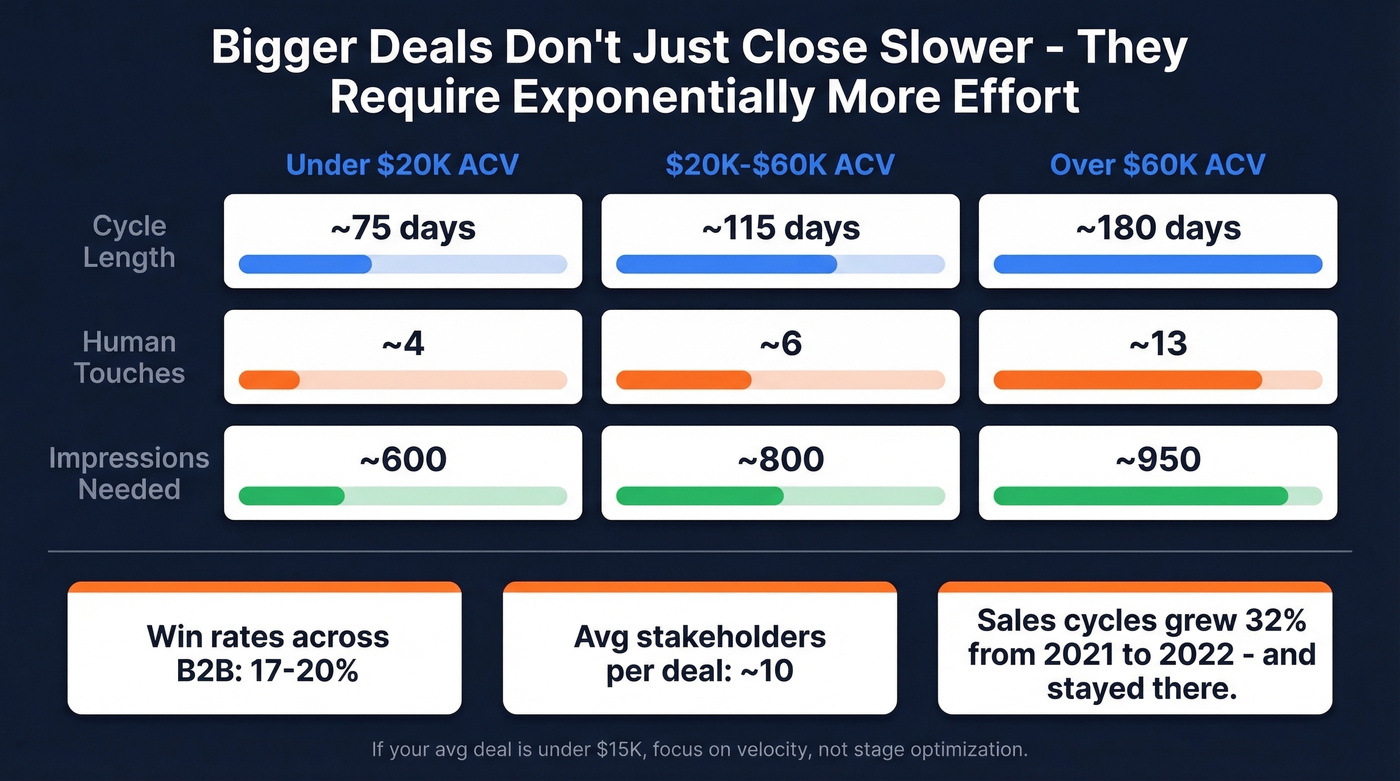
| Metric | <$20K ACV | $20K-$60K | >$60K |
|---|---|---|---|
| Cycle length | ~75 days | ~115 days | ~180 days |
| Human touches | ~4 | ~6 | ~13 |
| Impressions | ~600 | ~800 | ~950 |
Win rates across B2B sit at 17-20%, stakeholders per deal increased to roughly 10 in recent years, and sales cycles lengthened 32% from 2021 to 2022 - a shift that set a new baseline for pipeline planning. If you're still planning pipeline coverage on pre-2022 conversion assumptions, you're overestimating close rates by a wide margin.
Let's be honest about deal size strategy: if your average deal is under $15K, obsessing over mid-funnel stage conversion is the wrong game. Your constraint is volume and funnel velocity, not granular stage optimization. Focus on time-in-stage and speed-to-close instead.
If you want a tighter view of what “normal” looks like across the whole journey, compare against sales pipeline benchmarks and funnel metrics rather than a single stage in isolation.
Every stage conversion in your funnel degrades when contact data is bad. Snyk's 50 AEs saw bounce rates drop from 35-40% to under 5% with Prospeo - unlocking 180% more pipeline from the same funnel. At $0.01 per verified email, fixing your top-of-funnel data quality is the highest-ROI move you can make.
Stop optimizing a funnel built on bad data. Start with 98% accuracy.
Outbound Funnel Benchmarks
Stop comparing outbound conversion rates to inbound. They're structurally different funnels with different economics.
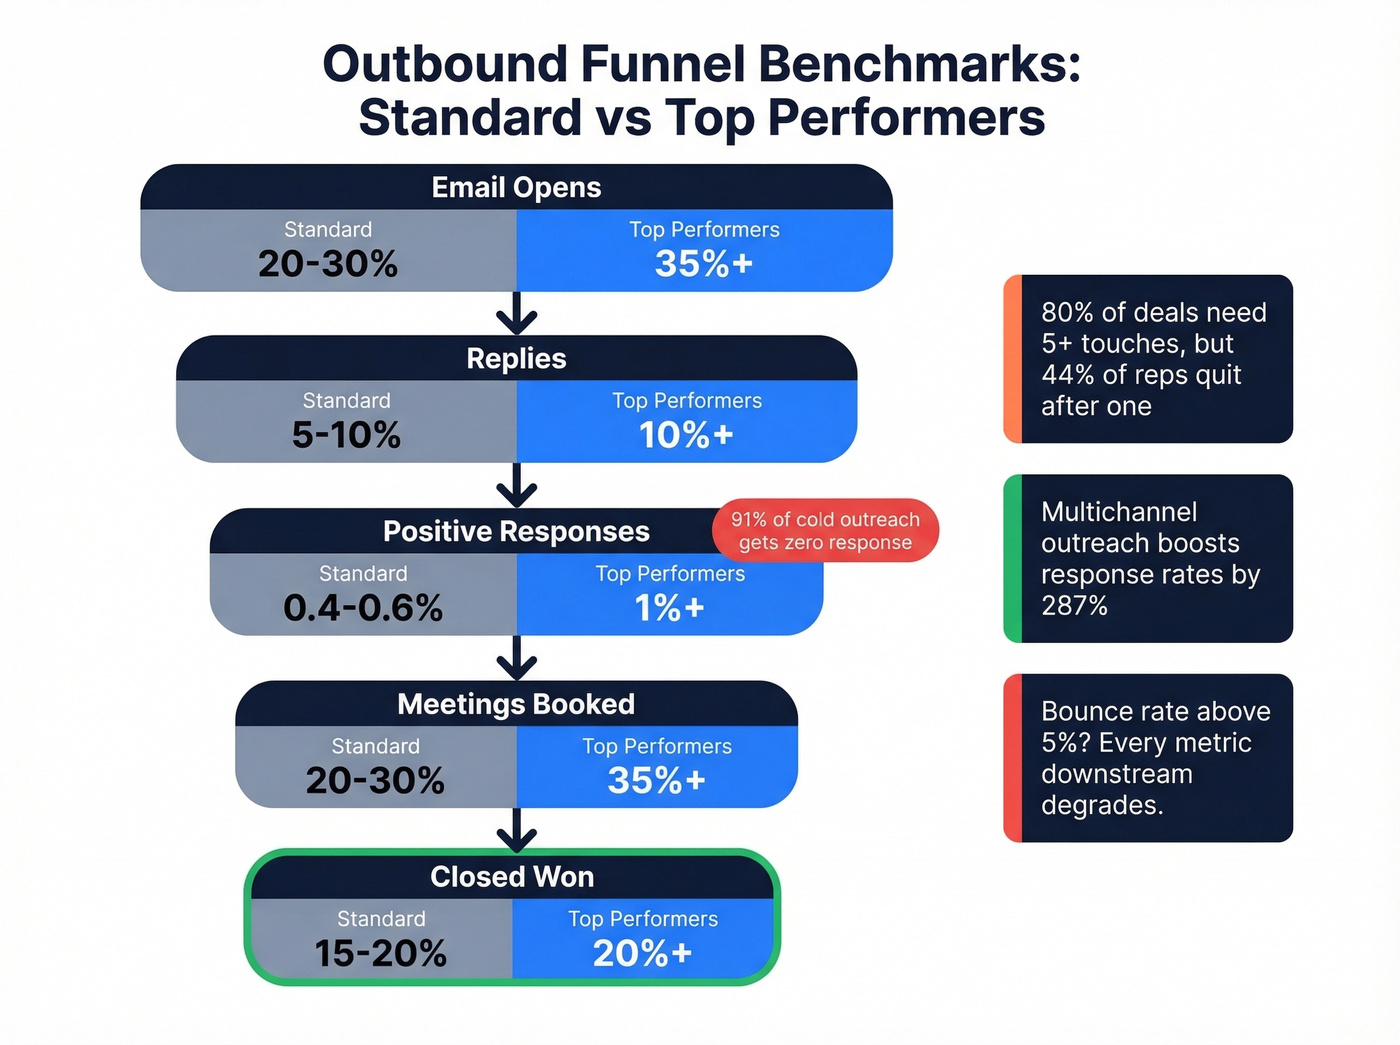
| Metric | Standard | Top Performers |
|---|---|---|
| Open rate | 20-30% | 35%+ |
| Reply rate | 5-10% | 10%+ |
| Positive response | 0.4-0.6% | 1%+ |
| Replies to meetings | 20-30% | 35%+ |
| Demo to close | 15-20% | 20%+ |
91% of cold outreach gets zero response. Cold email reply rates sit at 1-5%, and 80% of deals require five or more touches - yet 44% of reps give up after one. Multichannel outreach increases response rates by 287% versus single-channel. The math is brutal but predictable: outbound works at scale with persistence and clean targeting.
Every number above assumes your emails actually reach inboxes. If your bounce rate is above 5%, downstream metrics deteriorate fast. Snyk's team of 50 AEs saw bounce rates drop from 35-40% to under 5% after switching to Prospeo's 98%-accuracy verified emails, which unlocked 200+ new opportunities per month and grew AE-sourced pipeline by 180%.
If you're trying to lift reply rates without torching deliverability, start with cold email marketing fundamentals and a clean B2B cold email sequence.
PLG and Freemium Benchmarks
39% of Series A startups now enable self-serve, but PLG funnels convert on completely different timelines.
| Metric | Range |
|---|---|
| Freemium to paid | 5-10% |
| Free trial to paid | 15-25% |
| Activation rate | 25-40% |
| Time to value | 1-7 days |
Trial gating matters enormously. Requiring a credit card upfront drops visitor-to-trial conversion from ~10% to ~2%, but trial-to-paid jumps from ~15% to ~50%. You're trading volume for quality. As that r/SaaS founder demonstrated, a 2.1% freemium rate generated $760K ARR - the percentage alone told them nothing without the revenue math behind it.
Skip this section if you're running a pure outbound motion with no self-serve component. These numbers won't apply to your funnel.
Industry-Specific Conversion Rates
First Page Sage's dataset spans 2017-2025 across a roughly 65% B2B client mix. Note: the source tracks SQL-to-Closed rather than Opportunity-to-Closed, so these rates reflect the full journey from qualified lead to signed deal.
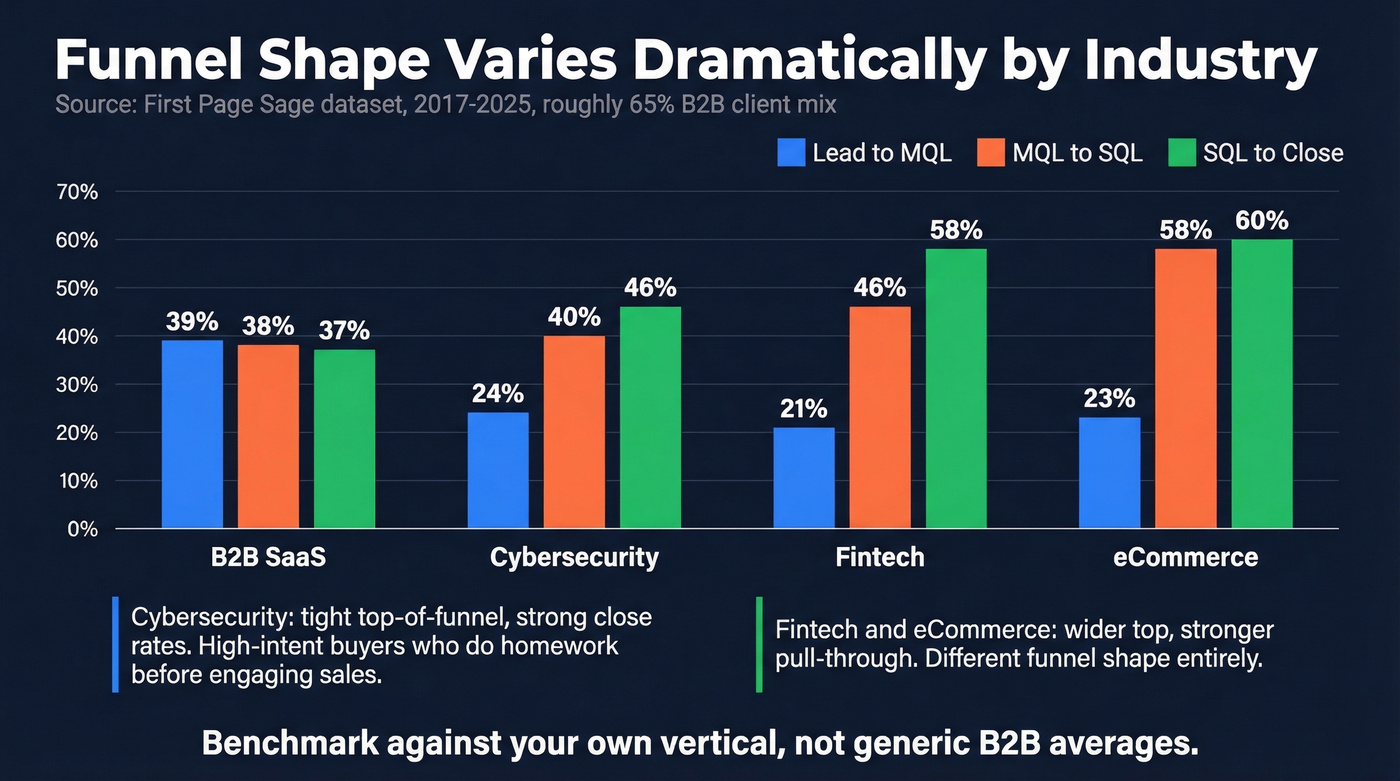
| Industry | Lead to MQL | MQL to SQL | SQL to Close |
|---|---|---|---|
| B2B SaaS | 39% | 38% | 37% |
| Cybersecurity | 24% | 40% | 46% |
| Fintech | 21% | 46% | 58% |
| eCommerce | 23% | 58% | 60% |
Cybersecurity has a tight top-of-funnel but strong close rates - long evaluation cycles with high-intent buyers who've already done their homework before engaging sales. Fintech and eCommerce show the opposite pattern: wider top, stronger pull-through. In our experience, teams that benchmark against their own vertical rather than "B2B averages" make much better resource allocation decisions, because the shape of the funnel varies so dramatically between industries that a single average obscures more than it reveals.
How to Benchmark Correctly
Stop benchmarking against industry averages. Benchmark against your own last quarter first. Use external data as a sanity check, not a target.
Three practices that actually work:
Use 90-day cohorts. Monthly snapshots distort long-cycle B2B funnels. Track a cohort of leads from entry through close over a full quarter. Teams that make this switch see their benchmark accuracy improve immediately because they're no longer comparing leads that entered in January against deals that won't close until April.
Define your denominator explicitly. "Conversion rate" means nothing if you're mixing demo requests with newsletter signups in the same bucket. Pair stage conversion rates with cost to acquire customer and LTV to determine whether your funnel economics actually work.
Measure speed, not just rate. Responding to an inbound lead within 5 minutes makes you 21x more likely to qualify them versus waiting 30 minutes. Only 7% of companies hit that window. Funnel velocity - how fast leads move between stages - matters as much as the conversion percentage. The Salesforce State of Sales report consistently highlights speed-to-lead as a top differentiator among high-performing teams.
The fastest way to improve outbound funnel performance isn't better subject lines - it's cleaner data. Bad emails mean bounces, bounces mean domain reputation damage, and damaged reputation means even your good emails land in spam. Tools like Prospeo refresh their databases on a 7-day cycle specifically to prevent this kind of cascade failure.
If bounce is a recurring issue, use an email bounce rate benchmark and an email deliverability guide to diagnose the root cause before you touch copy.
Outbound reply rates collapse when emails never reach inboxes. Prospeo's 143M+ verified emails refresh every 7 days - not every 6 weeks like competitors. That means your outbound benchmarks reflect real performance, not stale data dragging down every metric downstream.
Hit the top-performer benchmarks with data that actually connects.
FAQ
What's a good end-to-end funnel conversion rate?
Most B2B companies convert 2-5% of leads to closed deals end-to-end. "Good" depends entirely on deal size and channel - a 3% rate on $80K ACV deals is excellent, while the same rate on $5K deals probably won't sustain your business. Always pair conversion with revenue per customer.
How do you calculate stage-by-stage conversion?
Divide leads that advanced to the next stage by the total entering the current stage, within the same cohort. Example: 100 MQLs that produce 38 SQLs = 38%. Use 90-day cohorts for B2B accuracy to avoid distortion from long sales cycles.
Why do benchmarks vary so much between sources?
Different sources use different stage definitions, sample sizes, and time windows. Many widely cited numbers trace back to reports with no verifiable original source. Always check whether the benchmark's "MQL" matches your definition before comparing.
What's a good MQL-to-SQL conversion rate?
The B2B average is 32-42%. Above 50% is strong and common with SEO-sourced leads. Below 25% usually signals an MQL definition problem - leads promoted too early, not a sales team issue. Tighten your scoring criteria before adding headcount.
How does bad contact data affect funnel conversion?
Bounce rates above 5% degrade every downstream metric. Deliverability drops, sender reputation suffers, and reply rates crater. Snyk's team saw AE-sourced pipeline increase 180% after cleaning up their data quality - the funnel math didn't change, but the inputs finally matched reality.