Sales Metrics to Track: Benchmarks, Formulas, and What Good Looks Like
69% of B2B reps missed quota last year. Only 7% of sales orgs hit forecast accuracy above 90%. Reps spend just 28% of their time actually selling. Those three numbers tell you everything about why most sales dashboards are broken - they measure the wrong things, at the wrong cadence, with data nobody trusts.
The fix isn't more metrics. It's fewer, better ones - with benchmarks that tell you whether your numbers are good, bad, or average.
Start With Five
If you're resetting a bloated dashboard, these are the sales metrics to track before anything else:
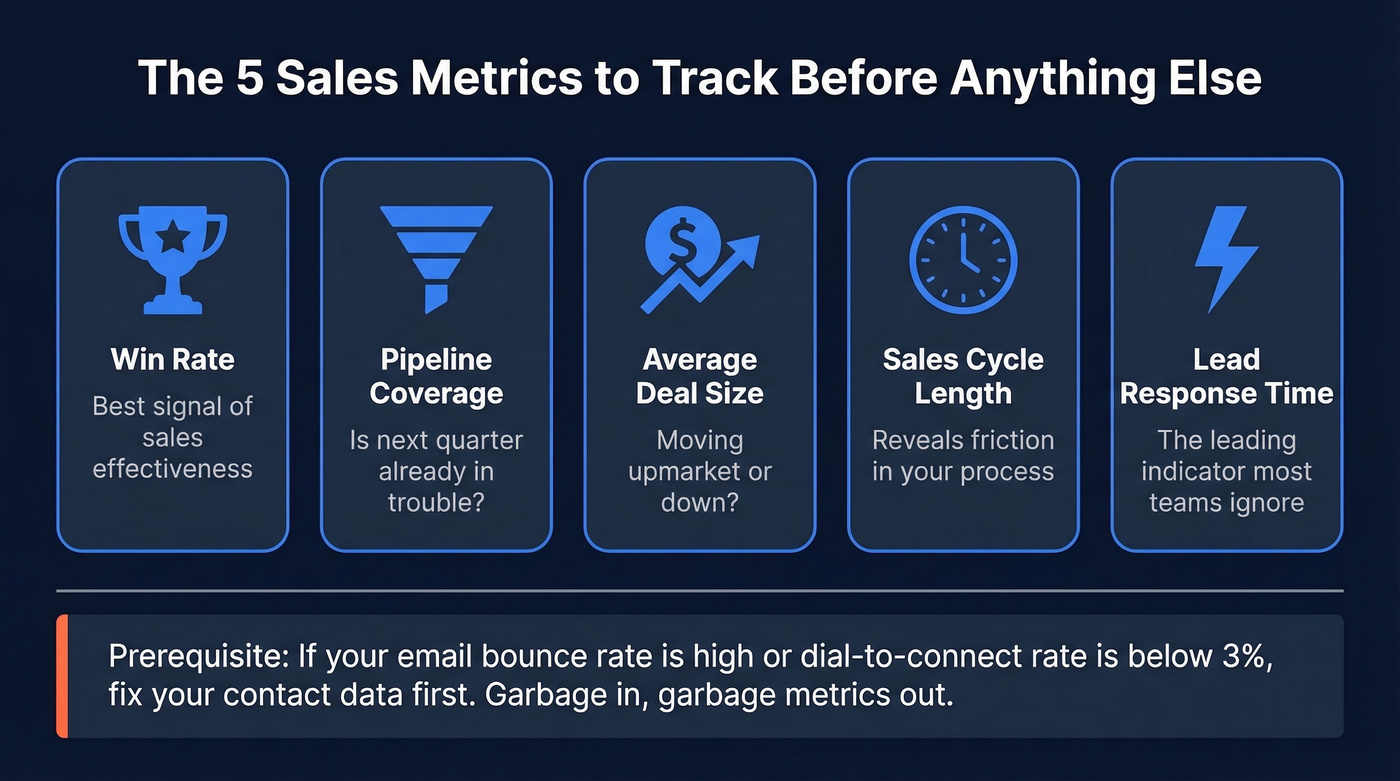
- Win rate - the single best signal of sales effectiveness
- Pipeline coverage - tells you if next quarter is already in trouble
- Average deal size - tracks whether you're moving upmarket or down
- Sales cycle length - reveals friction in your process
- Lead response time - the leading indicator most teams ignore
Everything else is a refinement on these five. But there's a prerequisite nobody talks about: your metrics are only as good as your underlying data. If your email bounce rate is high or your dial-to-connect rate sits around 3% or lower, audit your contact data before you optimize anything else. Garbage in, garbage metrics out.
Sales Metrics vs. KPIs
These terms get used interchangeably, and it causes real confusion in planning meetings. A metric is any measurement - calls made, emails sent, deals closed. A KPI is a metric you've chosen to manage against a target. All KPIs are metrics, but not all metrics are KPIs.
The distinction matters because tracking 40 metrics creates noise. Promoting 6-8 of them to KPI status - with targets, owners, and review cadences - creates accountability. The rest stay in your data warehouse for ad hoc analysis, not on your weekly dashboard.
Leading vs. Lagging Indicators
Revenue is a lagging indicator. By the time you see it, the work that created it happened weeks or months ago. Managing a sales team on revenue alone is like driving by staring in the rearview mirror.
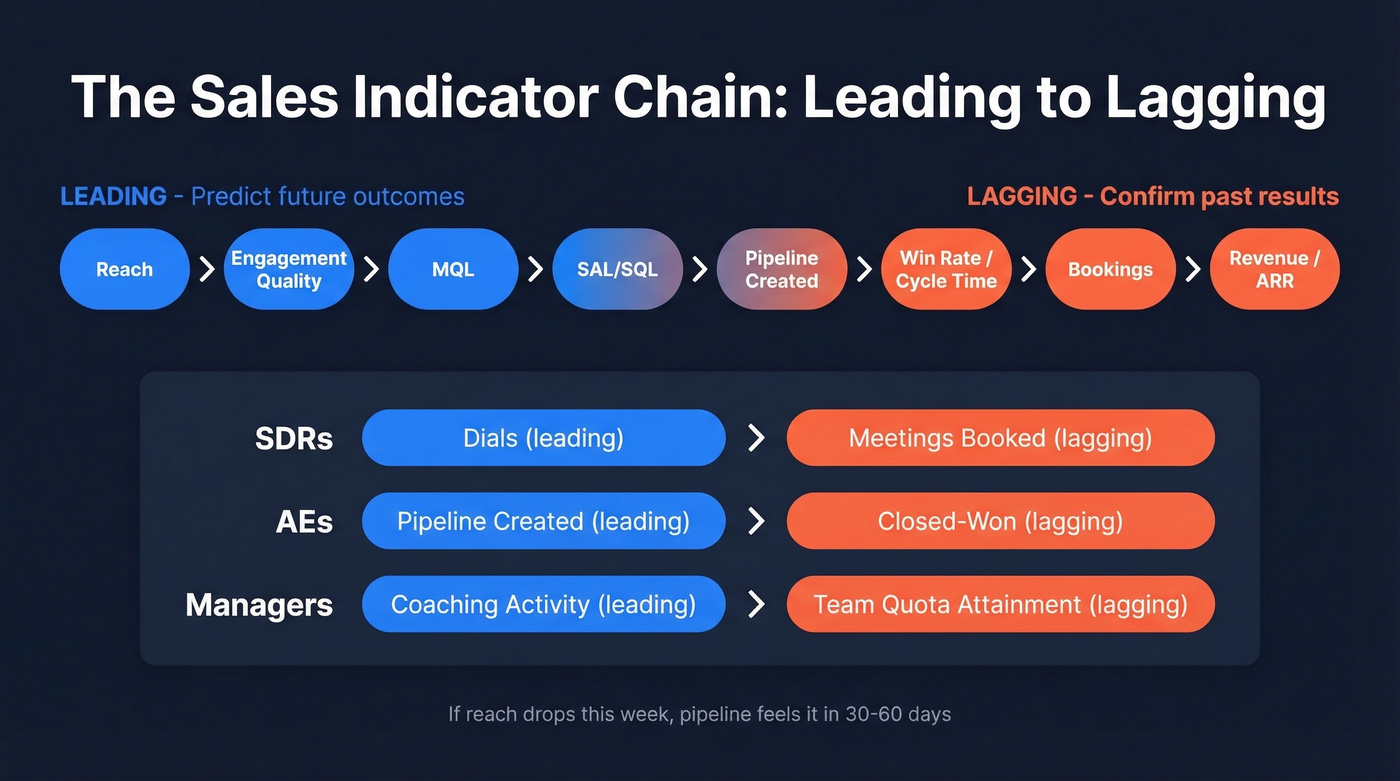
Leading indicators predict future outcomes. The Balanced Scorecard framework popularized this concept, and it maps cleanly to B2B sales. Think of it as an indicator chain: reach → engagement quality → MQL → SAL/SQL → pipeline created → win rate/cycle time → bookings → revenue/ARR. Each link predicts the next. If your reach drops this week, your pipeline will feel it in 30-60 days.
Every role should track at least one leading and one lagging indicator. SDRs track dials (leading) and meetings booked (lagging). AEs track pipeline created (leading) and closed-won (lagging). Managers track coaching activity (leading) and team quota attainment (lagging).
The Metric Overload Problem
The biggest threat to your metrics program isn't missing data - it's too much of it. 42% of reps feel overwhelmed by too many tools, and overwhelmed sellers are 45% less likely to attain quota.
A thread on r/sales about "the tyranny of metrics" nails the practitioner frustration: activity quotas without quality gates produce vanity numbers. Reps game dials. Managers react to dashboards without understanding interdependencies. Everyone's busy, nobody's effective.
The fix is what that thread calls "tension metrics" - balancing time, quality, and cost so optimizing one doesn't break the others. Track call volume, but pair it with conversation rate. Track meetings booked, but pair it with show rate. We've found these paired measurements are how teams move beyond vanity reporting.
Cap it at 8-10 per role. If a metric doesn't change a decision, it doesn't belong on the dashboard.
Key Sales Performance Metrics in 2026
Activity Metrics
Activity metrics are the leading indicators that predict everything downstream. They're also the easiest to game, which is why pairing them with quality gates matters.
Calls per day: 50-100 dials/day is the standard range for outbound SDRs. Focused reps spend about 2.5 hours on the phone daily.
Dial-to-connect rate: Target 3-10%. Below 3%? The problem is your data, not your reps. Verified mobile numbers dramatically change this equation - mobile pickup rates run around 30%, which is the difference between 2 conversations a day and 10.
Conversations per day: Aim for 3-5 quality conversations (defined as >2 minutes). If your connect-to-conversation rate is below 25%, reps need skill coaching.
Emails sent: Track volume, but pair it with reply rate and bounce rate. High volume with a high bounce rate is actively damaging your domain. (If you're tightening outbound, start with email deliverability basics.)
Follow-up cadence: Well-qualified leads should see 10+ contact attempts. Leads with fewer than 5 attempts are wasted money - you've already paid to generate them, so work them properly. If you need a starting point, use proven sales follow-up templates.
Lead response time: This is the most underrated activity metric. Contacting leads within 5 minutes makes you 21x more likely to qualify them versus waiting 30 minutes. The average response time across industries is still 42 hours, and 30% of leads never get contacted at all. If you fix nothing else, fix this.
Pipeline Metrics
Pipeline coverage ratio: The standard benchmark is 3x-5x, meaning you need $3-5 in pipeline for every $1 of quota. Enterprise teams with lower win rates need 4x-5x. Transactional sales can get away with 2x-3x. (For more ranges and definitions, see sales pipeline benchmarks.)
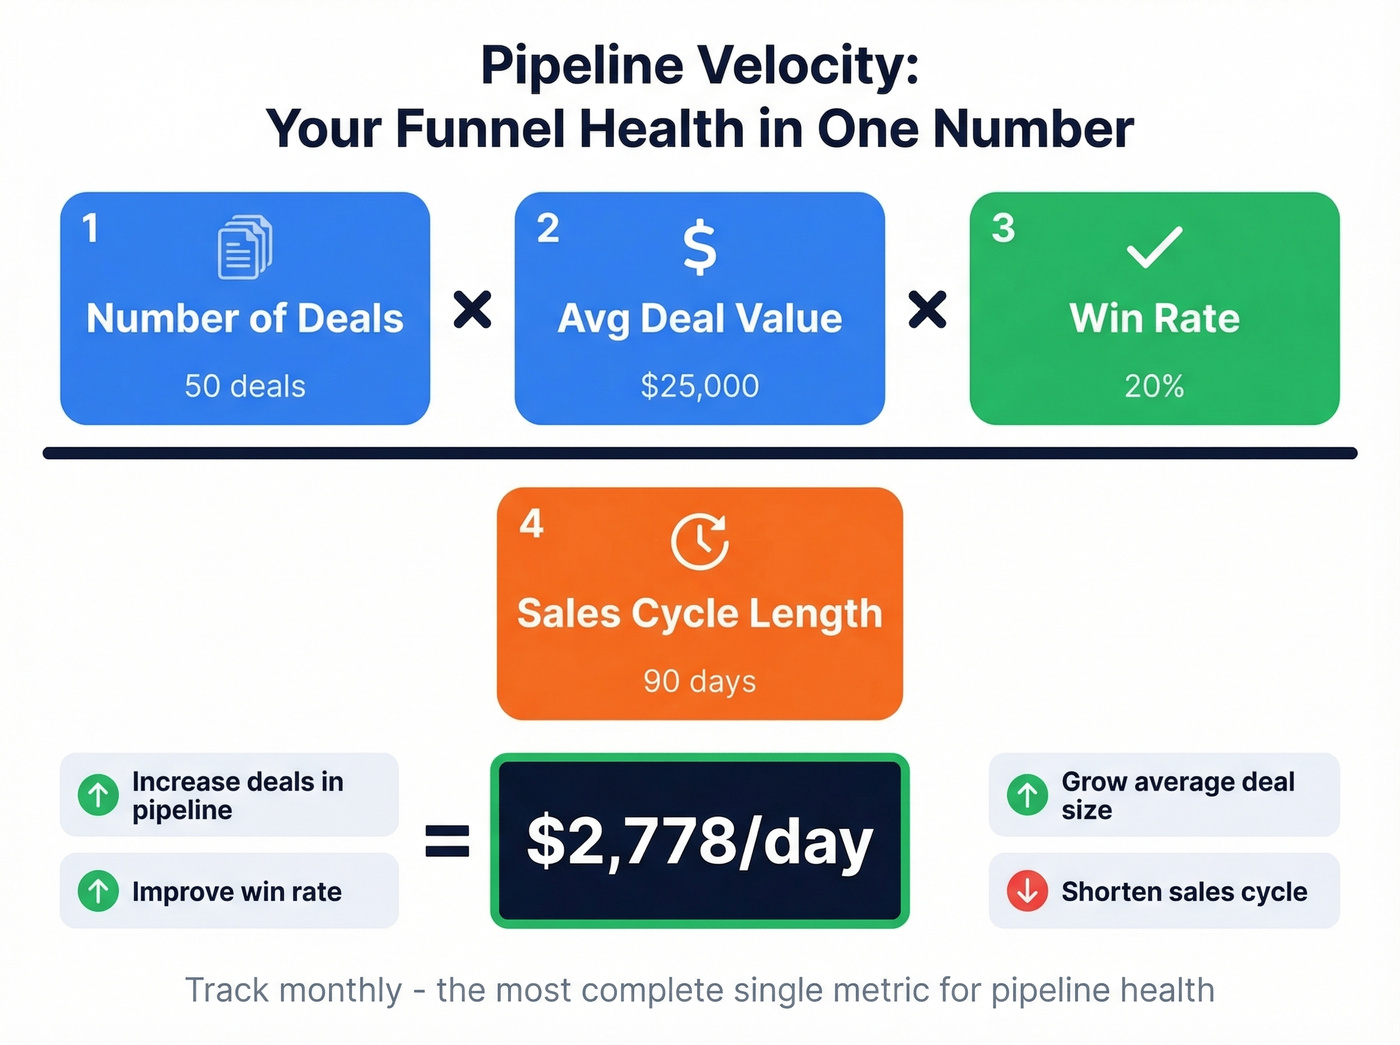
Pipeline velocity: (Number of deals x average deal value x win rate) / sales cycle length. This single formula captures the health of your entire funnel. Track it monthly. Of all the performance indicators you could monitor, pipeline velocity gives you the most complete picture in a single number.
Deal slippage: What percentage of deals push past their expected close date? Rising slippage is an early warning that your pipeline is softer than it looks. (This is a core input to pipeline health.)
Forecast accuracy: Only 7% of sales orgs achieve 90%+ accuracy. If yours is below 70%, your pipeline stages need recalibration. Well-qualified deals are 6.3x more likely to close and close 21.6% faster, per Ebsta's analysis of 655,000+ B2B opportunities. Qualification isn't a nice-to-have - it's the single biggest lever on forecast accuracy. If you're standardizing qualification, consider a framework like MEDDIC sales qualification.
Performance Metrics
Win rate: The average B2B win rate is ~21% across all opportunities and ~29% for qualified opportunities only. Averages hide enormous variation by deal size and motion, though - see the benchmark tables below.
One critical warning: excluding "no decision" outcomes inflates your win rate by 10-15 percentage points. "No decision" represents 40-60% of enterprise pipeline. If you aren't counting it, your win rate is lying to you.
Conversion rate: Overall funnel conversion (visitor to customer) typically falls between 3-5% for B2B. High performers beat this through faster follow-up and tighter qualification. (If you want a full-stage view, track funnel metrics.)
Average deal size: Track this monthly. A rising average means you're moving upmarket or bundling better. A falling average signals discounting pressure.
Quota attainment: Roughly 40-60% of reps hit quota in a given period, depending on org maturity and how aggressively targets are set.
Sales cycle length: SMB deals close in 14-45 days. Mid-market runs 45-120 days. Enterprise stretches to 120-270+ days. If your cycle is lengthening quarter over quarter, something in your process is creating friction - and it's worth diagnosing whether the bottleneck is in discovery, legal review, or multi-threading across the buying committee.
Revenue and Efficiency Metrics
ARR, MRR, and revenue per rep tell you whether you're scaling efficiently or just adding headcount. Review them monthly or quarterly - not daily. Daily revenue watching creates anxiety, not insight.
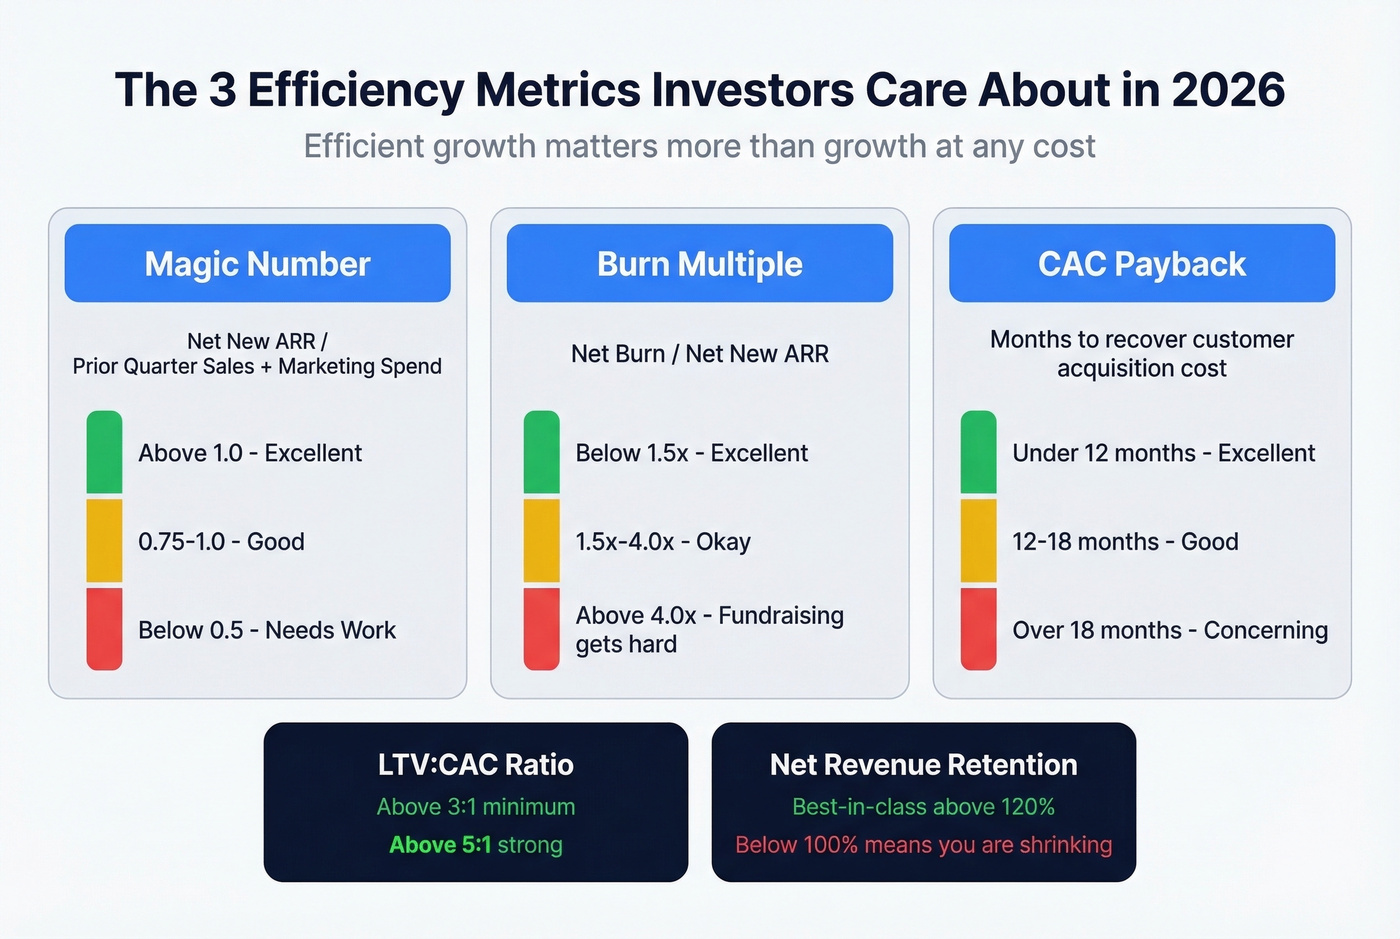
In 2026, investors care about efficient growth more than growth at any cost. Three metrics dominate board conversations:
Magic Number: Net new ARR / prior quarter's sales and marketing spend. Above 1.0 is excellent. Between 0.75 and 1.0 is good. Below 0.5 needs work.
Burn Multiple: Net burn / net new ARR. Below 1.5x is excellent. Above 4.0x will make fundraising difficult.
CAC Payback: The metric that determines whether your unit economics work at scale. Under 12 months is excellent, 12-18 months is good, anything over 18 months is concerning. (If you want the full breakdown, see cost to acquire customer.)
Customer Metrics
LTV:CAC ratio: Greater than 3:1 is the minimum for a healthy business. Greater than 5:1 is strong. Below 3:1 means you're spending too much to acquire customers relative to what they're worth.
Net Revenue Retention (NRR): Best-in-class is above 120%. Below 100% means you're shrinking even before churn - expansion revenue isn't covering downgrades and cancellations.
Gross Revenue Retention (GRR): Enterprise targets 95-98%. Mid-market 90-95%. SMB 80-90%. GRR strips out expansion, so it's a purer measure of customer satisfaction. (If you're diagnosing retention, start with churn analysis.)
You read it above: a dial-to-connect rate below 3% means your data is the problem, not your reps. Prospeo's 125M+ verified mobile numbers deliver a 30% pickup rate - turning 2 conversations a day into 10. Your activity metrics transform overnight when every dial reaches a real person.
Stop optimizing metrics built on bad data. Fix the source.
Benchmark Reference Tables
Win Rate by ACV and Motion
| Segment / Motion | ACV Range | Avg Win Rate | Cycle Length |
|---|---|---|---|
| SMB | <$10K | ~31% | 14-45 days |
| Mid-market | $10-50K | ~24% | 45-120 days |
| Upper mid | $50-100K | ~18% | 90-180 days |
| Enterprise | >$100K | ~15% | 120-270+ days |
| Warm / relationship-led | Varies | 30-40% | Shorter |
| Cold outbound enterprise | >$50K | 10-18% | Longer |
| Known contacts | Varies | ~37% | Shorter |
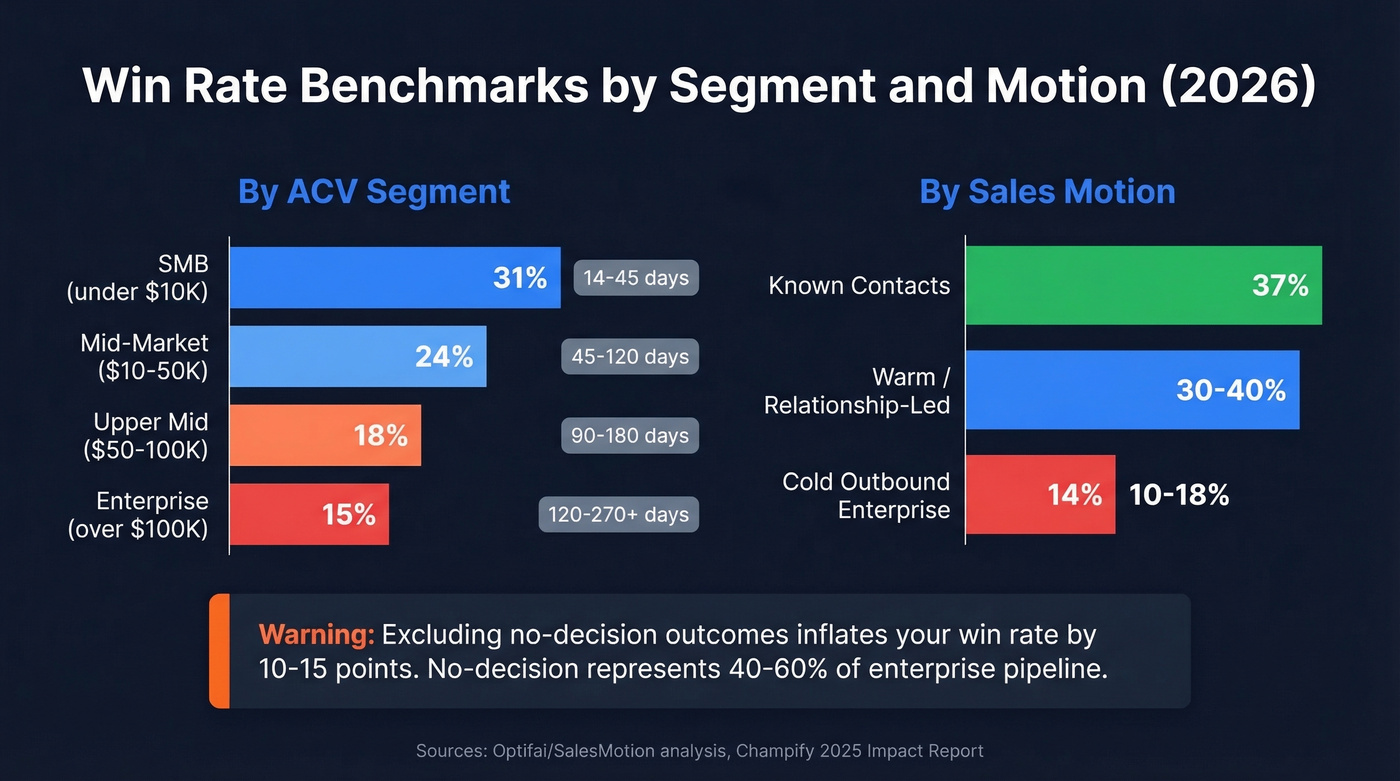
ACV-based rates from Optifai/SalesMotion analysis; motion-based rates from Champify's 2025 Impact Report. Use the row that matches your motion.
Funnel Conversion: Top of Funnel
| Channel | Visitor→Lead | Lead→MQL | MQL→SQL |
|---|---|---|---|
| SEO | 2.10% | 41% | 51% |
| PPC | 0.70% | 36% | 26% |
| 2.20% | 38% | 30% | |
| 1.30% | 43% | 46% | |
| Webinar | 0.90% | 44% | 39% |
Funnel Conversion: Bottom of Funnel
| Channel | SQL→Opp | Opp→Close |
|---|---|---|
| SEO | 49% | 36% |
| PPC | 38% | 35% |
| 41% | 39% | |
| 48% | 32% | |
| Webinar | 42% | 40% |
Data from FirstPageSage's SaaS conversion study across 50+ B2B SaaS companies.
SaaS Efficiency Benchmarks
| Metric | Excellent | Good | Concerning |
|---|---|---|---|
| Magic Number | >1.0 | 0.75-1.0 | <0.5 |
| Burn Multiple | <1.5x | 1.5-2.5x | >4.0x |
| NRR | >120% | 110-120% | <100% |
| GRR (Enterprise) | 95-98% | 90-95% | <90% |
| CAC Payback | <12 months | 12-18 months | >18 months |
| LTV:CAC | >5:1 | 3-5:1 | <3:1 |
Working Backward From Quota
Benchmarks are useless if you can't connect them. Let's walk through the math that makes them actionable.
Your quarterly quota is $500K. Average deal size is $25K, so you need 20 closed deals. At a 20% win rate, that's 100 qualified opportunities. At 3x pipeline coverage, you need $1.5M entering the quarter. If your pipeline sits at $900K, you're short - and you know it in January, not March.
Run this exercise for every rep, every quarter. The numbers will tell you exactly where to invest: more pipeline generation, better qualification, or faster close cycles. This is where measurement stops being abstract and starts driving resource allocation.
Which Metrics by Role
SDR / BDR
SDRs live in activity and early-funnel conversion. Here's the core dashboard:
| Metric | Target |
|---|---|
| Dials/day | 50-100 |
| Dial-to-connect rate | 3-10% |
| Quality conversations/day | 3-5 |
| Cold call meeting conversion | 2-5% |
| Meeting show rate | 50-60% (top performers: 90%) |
Ramp time averages 4-6 months. Don't judge a new SDR on month-two numbers - judge them on whether their leading indicators are trending the right direction. (If you're building the motion, start with these sales prospecting techniques.)
Account Executive
AEs own the middle and bottom of the funnel. Their key measurements are win rate, average deal size, sales cycle length, personal pipeline coverage, and quota attainment.
The most underused AE metric is stage-of-loss tracking. 63% of losses happen before needs assessment, which means most deals die in discovery, not negotiation. If your AEs are losing early, that's a qualification and discovery problem - no amount of closing technique will fix it. We've seen teams cut early-stage losses by 20% just by recording and reviewing the first five minutes of discovery calls.
Sales Manager
Managers track team aggregates: team win rate, pipeline coverage, forecast accuracy, and rep ramp time. But the coaching-specific metrics matter most - track meeting show rate improvement over time, stage-of-loss patterns, and whether reps are improving their connect-to-conversation rates month over month.
Here's the thing: if you're reviewing dashboards but not changing coaching behavior based on what you see, you're doing performance reporting, not management. A rep whose win rate dropped 5 points this quarter doesn't need a PIP. They need someone to sit in on three discovery calls and diagnose the problem.
VP / CRO
Revenue leadership lives in strategic and efficiency metrics: ARR, MRR, NRR/GRR, Magic Number, Burn Multiple, CAC payback, and sales linearity - how evenly revenue closes across the quarter versus hockey-sticking in the last two weeks. Skip the activity-level detail at this altitude; it's noise. These are the indicators that determine board confidence and fundraising outcomes.
Building a Dashboard That Works
Most dashboards don't get used. 40% of users rate their dashboards 3/5 or lower, and 72% regularly export data to Excel because the dashboard doesn't answer their actual questions. When dashboards show stale data, 67% of users lose confidence in analytics entirely. Meanwhile, 70% of small businesses still track sales in spreadsheets - which guarantees stale data and inconsistent definitions.
The dashboards that actually drive decisions share a few traits. They serve one purpose - a pipeline review dashboard and a rep activity dashboard are two different things, and combining them helps nobody. They cap visualizations at 5-7, because if it takes more than 5 seconds to find the answer, the dashboard is too complex. They're role-specific: your CRO doesn't need daily dial counts, and your SDR doesn't need burn multiple. And they refresh at the cadence the team reviews - a dashboard that updates weekly when your team checks it daily is worse than no dashboard at all.
Five Mistakes That Corrupt Your Data
1. Dashboard theater. Tracking 30+ metrics because "more data is better." It isn't. Cap it at 8-10 per role and ruthlessly cut anything that doesn't change a decision.
2. Inconsistent definitions. The classic: win rate denominator drift. Does your win rate include "no decision" outcomes or not? If two managers define it differently, your team-level number is meaningless. Lock definitions in your CRM and document them.
3. Ignoring data quality. If your email bounce rate is 35% and your connect rate hovers around 3%, every downstream metric is lying to you. Activity numbers look inflated because half the outreach never reaches anyone. Conversion rates look deflated because the denominator includes dead contacts. Before you optimize your funnel, audit your data. Prospeo verifies emails at 98% accuracy and refreshes records every 7 days - compared to the 6-week industry average. One customer, Meritt, cut their bounce rate from 35% to under 4% and tripled pipeline from $100K to $300K per week. If your bounce rate is consistently above ~4%, start there.
4. No benchmarks, no context. A 22% win rate means nothing without knowing that the B2B average is 21% and enterprise deals close at 15%. Without benchmarks, every number is just a number.
5. Stale dashboards nobody checks. A dashboard that hasn't been updated in two weeks isn't a tool - it's furniture. Set automated refresh schedules and kill any dashboard that hasn't been viewed in 30 days.
High email volume with a high bounce rate destroys your domain and your metrics. Prospeo's 98% email accuracy and 7-day data refresh cycle mean your outbound numbers actually reflect rep performance - not data decay. Teams using Prospeo cut bounce rates from 35%+ to under 4%.
Track metrics you can trust. Start with data you can trust.
FAQ
What sales metrics should you track first?
Start with five that cover the full funnel: win rate, pipeline coverage, average deal size, sales cycle length, and lead response time. These give you enough signal to diagnose problems without drowning in data. Once those are stable, layer in role-specific KPIs.
What's the difference between sales metrics and KPIs?
Metrics are any quantifiable measurement - calls made, deals closed. KPIs are the specific metrics you've promoted to targets with owners and review cadences. Stick to 6-8 KPIs per role; everything else is background data for ad hoc analysis.
How many metrics should a sales team monitor?
Eight to ten per role, max. Activity metrics get reviewed daily, performance metrics weekly, strategic metrics quarterly. If a metric doesn't change what someone does tomorrow, cut it from the dashboard.
What's a good win rate for B2B sales?
The average is ~21% across all opportunities, ~29% for qualified only. SMB deals close at ~31%, enterprise at ~15%. Cold outbound runs 10-18%, warm relationships hit 30-40%. Always include "no decision" in your denominator - otherwise you're flattering yourself.
How does data quality affect sales reporting?
Bad contact data inflates activity metrics and deflates conversion rates. If 30% of your emails bounce, your "emails sent" number is fiction. In our experience, cleaning up contact data is the single fastest way to make every other metric on your dashboard trustworthy.