Sales Pipeline Analysis in Excel - Formulas, PivotTables & Dashboard
Your CEO asks why the forecast missed again, and all you've got is a spreadsheet with deal names and vibes. That's not pipeline analysis. That's a contact list with wishful thinking.
This guide walks you through real sales pipeline analysis in Excel: the formulas, PivotTables, benchmarks, and review cadence that turn a flat spreadsheet into a forecasting engine you can actually defend.
Why Most Pipeline Templates Fail
56% of sales teams rate their own pipeline management as poor or neutral. Most "pipeline templates" floating around are formatted tables with conditional formatting - they look nice but tell you nothing.
And most "forecasting examples" online just tell you to click a button in your CRM. If you're running analysis in a spreadsheet because your team doesn't have a CRM, or because you need to defend the numbers yourself, you need actual formulas. Real analysis exposes where deals stall, which reps convert, and whether your forecast is defensible or delusional. Companies that get this right see 28% higher revenue growth. The rest of this guide builds each piece step by step.
What You Need
To do actual pipeline analysis - not just tracking - you need three things:
- A tidy dataset with 9 columns (no merged cells, no color-coded stages)
- Six formulas covering expected value, win rate, stage conversion, stage aging, velocity, and coverage ratio
- PivotTables with slicers for instant filtering by rep, stage, and time period
Small teams on r/smallbusiness consistently ask for the same four metrics: total revenue, transaction count, average sale, and performance by salesperson. The setup below delivers all four plus the forecasting layer most templates skip entirely.
Set Up Your Excel Dataset
Every row is one deal. Every column is one variable. No merged cells, no subtotals embedded in the data range, no blank rows.
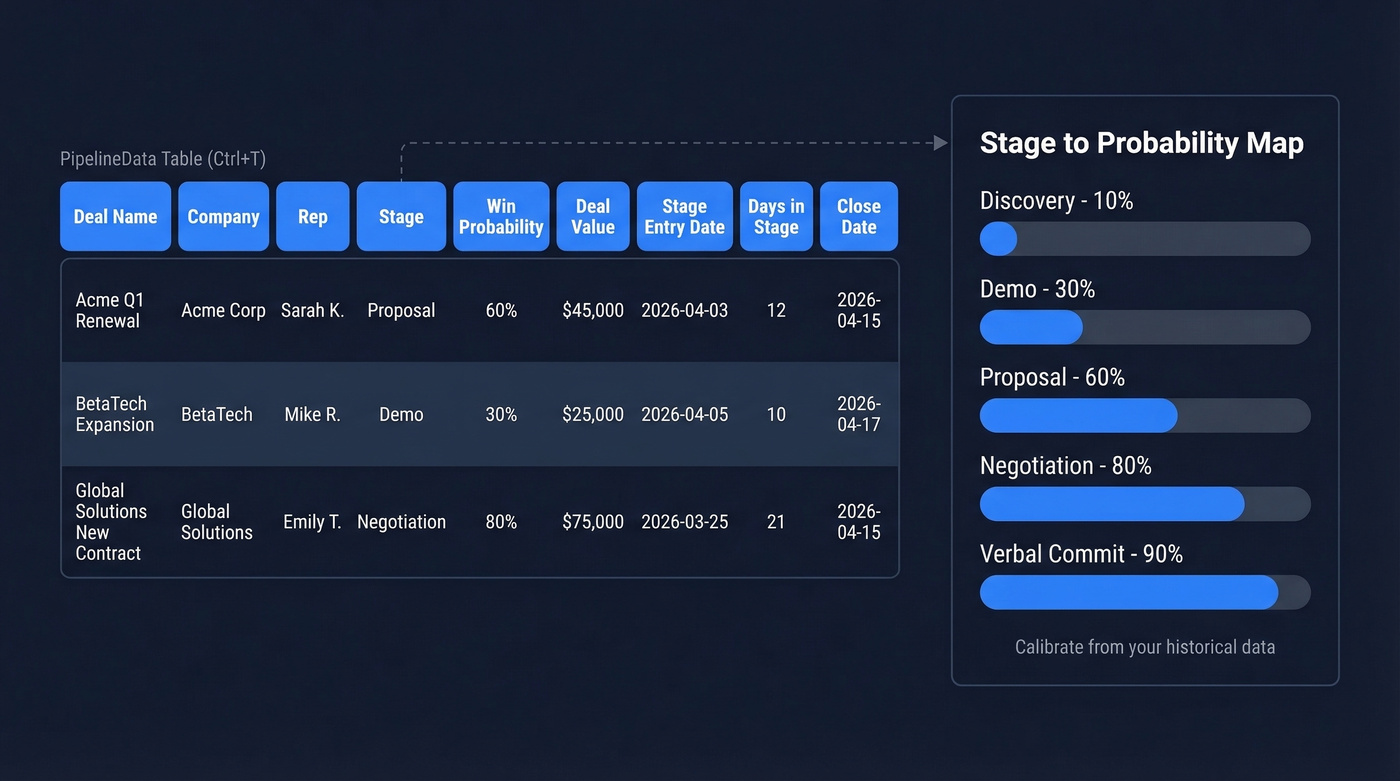
| Column | Example |
|---|---|
| Deal Name | Acme Q1 Renewal |
| Company | Acme Corp |
| Rep | Sarah K. |
| Stage | Proposal |
| Win Probability | 60% |
| Deal Value | $45,000 |
| Stage Entry Date | 2026-04-03 |
| Days in Stage | 12 |
| Close Date | 2026-04-15 |
Select your data and press Ctrl+T to convert it into an Excel Table. Name it PipelineData - structured references like PipelineData[Deal Value] auto-expand when you add rows, which saves you from fixing broken formulas every week.
You'll also need a stage-to-probability mapping. Start here and calibrate from your historical data:
| Stage | Default Probability |
|---|---|
| Discovery | 10% |
| Demo | 30% |
| Proposal | 60% |
| Negotiation | 80% |
| Verbal Commit | 90% |
Six Essential Pipeline Formulas
Don't start with a dashboard. Start with a clean dataset and these six formulas. Dashboards built on messy data create confident-looking lies.
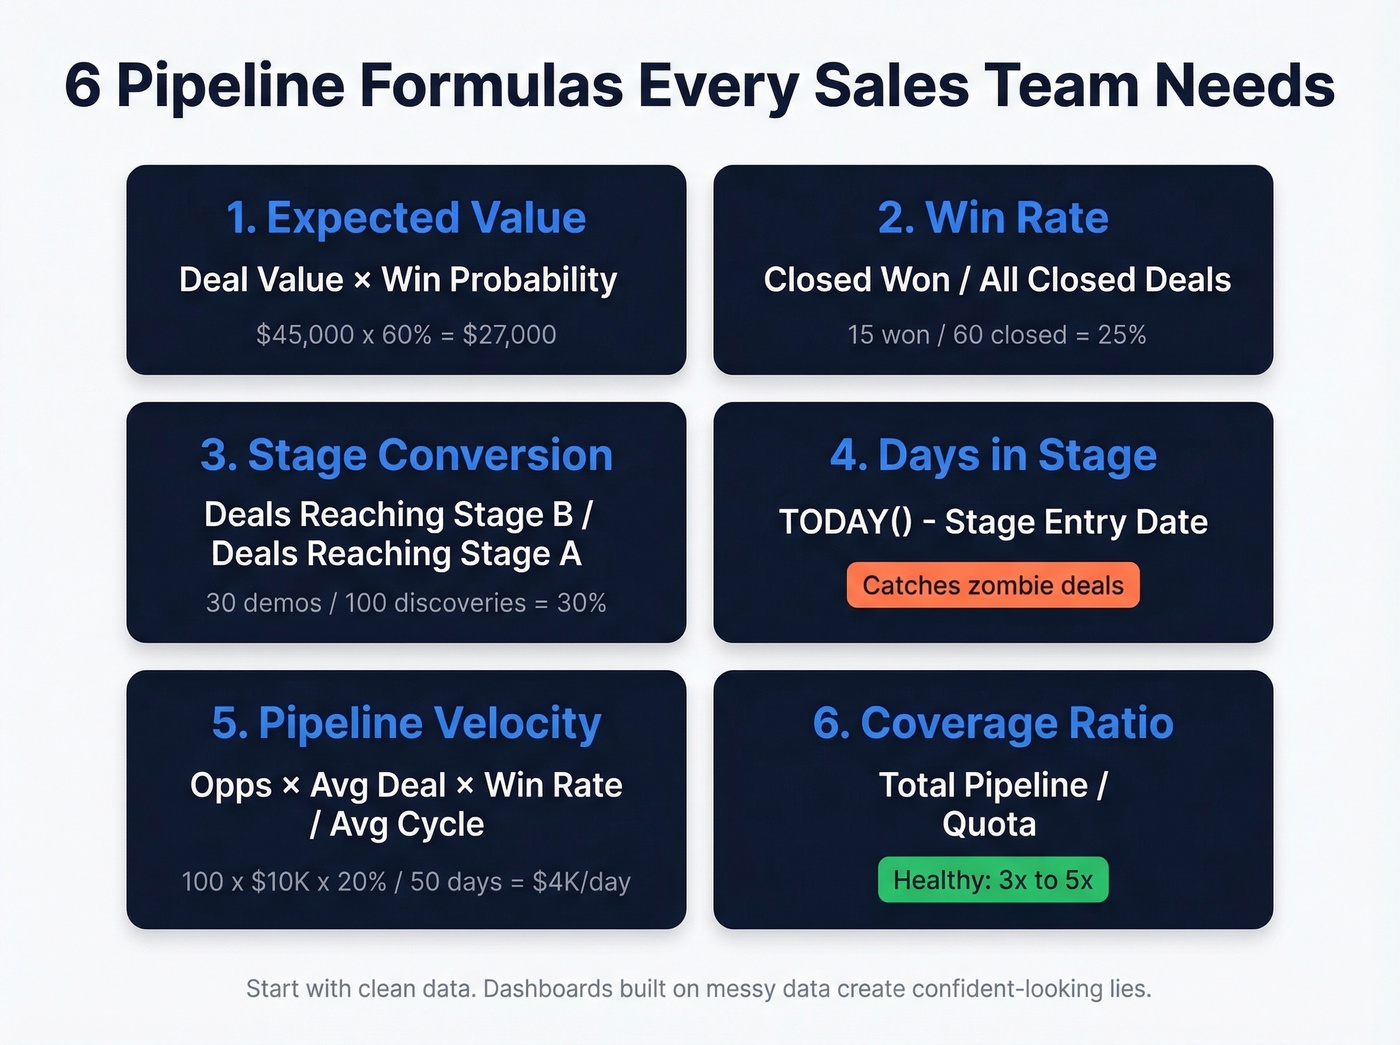
1. Expected Value
The foundation of weighted forecasting:
=[@[Deal Value]]*[@[Win Probability]]
A quick worked example: if your raw pipeline totals $1.5M but the probability-weighted expected value is $685K, that gap is your reality check. The weighted number is your forecast. The raw number is a fantasy.
2. Win Rate
Closed-won divided by all closed deals:
=COUNTIF(PipelineData[Stage],"Closed Won")/(COUNTIF(PipelineData[Stage],"Closed Won")+COUNTIF(PipelineData[Stage],"Closed Lost"))
If you want to benchmark and improve it, use a dedicated sales win rate view alongside your pipeline sheet.
3. Stage Conversion
This one trips people up. If you only track current stage, what you can calculate cleanly is stage distribution - how your pipeline is stacked today - not true conversion rates. For real stage-to-stage conversion, you need stage history.
A simple conversion-friendly setup: add helper columns like Reached Demo and Reached Proposal (TRUE/FALSE), then calculate:
=COUNTIF(PipelineData[Reached Demo],TRUE)/COUNTIF(PipelineData[Reached Discovery],TRUE)
4. Days in Stage
How long deals sit before advancing or dying:
=TODAY()-[@[Stage Entry Date]]
This is the formula that catches zombie deals - the ones nobody's actively working but nobody wants to kill either.
5. Pipeline Velocity
Revenue throughput per day:
=(Opportunities x Avg Deal Value x Win Rate) / Avg Sales Cycle
Worked example: 100 x $10,000 x 20% / 50 days = $4,000/day. That single number tells you more about pipeline health than any stage-by-stage breakdown.
6. Coverage Ratio
Total pipeline divided by quota. Healthy benchmarks: 3x for mature pipelines, 4-5x for early-stage or lower win-rate teams. If you're below 3x with 45 days left in the quarter, start panicking productively.
If you need help setting targets, align this with your pipeline goals so coverage is tied to plan, not vibes.
Your coverage ratio tanks when half your pipeline is built on bad contact data. Prospeo delivers 98% verified emails and 125M+ direct dials so every deal in your spreadsheet maps to a real buyer you can actually reach.
Fix the data before you fix the dashboard.
PivotTables That Answer Real Questions
We've found three PivotTable setups cover about 90% of what leadership actually asks in pipeline reviews.
Pipeline $ by Stage. Rows: Stage. Values: Sum of Expected Value. This tells you whether your pipeline is top-heavy (lots of early-stage hope) or bottom-heavy (deals about to close or die). A healthy pipeline looks like a gentle funnel, not a mushroom cloud at the top. (If you want a cleaner stage model, see deal stages.)
Win Rate by Rep. Rows: Rep. Values: Count of Closed Won / Count of all Closed deals. Use a calculated field or a helper column. This is the metric that separates coaching conversations from guessing, and it's the one most managers avoid because the answers are uncomfortable.
Cycle Length by Segment. Rows: Company Segment or deal size bucket. Values: Average of Days to Close. If enterprise deals take 120 days and SMB deals take 30, blending them into one "average cycle" is meaningless - it'll make your enterprise forecast look late and your SMB forecast look early. (For benchmarks and fixes, compare against sales cycle length.)
Add Slicers (Insert > Slicer) for Rep, Stage, and Quarter. Connect them to all three PivotTables via Report Connections so one click filters everything. Use GETPIVOTDATA to pull numbers into KPI cards at the top of your dashboard sheet.
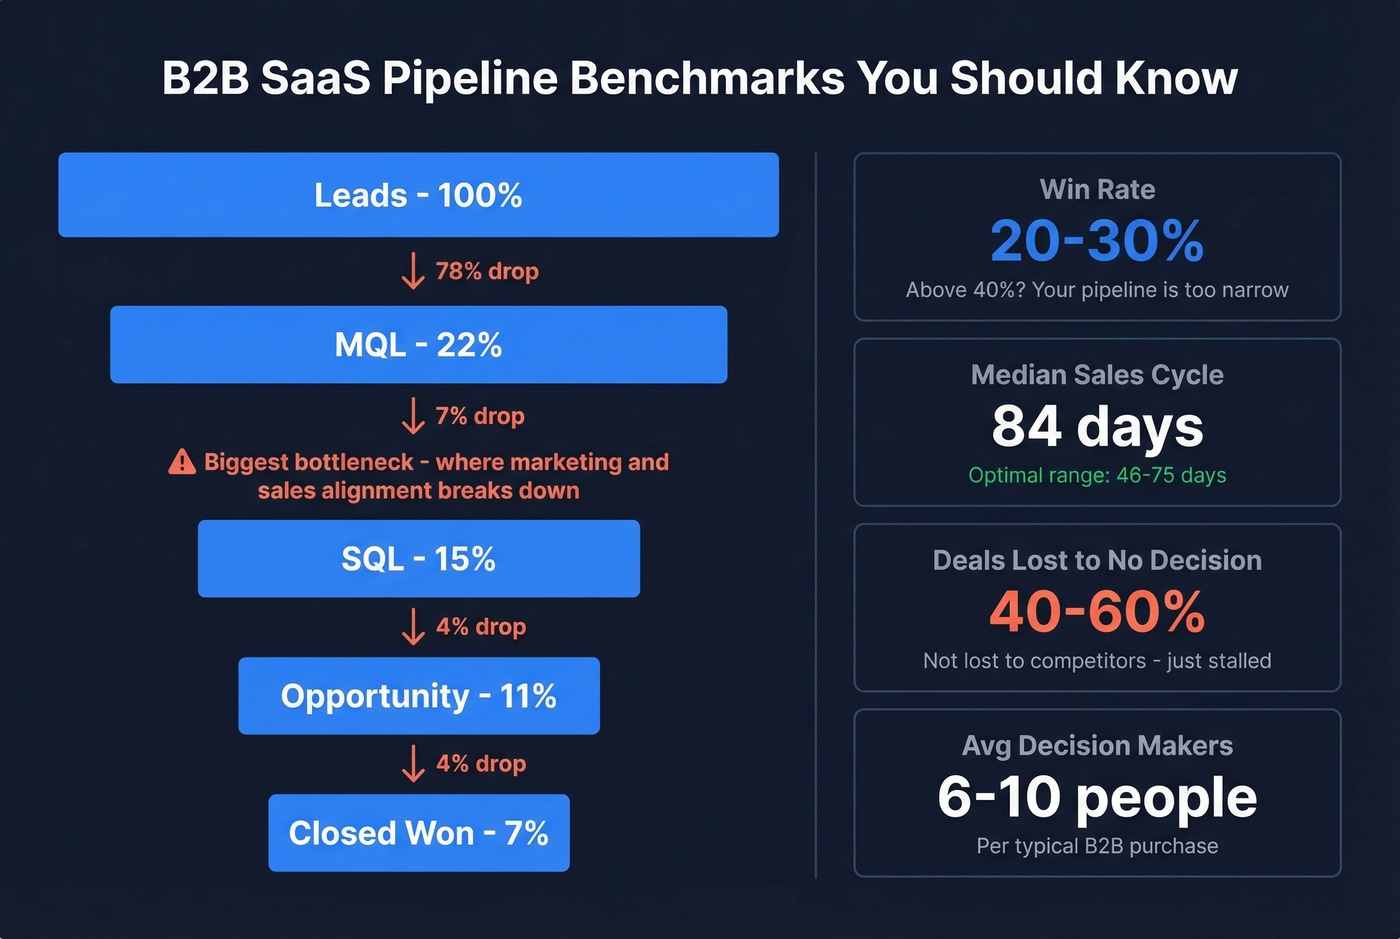
Benchmarks Worth Comparing
Numbers without context are just numbers. Here are two benchmark sets worth pinning next to your dashboard.
Pipeline outcomes (SaaS-focused):
| Metric | Benchmark |
|---|---|
| Win Rate | 20-30% |
| Median Sales Cycle | 84 days (optimal: 46-75) |
Data from Digital Bloom's 2026 benchmarks.
Stage conversion (Lead to Closed Won):
| Metric | Benchmark |
|---|---|
| Lead to MQL | 22% |
| MQL to SQL | 15% |
| SQL to Opportunity | 11% |
| Opportunity to Closed Won | 7% |
Aggregated from MarketJoy's client data.
The biggest bottleneck is almost always MQL to SQL. In our experience, that's where sales marketing alignment breaks down and unqualified leads clog the pipe.
Here's the thing: if your win rate is above 40%, your pipeline is probably too narrow. You're only pursuing sure things and leaving revenue on the table. And 40-60% of deals are lost not to a competitor but to "no decision" - the prospect just stalls. With 6-10 decision-makers involved in a typical B2B purchase, that shouldn't surprise anyone.
Let's be honest - most pipeline problems aren't analysis problems. They're access problems. If your reps can't reach the right people, no formula saves the quarter.
The Weekly Pipeline Review
A spreadsheet that nobody reviews is just a file. Set a weekly cadence with this five-item agenda:
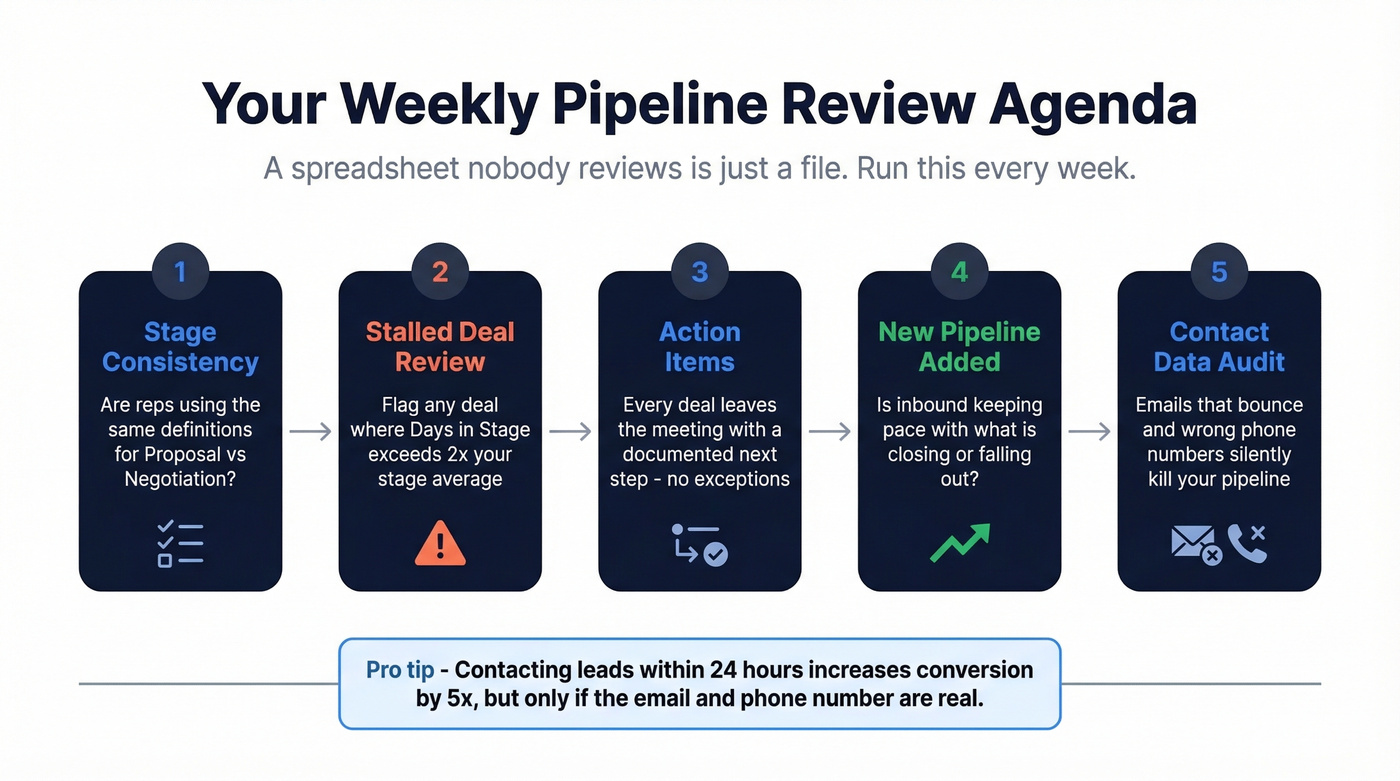
- Stage consistency check. Are reps using the same definitions for "Proposal" vs "Negotiation"?
- Stalled deal review. Flag any deal where Days in Stage exceeds 2x your stage average.
- Action items per deal. Every deal leaves the meeting with a documented next step.
- New pipeline added. Is inbound keeping pace with what's closing or falling out? (If not, steal a few pipeline generation ideas.)
- Contact data audit. Contacting leads within 24 hours increases conversion by 5x - but that only works if the email doesn't bounce and the phone number is real.
That last point is a hidden cause of stalled deals that most pipeline reviews ignore entirely. If reps can't reach decision-makers because emails bounce or mobiles are wrong, the problem isn't your spreadsheet. It's your contact data. Tools like Prospeo verify emails at 98% accuracy and refresh records every 7 days, which keeps your pipeline inputs current instead of decaying between reviews.
Pipeline velocity depends on filling the top of your funnel with qualified, reachable prospects. Prospeo's 30+ filters - buyer intent, technographics, headcount growth - let you build targeted lists that convert, not just pad your pipeline with dead rows.
Stop forecasting on contacts that bounce - start with data that connects.
When to Graduate from Excel
Excel is the right tool until it isn't. The switch signal isn't team size - it's when you spend more time maintaining the sheet than analyzing it.
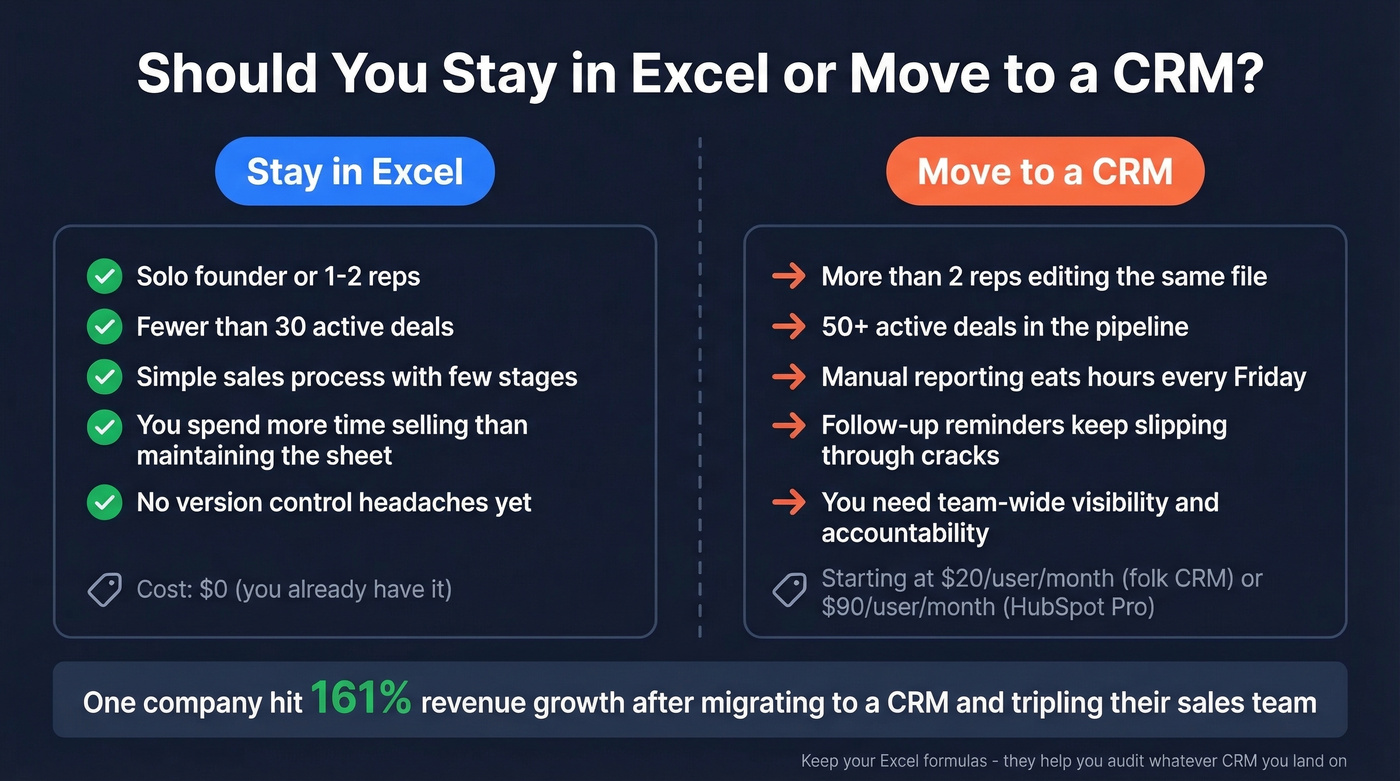
The failure modes are predictable: version control nightmares when two reps edit the same file, no built-in follow-up reminders so callbacks slip, and manual reporting that eats hours every Friday. If you've got more than two reps or 50+ active deals, Excel becomes a liability. One case study showed a company hitting 161% revenue growth after migrating to a CRM and tripling their sales team - something that would've been impossible to coordinate in a shared spreadsheet.
Skip the CRM migration if you're a solo founder with fewer than 30 deals. You'll spend more time configuring the tool than selling.
When you're ready, the entry points aren't expensive. folk CRM starts at $20/user/month. HubSpot Sales Hub runs from $90/user/month for Professional. Either way, keep your Excel formulas - they'll help you audit whatever CRM you land on. (If you want options, start with sales forecasting solutions or sales pipeline software.)
FAQ
Can I Use Google Sheets Instead?
Yes. SUMIFS, COUNTIFS, PivotTables, charts, and slicers all work in Google Sheets. Excel's PivotTable ecosystem - Report Connections, GETPIVOTDATA-driven KPI cards - is more mature for complex, multi-Pivot dashboards. For a single-rep pipeline under 200 rows, Sheets is fine.
Pipeline vs Funnel - What's the Difference?
A pipeline tracks specific deals and their dollar values through stages - that's the seller's view. A funnel measures lead volume and drop-off rates - the buyer's view. Pipeline analysis focuses on revenue forecasting; funnel analysis focuses on conversion optimization.
How Often Should I Update Pipeline Data?
Weekly minimum. Stale data compounds - a deal that closed last Tuesday but still shows as "Proposal" distorts every metric downstream. Set a recurring 15-minute Friday update for each rep.
What Keeps Contact Data Accurate?
Email verification tools solve this. We've seen teams cut bounce rates from 35% to under 4% just by verifying emails before outreach. A 7-day refresh cycle on contact records prevents the slow decay that makes pipeline data unreliable over time.