Pipeline Goals That Actually Predict Revenue
It's Monday morning. Your CRM says you're sitting on 3.4x pipeline coverage. Leadership feels good. But run those deals through probability weighting and you're actually at 1.8x - barely enough to scrape quota.
A semiconductor sales manager on r/sales put it bluntly: their pipeline was inflated by about 60%, and the inflated numbers were driving inflated quotas, which drove worse data, which inflated the numbers further. A death spiral disguised as a healthy pipeline.
The fix isn't more pipeline. It's better pipeline goals - ones grounded in math, not vibes.
Before You Set Targets
Three things need to be true before any pipeline target means anything:
Stage exit criteria are defined and enforced. Every stage needs an objective gate - a completed discovery call, a proposal delivered, a verbal commit. Frameworks like MEDDPICC or BANT give you the structure. Without objective criteria, deals drift forward on gut feeling and your forecast gets bloated.
Your ICP is specific enough to filter on. If "enterprise companies in North America" is your ICP, it's not an ICP. You need firmographic and behavioral criteria tight enough to score pipeline quality, not just pipeline volume. (If you need a starting point, use an Ideal Customer Profile scoring rubric.)
CRM data is baseline-clean. Wrong values, outdated close dates, duplicate records - all of it makes every metric downstream unreliable. Audit before you goal-set. If you're standardizing your stack, it helps to align on examples of a CRM and what “clean” data should look like.
Three Types of Pipeline Goals
Most teams set one goal: a coverage ratio. That's like managing a factory by tracking only inventory.
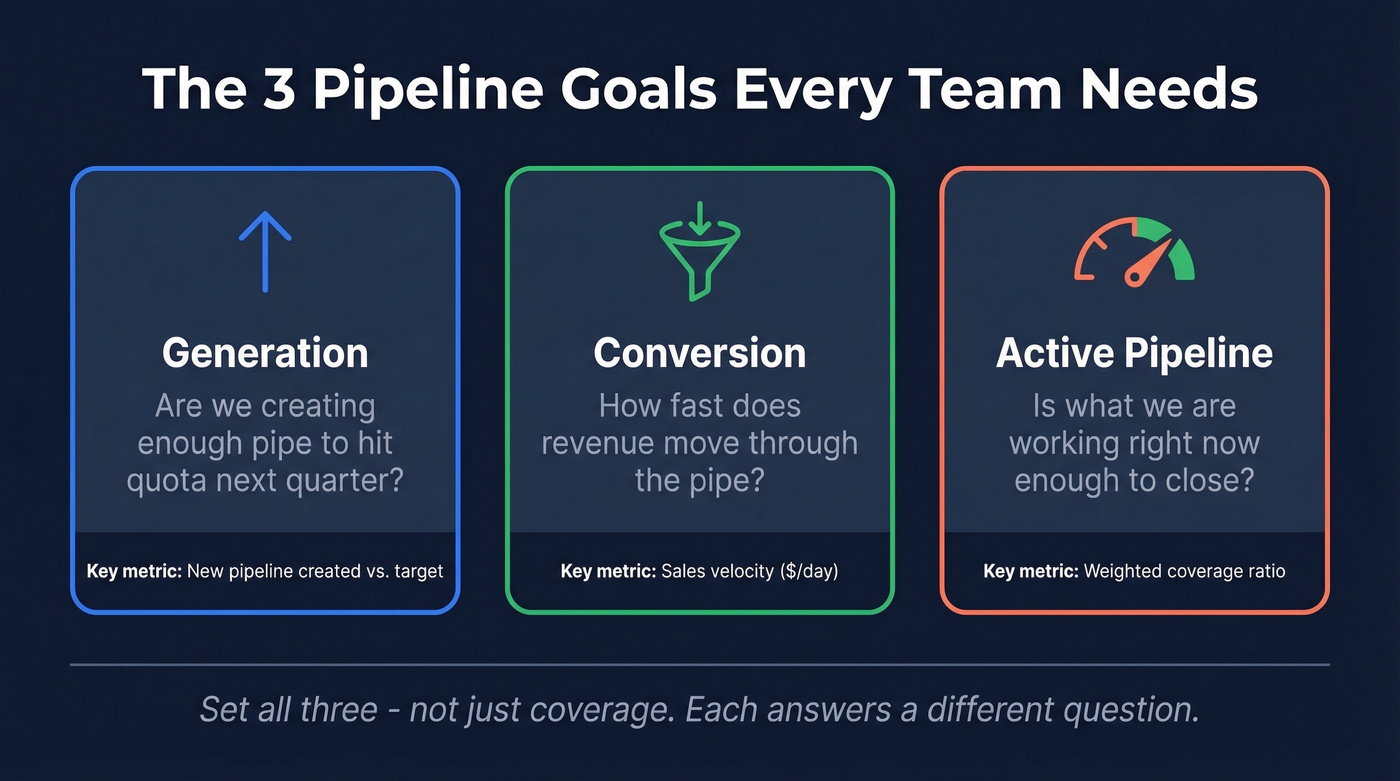
You need three goals, not fifteen. David Sacks' framework breaks it cleanly: generation (how much you're creating), conversion (how efficiently it moves), and active pipeline (what you're working right now). Each answers a different question, and each requires different benchmarks. (For a broader KPI set, see pipeline health.)
Generation Targets
Generation goals answer one question: are we creating enough pipeline to hit quota next quarter?
Stage conversion benchmarks vary by industry, so use your own historical data first. If you don't have it, FirstPageSage's benchmarks are a reasonable starting point:
| Industry | Lead-to-MQL | MQL-to-SQL |
|---|---|---|
| B2B SaaS | 39% | 38% |
| Cybersecurity | 24% | 40% |
Here's the thing: reps spend only 28% of their week actually selling. Your activity targets need to reflect that reality, not an imaginary 40-hour selling week. (If you need to define what “activity” means, use these sales activities examples.)
For new reps, phase the ramp - 25-50% of quota in months 1-3, 50-75% in months 4-6, full quota at month 7. Expecting 100% from day one just creates phantom pipeline that clutters every report and warps every forecast. A structured 30-60-90 day plan helps keep ramp targets realistic.
Conversion Goals
Conversion goals measure velocity - how fast revenue moves through your pipe:
(Opportunities x Avg Deal Size x Win Rate) / Sales Cycle Length
Worked example: 100 opportunities x $10,000 x 20% win rate / 50-day cycle = $4,000/day in sales velocity. That's your baseline. Now set targets against each lever. (If you want to benchmark win rates, start with sales conversion rate.)
The uncomfortable part: 40-60% of deals are lost to "no decision," not to a competitor. And sales cycles are 21% longer than they were in 2020. If you're still using 2021 cycle-length assumptions in your 2026 model, your conversion targets were wrong before you even wrote them down.
Active Pipeline Goals
This is where most teams get it wrong.
The "3x coverage" rule assumes a 33% close rate. Most B2B teams close at 20-25%. At a 20% win rate, you need 5x raw coverage. At 40%, you need 2.5x. The formula: 1 / win rate = required coverage.
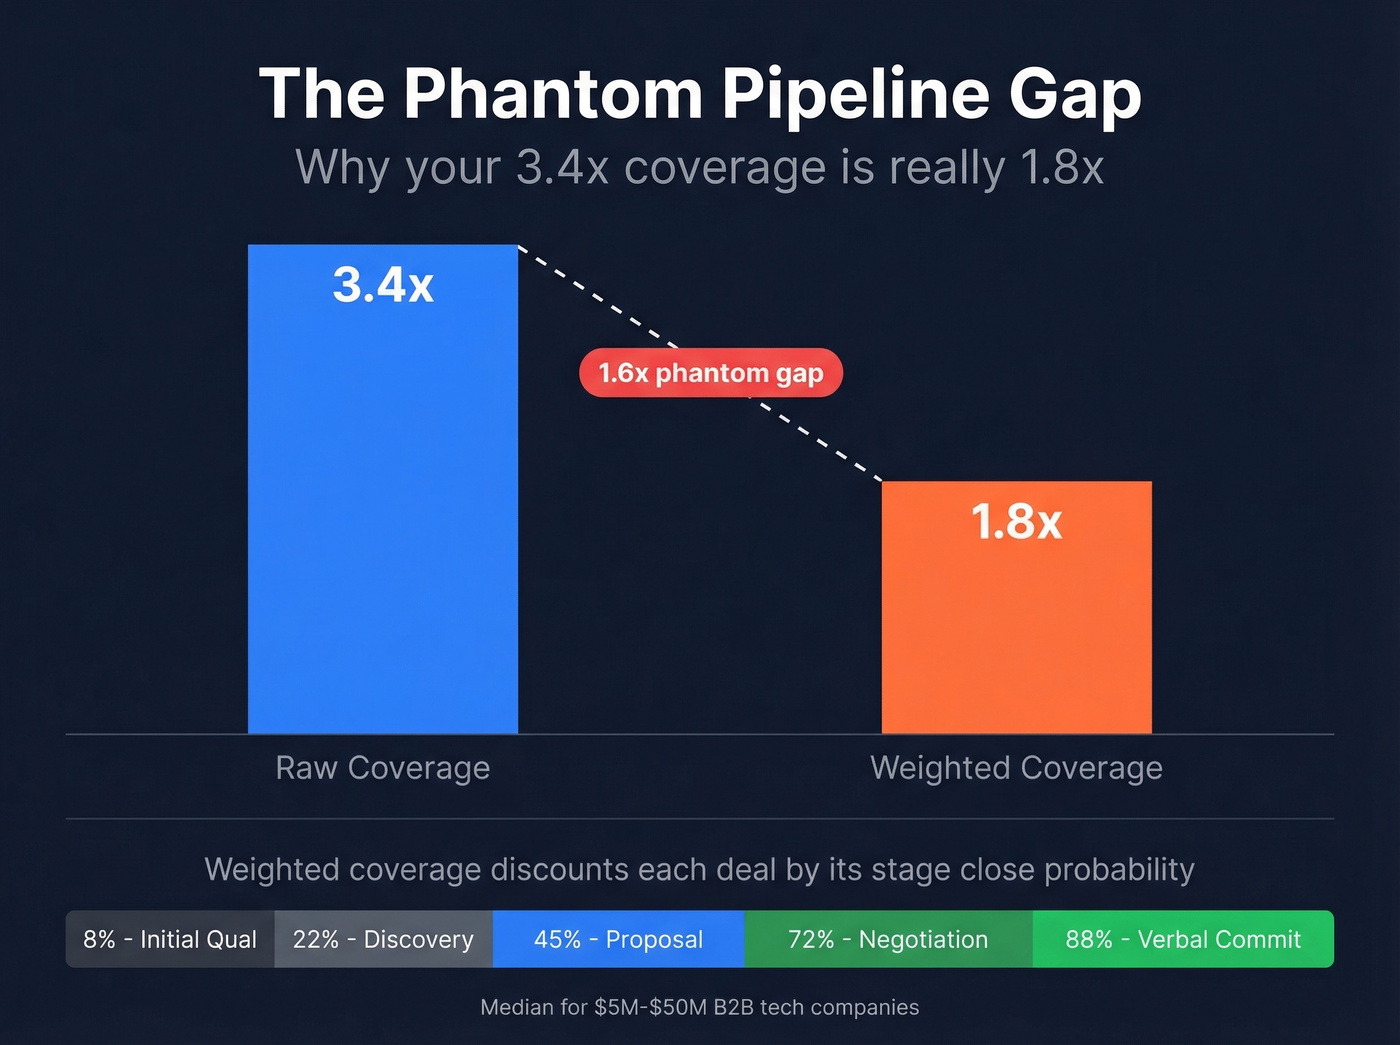
But raw coverage is misleading. We've seen the gap between raw and weighted coverage surprise even experienced RevOps teams. For $5M-$50M B2B tech companies, the median company carries 3.4x raw coverage but only 1.8x probability-weighted coverage - a 1.6x phantom gap.
Weighted coverage discounts each deal by its stage close probability:
| Stage | Close Probability |
|---|---|
| Initial Qualification | 8% |
| Discovery Complete | 22% |
| Proposal/Evaluation | 45% |
| Negotiation | 72% |
| Verbal/Commit | 88% |
Now look at what separates teams that hit plan from those that don't:
| Metric | Hits Plan | Misses |
|---|---|---|
| Weighted Coverage | 2.1x+ | 1.2x or below |
| Pipe from Stage 2+ | 70%+ | Under 45% |
| Deals stuck 45+ days | Under 25% | 35%+ |
| Raw Coverage | ~3.4x | ~3.4x |
That last row is the whole story. Both profiles carry roughly the same raw coverage. The difference is pipeline quality - stage distribution and deal velocity.
Let's be honest: if your average deal is under $15k and your weighted coverage is above 2.1x, stop obsessing over pipeline generation. You don't have a coverage problem. You have a conversion problem. Fix velocity first. (If you’re diagnosing why the pipe is stalling, start with these sales pipeline challenges.)
Your pipeline coverage ratio is only as real as the contacts behind it. If 35% of your outbound emails bounce, your 3.4x coverage is actually 2.2x - and your weighted coverage is even worse. Prospeo's 98% email accuracy and 7-day data refresh cycle close the gap between reported pipeline and real pipeline.
Stop building pipeline goals on phantom data.
Making Pipeline Goals Realistic
We've watched teams set aggressive meeting and pipeline targets and then wonder why only 24.3% of reps exceed yearly quota. Achievable quotas are typically calibrated at 70-80% attainment - if everyone's hitting 100%, your targets are too low, and if nobody's close, they're too high. (This is also where sales performance management helps keep targets tied to reality.)
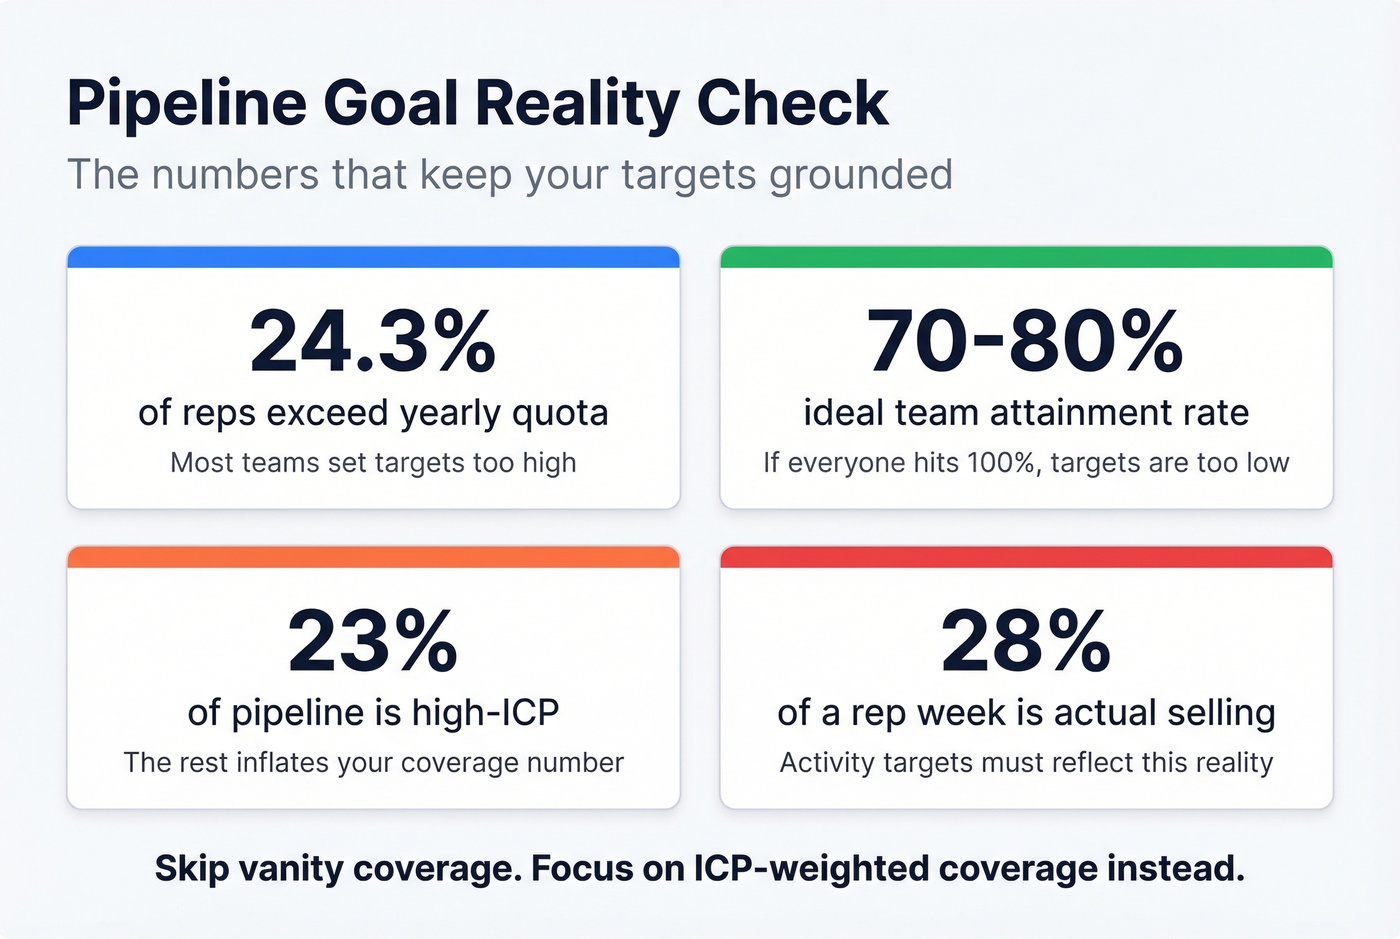
High-ICP accounts represent only 23% of total pipeline for many organizations. Setting a 5x coverage target when three-quarters of your pipeline is low-ICP just creates busywork and inflates the phantom pipeline you're trying to eliminate.
Skip the vanity coverage number. Focus on ICP-weighted coverage instead. (If you need to operationalize the filters, start with firmographic filters.)
When You're Behind on Targets
Every formula above falls apart when contact data isn't accurate. If your outbound team is generating "pipeline" from emails that bounce at 35%, your generation math is fiction. Falling behind on pipeline goals often isn't a volume issue - it's a data quality issue wearing a volume costume. (To quantify and fix it, track email bounce rate and address root causes.)
Snyk saw this firsthand with Prospeo: bounce rates of 35-40% dropped to under 5%, and AE-sourced pipeline jumped 180%. That's not a marginal improvement - it's the difference between a pipeline model that reflects reality and one that doesn't. Prospeo's 7-day data refresh cycle and 98% email accuracy keep the math honest, so your 100 outbound opportunities actually reach 100 inboxes instead of 65.

Snyk's 50 AEs cut bounce rates from 35-40% to under 5% and grew AE-sourced pipeline 180% - because every outbound touch actually reached a real inbox. At ~$0.01/email with no contracts, Prospeo makes your generation targets achievable instead of aspirational.
Make your pipeline generation math reflect reality for the first time.
FAQ
What's a good pipeline coverage ratio?
Use the formula 1 / win rate: a 20% win rate requires 5x raw coverage, 30% needs 3.3x, and 40% needs 2.5x. Always track probability-weighted coverage instead of raw - target 2.1x+ weighted for a healthy pipe. Raw numbers alone hide phantom deals.
How do you calculate pipeline velocity?
Sales velocity = (Opportunities x Average Deal Size x Win Rate) / Sales Cycle Length. Track monthly to spot which lever - volume, deal size, win rate, or cycle length - needs attention. A $4,000/day baseline is common for mid-market B2B SaaS teams.
Why do pipeline goals fail?
Three reasons: dirty CRM data (like the 60% inflation example above), no objective stage exit criteria, and prioritizing volume over quality. Fix data quality first - bounced emails create phantom pipeline that makes every downstream metric unreliable, and cleaning that up is often the fastest path back to realistic forecasting.