Sales Rep Quotas: What They Are, How to Set Them, and Why Most Are Broken
It's January. You just got your new number, and it's 20% higher than last year - despite the pipeline shrinking, the market tightening, and your best SDR leaving in November. You open the comp plan doc, do the math, and realize your sales rep quota would require closing more this quarter than you did in all of H2. Sound familiar?
You're not alone. Only 41.2% of software reps are hitting quota right now. The majority are missing, and most of the time, it isn't a performance problem - it's a quota-setting problem.
The quick version:
- Check your quota-to-OTE ratio. Healthy is 4:1-6:1. Above 8:1, your quota is probably unfair.
- Only 41.2% of software reps hit quota. If you're missing, you're the majority - not the exception.
- Pipeline quality is the one variable you control. If a big chunk of your contacts bounce, no amount of hustle fixes the math.
What Is a Sales Rep Quota?
A sales rep quota is a specific, measurable performance target assigned to an individual seller over a defined period - usually monthly, quarterly, or annually. It's the number your comp plan pays against. Quotas exist for three reasons: they create accountability, they give leadership a forecasting framework, and they tie compensation directly to outcomes.
People use "quota," "target," and "goal" interchangeably. The differences matter.
| Term | Definition | Consequence |
|---|---|---|
| Quota | Formal target tied to comp | Missed quota = lower pay |
| Sales Target | Team/org revenue objective | Missed target = missed plan |
| Sales Goal | Aspirational benchmark | Missed goal = no penalty |
Your quota is the one that hits your wallet. The target is what your VP cares about. The goal is what the board puts on a slide. Understanding which number you're actually measured against matters more than most reps realize.
Types of Sales Quotas
Not all quotas measure the same thing, and picking the wrong type creates perverse incentives. The Sales Management Association found that 68% of companies use a combination of quota types. CaptivateIQ's 2025 benchmarks show most comp plans now include just three core metrics - a simplification trend versus older five- or six-metric plans.
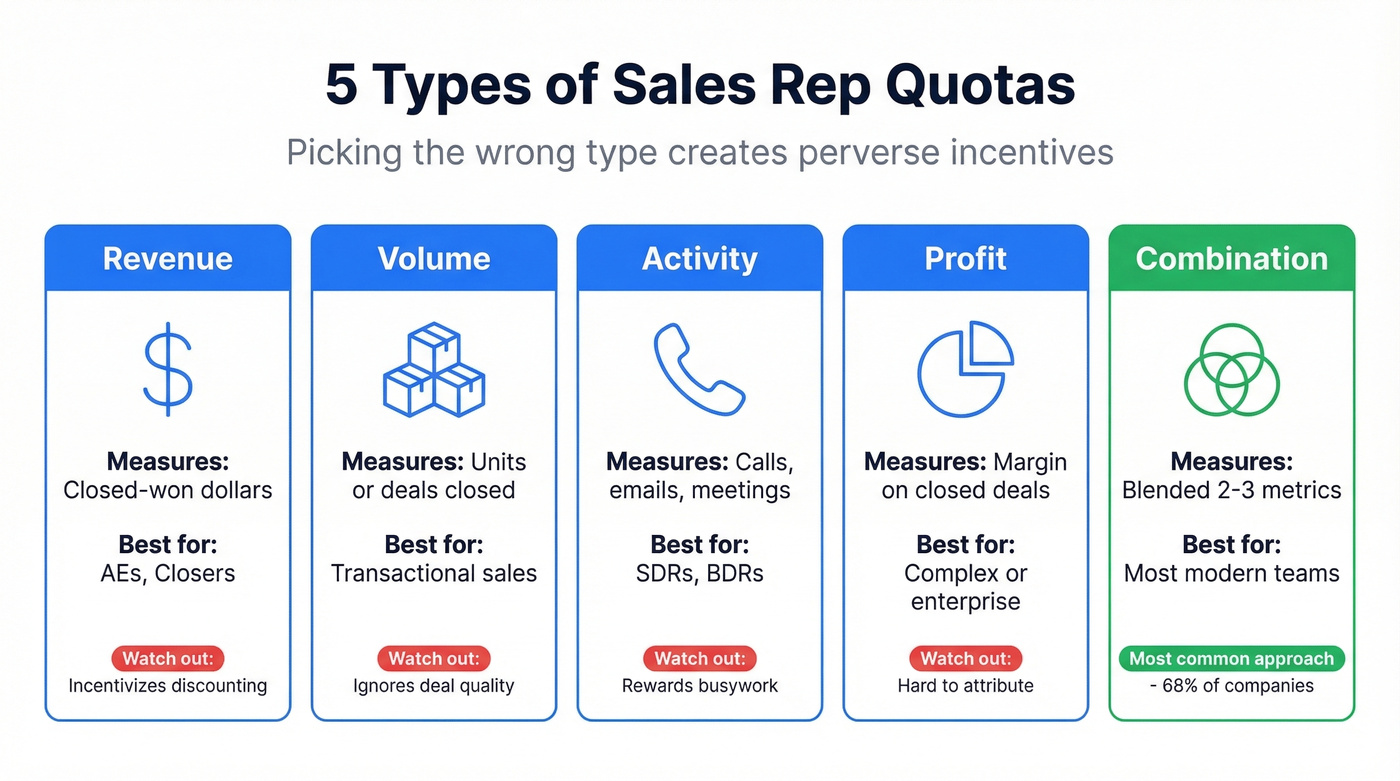
| Type | What It Measures | Best For | Pitfall |
|---|---|---|---|
| Revenue | Closed-won dollars | AEs, closers | Incentivizes discounting |
| Volume | Units or deals closed | Transactional sales | Ignores deal quality |
| Activity | Calls, emails, meetings | SDRs, BDRs | Rewards busywork |
| Profit | Margin on closed deals | Complex/enterprise | Hard to attribute |
| Combination | Blended metrics | Most modern teams | Complexity kills clarity |
Revenue quotas are the default for AEs, but they have a well-known flaw: reps will discount aggressively to close before quarter-end. If your comp plan over-rewards end-of-quarter closes, your revenue target can work against margin goals.
Activity quotas work for SDRs but only if the underlying data is clean. Measuring dials and sends is meaningless if a big slice of those contacts are invalid. Volume quotas suit transactional motions where deal size is relatively uniform. Profit quotas sound great in theory but require attribution models most companies don't have.
The combination approach - blending two or three metrics - is where most mature orgs land. Many AE plans weight heavily toward revenue, with one or two secondary metrics like pipeline creation and strategic account coverage. The right system depends on your sales motion, deal complexity, and how much visibility you have into margin data.
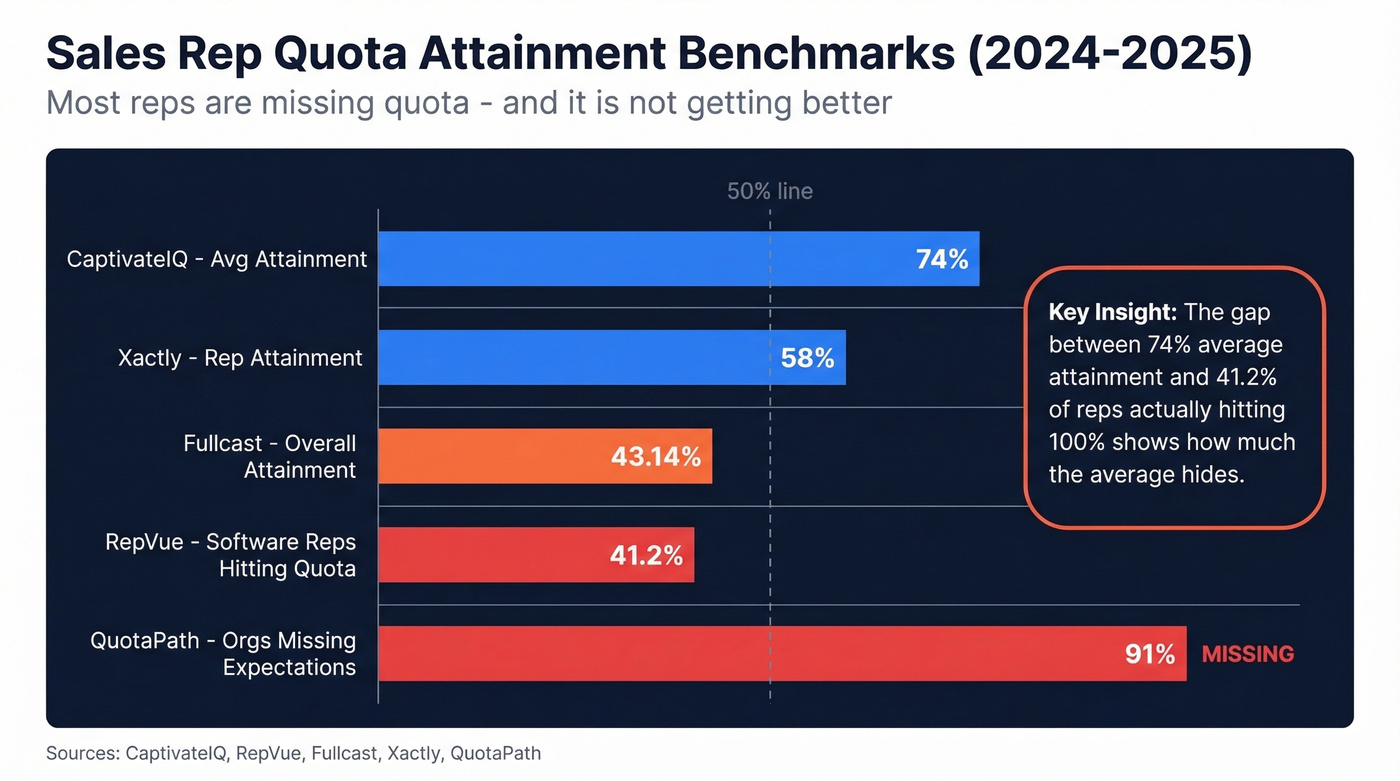
Quota Attainment Benchmarks in 2026
Here's where attainment stands heading into 2026. Figures vary depending on who's measuring and how, so we've consolidated the most-cited sources:
| Source | Metric | Figure | Year |
|---|---|---|---|
| CaptivateIQ | Avg attainment | 74% | 2025 |
| RepVue (via r/sales) | Software reps hitting quota | 41.2% | 2025 |
| Fullcast | Overall attainment | 43.14% | 2024 |
| Fullcast | Missed lowered quotas | 76.6% | 2025 |
| Xactly | Rep attainment | 58% | 2023 |
| QuotaPath | Orgs missing expectations | 91% | 2024 |
The gap between CaptivateIQ's 74% average and RepVue's 41.2% for software tells you everything. CaptivateIQ measures attainment as a percentage of quota - reps averaging 74 cents on the dollar. RepVue measures the share of reps actually hitting 100%. Both are true. Both paint a grim picture. CaptivateIQ also found that 39% of organizations report 51-75% of sellers reaching quota, which means the "average" hides enormous variance between top-performing and bottom-performing orgs.
Industry matters enormously:
| Industry | Attainment Rate |
|---|---|
| Software/SaaS | 41.2% |
| Medical Devices | 64.2% |
| Pharma/Biotech | 60% |
On r/sales, the mood matches the data. One thread described the current environment as "the party is over," with reps openly discussing pivoting out of software sales entirely. Others called out comp plans as "trash behavior" - leadership raising quotas while the market contracts. The frustration isn't anecdotal. It's structural.
Quotas by Role
Quota structure, pay mix, and attainment rates shift dramatically across roles. An SDR's world looks nothing like an enterprise AE's.
| Role | Typical Quota | Pay Mix | OTE Range | Avg Attainment |
|---|---|---|---|---|
| SDR/BDR | Meetings/SQLs | 70/30 or 60/40 | $70K-$95K | 63% |
| Mid-Market AE | ~$1.2M ARR | 50/50 | $140K-$180K | - |
| Enterprise AE | $1.5M-$3M+ ARR | 50/50 | $180K-$250K+ | - |
| CSM | Retention/expansion | 80/20 or 90/10 | Varies | - |
Pipeline sourcing tells you where the pressure sits. Marketing typically generates 25-30% of pipeline, SDRs and BDRs contribute roughly 40%, and AEs self-source about 30%. That last number is why AE prospecting skills - and the data they prospect with - matter so much for attainment. If you're rebuilding your outbound motion, start with proven sales prospecting techniques before you touch the quota model.
The median AE commission rate at 100% attainment is 11.5% of ACV. On a $100K ACV deal, that's $11,500 in commission. That math only works if the quota-to-OTE ratio is calibrated correctly.
Activity quotas and pipeline targets fall apart when your contact data bounces. Prospeo delivers 98% email accuracy and 125M+ verified mobile numbers - so every dial and every send counts toward quota, not toward a bounced-contact graveyard.
Stop burning quota capacity on dead contacts.
The Quota-to-OTE Ratio
This is the single most important number for evaluating whether a quota is fair. The formula:
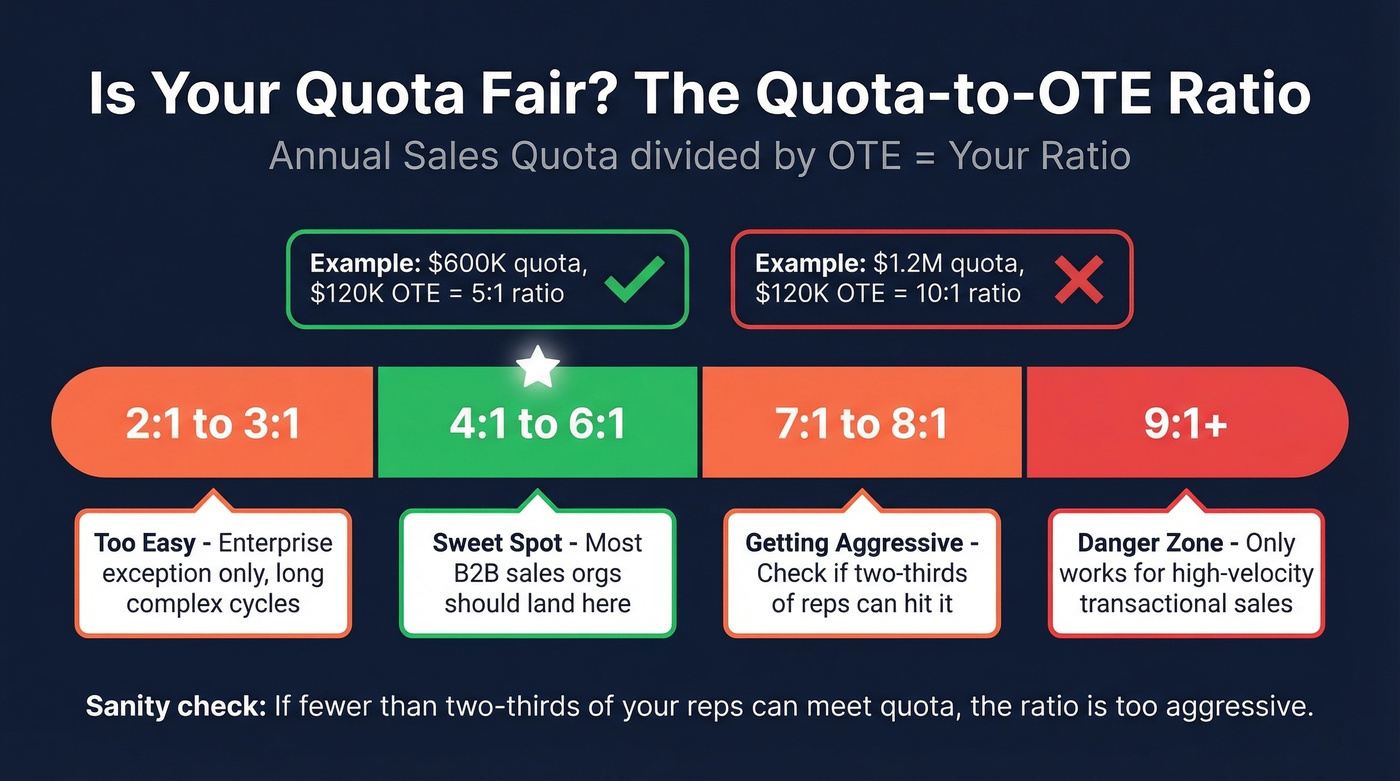
Quota-to-OTE Ratio = Annual Sales Quota / OTE
A healthy ratio falls between 4:1 and 6:1 for most B2B sales orgs. A mid-market AE with a $600K annual quota and $120K OTE has a ratio of 5:1 - right in the sweet spot. If you need a refresher on OTE math, see OTE in sales.
Context matters, though. Enterprise reps selling complex, long-cycle deals can justify a ratio closer to 3:1 because the deals are harder to close and take longer. Transactional, high-velocity reps can support 10:1 or higher because they're closing volume.
The sanity check we use: if fewer than two-thirds of your reps can meet quota, the ratio is too aggressive. If you're below that threshold, the problem isn't your reps. It's your math.
Here's the thing: if your average deal size is under $10K, you probably don't need enterprise-grade quota infrastructure. A simple revenue quota with a 5:1 OTE ratio and clean pipeline data will outperform any elaborate comp plan with five weighted metrics and a 47-page plan document. Complexity doesn't make quotas better. It makes them harder to game and harder to understand - which aren't the same thing.
How to Set Quotas Reps Can Hit
The Five-Step Process
87% of sales leaders have no set method for setting quota targets. That's staggering. And 58% of organizations over-assign quotas by 20-30% to ensure the overall number hits the revenue plan. Leadership knows individual reps will miss, and they've baked that failure into the model.
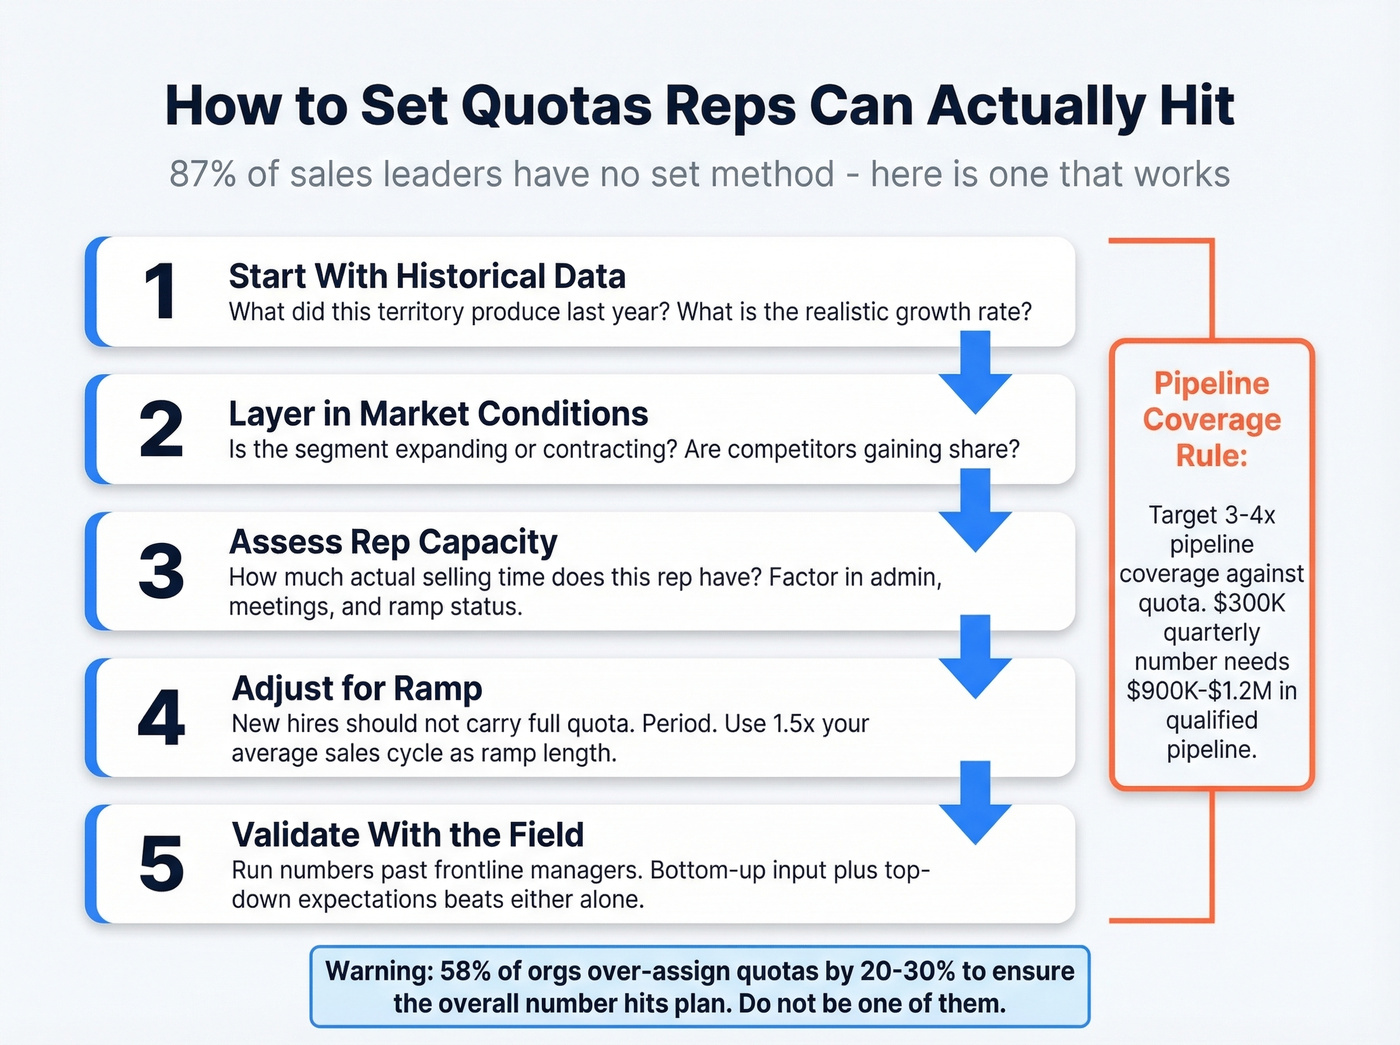
Here's a process that actually works:
- Start with historical data. What did this territory produce last year? What's the realistic growth rate?
- Layer in market conditions. Is the segment expanding or contracting? Are competitors gaining share?
- Assess rep capacity. How much selling time does this rep actually have? Factor in admin, internal meetings, and ramp status. Teams spend about 36 hours per payout period just processing commissions - that's overhead eating into selling time.
- Adjust for ramp. New hires shouldn't carry full quota. Period.
- Validate with the field. Run the numbers past frontline managers before locking them. Bottom-up input combined with top-down expectations produces better quotas than either approach alone.
The SalesGlobe framework calls this the Four Ps: People, Perspective, Potential, and Process. The key insight is that quota-setting should balance market opportunity with sales capacity - not just divide the revenue target by headcount and call it a day. If you want to sanity-check the market side, start with addressable market basics (TAM/SAM/SOM) before you lock territories.
Pipeline coverage math matters here too. Most orgs target 3-4x pipeline coverage against quota. If your AE carries a $300K quarterly number, they need $900K-$1.2M in qualified pipeline entering the quarter. To pressure-test that, track pipeline health metrics alongside attainment.
The Porpoise Pattern
This is the trap that destroys motivation and makes forecasting unreliable.
- Year 1: Rep crushes it - 120% attainment. Leadership celebrates.
- Year 2: Quota gets ratcheted up 20%. Rep hits 85%. Leadership is "concerned."
- Year 3: Quota gets pulled back slightly. Rep hits 115%. Leadership celebrates again.
Up, down, up, down - like a porpoise surfacing and diving. The rep's actual performance is consistent, but the quota swings create artificial volatility. SalesGlobe warns explicitly against this pattern. The fix is to set quotas based on market potential and territory opportunity, not just last year's results plus a growth multiplier.
Ramp Quotas for New Hires
Throwing a new hire into full quota on day one is a great way to lose them by month four. Structured ramp periods yield roughly 23% more first-year revenue than the sink-or-swim approach.
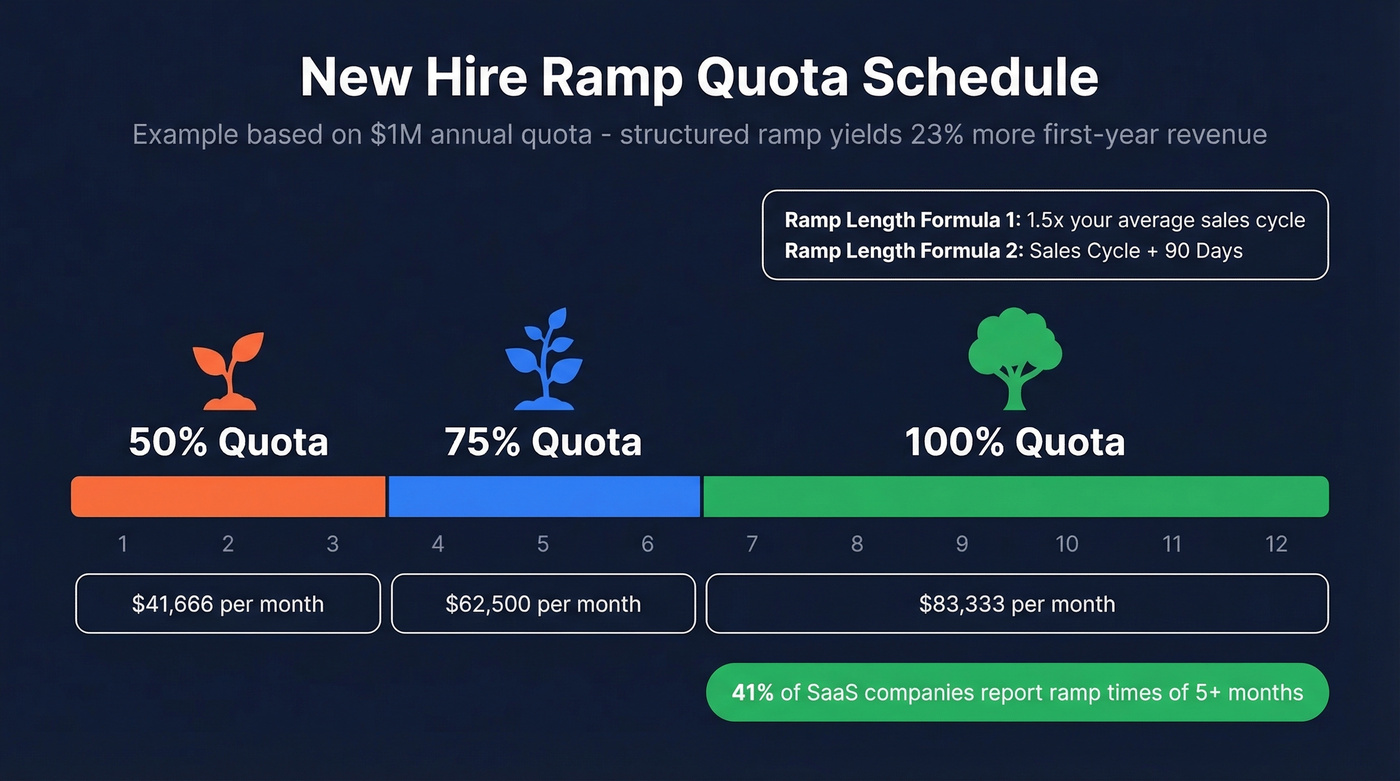
Here's a standard ramp schedule for a $1M annual quota:
| Month | Quota % | Monthly Target |
|---|---|---|
| 1-3 | 50% | $41,666 |
| 4-6 | 75% | $62,500 |
| 7+ | 100% | $83,333 |
The ramp length heuristic: set it at roughly 1.5x your average sales cycle. If your typical deal takes 90 days to close, the ramp should be about 135 days. An alternative formula from Everstage: Sales Cycle + 90 Days. Bridge Group data shows that 41% of SaaS companies report ramp times of 5+ months - so don't expect miracles in quarter one. For a practical onboarding structure, use a 30-60-90 day plan for sales reps.
During ramp, protect your new hires financially. A common draw structure gives 80% guaranteed incentive pay in month one, 50% in month two, then performance-based from month three onward. This keeps good people from panicking and quitting before they've had a real chance to sell.
Why Most Reps Miss Quota
Let's be honest: stop blaming reps. Start auditing how quotas are set.
ZS Associates found that 75% of companies report challenges with territory design. When territories are unbalanced, some reps get layups while others get wastelands - and the quota is the same for both. That's not a performance gap. That's a planning failure. QuotaPath found that 35% of organizations attribute quota failure directly to misaligned sales activities, reinforcing the point: the system is broken before the rep even picks up the phone. If you’re diagnosing the upstream issues, start with common sales pipeline challenges that quietly kill coverage.
Only 46% of sales and marketing leaders report strong alignment. When marketing delivers leads that don't match the ICP, or when handoff criteria are vague, pipeline quality suffers and reps burn cycles on deals that were never going to close. Just 20% of companies have successfully implemented revenue technology that genuinely drives growth - the rest are flying blind on quota-setting and tracking. Tightening your ideal customer profile is usually the fastest fix.
43% of salespeople report struggling with mental health - more than double the general population rate. Unrealistic quotas aren't just a revenue problem. They're a retention problem. One sales leader put it bluntly: "We expect our reps to on average hit 70%. If they get to 70%, we hit our company plan." That's not a performance target. That's a budgeting exercise dressed up as a comp plan, and reps feel the weight of it every quarter.

Then there's the variable most reps can actually control: pipeline data quality. If your contact data bounces, you're burning activity on ghosts. Every invalid email is a wasted touch, every disconnected number is a wasted dial. One sales team at Meritt cut bounce rates from 35% to under 4% after switching to Prospeo, tripling their pipeline from $100K to $300K per week. That kind of improvement directly translates to more pipeline per rep - and more reps hitting their number. If you’re troubleshooting this, start with email bounce rate benchmarks and fixes.
AEs self-source ~30% of pipeline. That means your quota attainment depends directly on how fast you find real decision-makers with valid emails and direct dials. Prospeo gives you 300M+ profiles with 30+ filters - intent data, job changes, headcount growth - at $0.01 per email.
Build the pipeline your quota actually requires.
How to Track Quota Attainment
The formula is straightforward:
Quota Attainment % = (Actual Results / Quota) x 100
Attainment alone doesn't tell you enough, though. Track these alongside it:
- Pipeline coverage ratio. Below 3x, your reps don't have enough at-bats - either sourcing is broken or the top of funnel is leaking.
- Win rate. If it's declining while activity stays flat, the problem is deal quality, not effort.
- Deal velocity. If it's lengthening, your sales cycle assumptions (and therefore your quota period) are wrong.
- Average deal size. If it's shrinking, reps are discounting to hit numbers, which means the revenue quota is incentivizing the wrong behavior.
69% of organizations use Salesforce for quota monitoring, and the biggest mistake we see is treating CRM data as clean when it isn't. Attainment tracking is only as good as the data feeding it. Duplicate contacts, stale records, and unverified emails inflate pipeline numbers and make attainment look healthier than it is - right up until the quarter closes and the forecast misses. If you’re building a cleaner reporting layer, use sales operations metrics as your baseline.
Skip the dashboards entirely if your CRM hygiene is bad. In our experience, fixing the data layer first is the only way to trust the numbers downstream.
FAQ
What is a good quota attainment rate?
Industry average is 74% of quota per CaptivateIQ's 2025 benchmarks, but that's the percentage of target achieved - not the share of reps hitting 100%. In software specifically, only 41.2% of reps reach full quota. If 60-70% or more of your team hits their number, your targets are well-calibrated. Below 50% signals a structural problem, not a performance one.
How do you calculate quota attainment?
Quota Attainment % = (Actual Results / Quota) x 100. A rep with a $300K quarterly quota who closes $240K is at 80% attainment. Track this alongside pipeline coverage (3-4x is healthy), win rate trends, and average deal size for the full picture.
What's the average quota for a SaaS AE?
Mid-market AEs typically carry around $1.2M ARR annually; enterprise AEs range from $1.5M to $3M+. At a 5:1 quota-to-OTE ratio with $140K-$180K OTE, a $700K-$900K quota is healthy for mid-market. Supporting that pipeline depends on data quality - every bounced email is a wasted touch that eats into the activity needed to fill the funnel.
What makes a good quota system?
A good system balances top-down revenue targets with bottom-up territory data, uses a fair quota-to-OTE ratio (4:1-6:1 for most B2B roles), includes structured ramp periods for new hires, and tracks attainment alongside leading indicators like pipeline coverage and win rate. The best systems avoid the porpoise pattern by anchoring to market potential rather than ratcheting up from last year's results.