The 12 Sales Team Performance Metrics That Actually Move Revenue
It's Monday morning. Your CRO pulls up a 30-metric dashboard, squints at it for ten seconds, and asks: "So are we going to hit the number?" Nobody answers, because nobody knows which line to look at.
That's the problem with most sales team performance metrics - they measure everything and explain nothing. 57% of sales professionals say cycles are lengthening, reps spend 60% of their time on non-selling tasks, and the latest SaaS CAC ratio climbed 14% year-over-year. You don't need 30 metrics to diagnose what's wrong. You need 10-12, chosen carefully, reviewed at the right cadence, and paired so they can't be gamed.
Here's the thing most RevOps teams won't say out loud: the majority of sales dashboards exist to make executives feel informed, not to help reps sell better. If a metric doesn't change someone's behavior within 48 hours, it's decoration.
If You Read Nothing Else
Track these five:
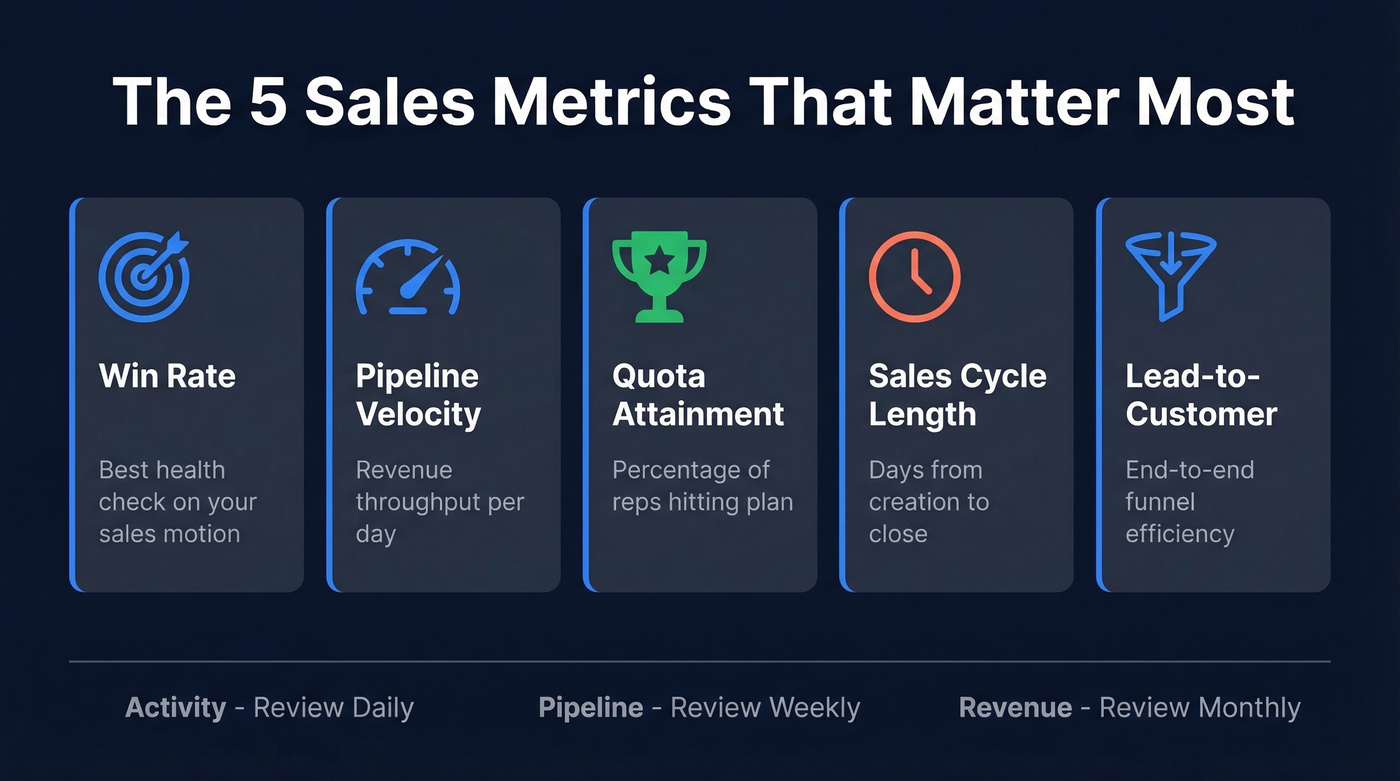
- Win rate - the single best health check on your sales motion
- Pipeline velocity - revenue throughput per day, combining four variables into one number
- Quota attainment - what percentage of reps are actually hitting plan
- Sales cycle length - how long deals take from creation to close
- Lead-to-customer conversion - your end-to-end funnel efficiency
Pair every activity metric with a quality counterweight. Review activity daily, pipeline weekly, revenue monthly. And before you trust any dashboard, verify your underlying data - a metric built on bad contact records is just a confident lie.
Sales Metrics vs. KPIs
These terms get used interchangeably, but they aren't the same. A metric measures what's happening. A KPI measures what matters against a specific goal. As NetSuite's framework puts it: total revenue is a metric; revenue growth rate versus your quarterly target is a KPI.
The practical implication: you'll track 10-12 metrics, but only 4-5 deserve KPI status for any given role. An SDR's KPIs look nothing like a CRO's.
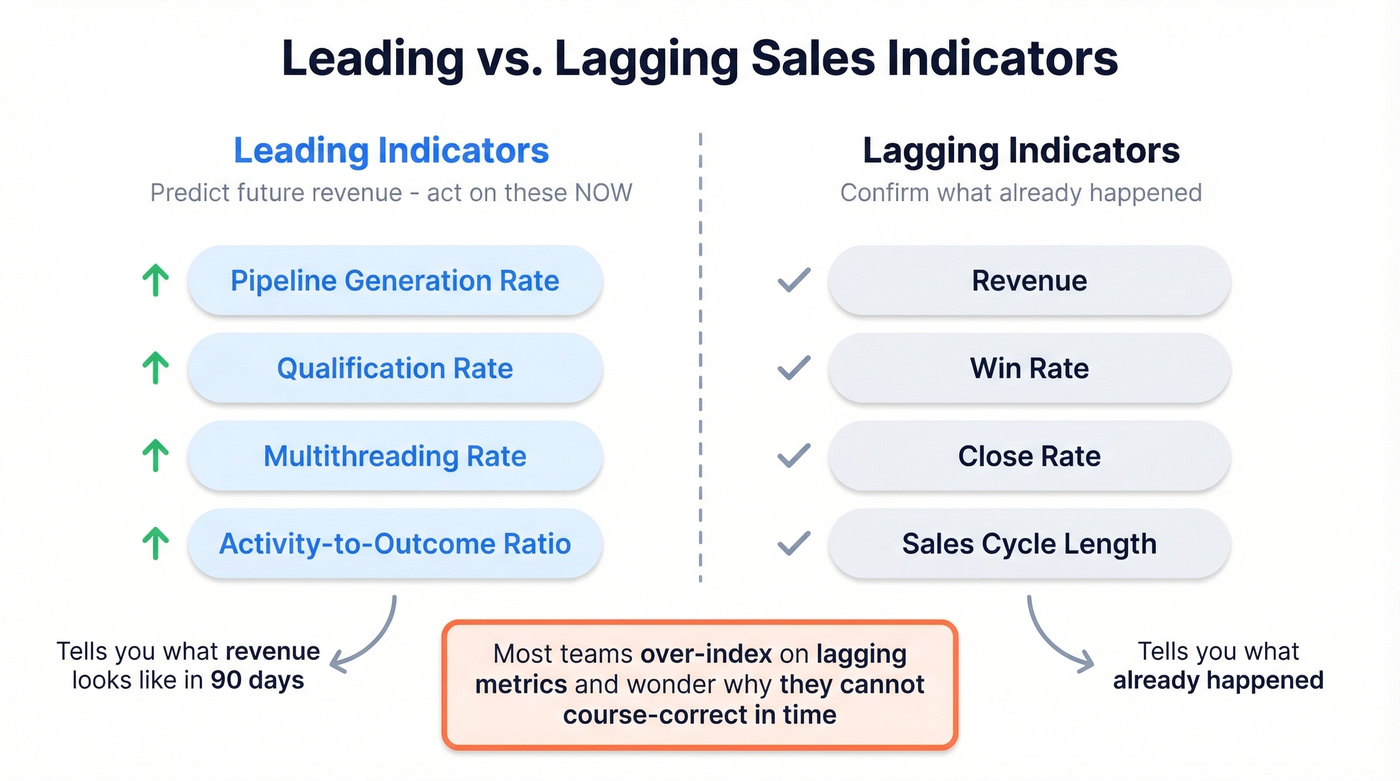
The other distinction that matters is leading versus lagging. Pipeline generation rate is a leading indicator - it tells you what revenue will look like in 90 days. Win rate is lagging - it tells you what already happened. Revenue, close rates, and cycle length all fall on the lagging side. Pipeline creation, qualification rate, and multithreading rate sit on the leading side. You need both, but most teams over-index on lagging metrics and then wonder why they can't course-correct in time.
The 12 Metrics Worth Tracking
Pipeline Health
Pipeline coverage ratio measures how much pipeline you need relative to your revenue target. The standard rule of thumb is 3x for mature inbound motions with shorter cycles, scaling to 4x-5x for outbound-heavy or enterprise segments. In our experience, teams that think they're running at 3x coverage are often closer to 2x once you strip out stalled deals that haven't moved in 30+ days. If your coverage drops below 3x on active pipeline, you've got a future revenue problem that won't show up in closed-won numbers for another quarter.
If you want a deeper framework, start with pipeline health metrics that separate real pipeline from CRM noise.
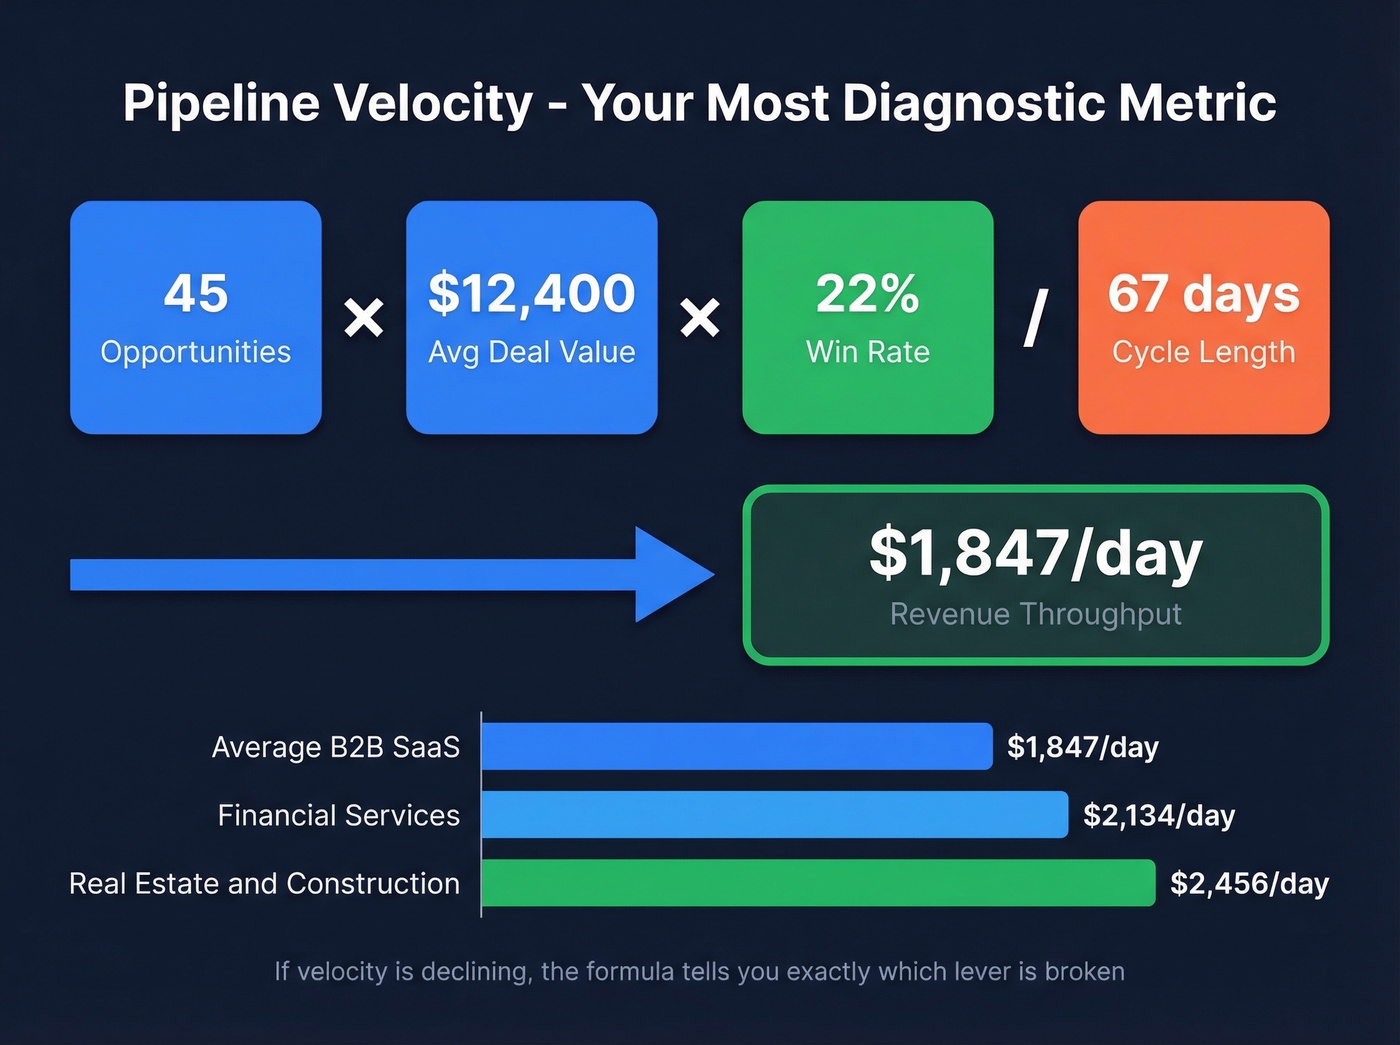
Pipeline velocity is the single most diagnostic metric in B2B sales. The formula:
(Number of Opportunities x Average Deal Value x Win Rate) / Sales Cycle Length in Days
This gives you a dollar-per-day throughput number. For a team with 45 active opportunities, a $12,400 average deal, 22% win rate, and a 67-day cycle, velocity runs about $1,847/day. Financial services teams typically run higher at ~$2,134/day; real estate and construction hit ~$2,456/day. If your velocity is declining, the formula tells you exactly which lever is broken - and that's what makes it more useful than any single metric on its own.
Pipeline generation velocity tracks new qualified pipeline created per rep per week. This is the earliest warning system for a future revenue miss. If generation drops this month, you'll feel it in closed-won two quarters from now. We track this weekly for every team we advise, and it's the metric that most reliably predicts whether a quarter will land.
Qualification rate - the conversion from MQL to SQL - is where most funnels leak. The benchmark range is 15-21%, and it's consistently the biggest bottleneck in B2B SaaS. Here's the diagnostic question: if yours is below 15%, is the problem your targeting or your qualification criteria? Run a 50-deal audit. If most disqualified leads are outside your ICP, it's a targeting problem. If they match your ICP but aren't ready to buy, your criteria are too loose.
If you need a tighter definition of what “qualified” means, align it to a lead scoring model your SDRs and AEs both trust.
Revenue Efficiency
Win rate is the metric everyone tracks and few segment properly. The typical B2B SaaS win rate runs 20-30%, but that range hides important variation. Let's walk through a scenario: your blended win rate is 28%. Looks healthy. But when you split it, SMB is closing at 39% and enterprise is at 14%. You don't have a sales problem - you have an enterprise sales problem. Always segment by deal size, source channel, and rep tenure. Blended win rates mask more than they reveal.
Sales cycle length has a median of 84 days across B2B SaaS, with an optimal range of 46-75 days. Segment by deal size: SMB typically runs 30-60 days, mid-market 60-120, enterprise 120-270. When cycles lengthen beyond your segment norm, deals are stalling at a specific stage. Pull a stage-by-stage duration report and look for the bottleneck - it's almost always in procurement review or multi-stakeholder alignment.
CAC ratio measures how much you spend in sales and marketing to acquire $1 of new customer ARR. The latest benchmark median is $2.00 - up 14% year-over-year - with bottom-quartile companies spending $2.82 per dollar of new ARR. If your ratio is above $2.00, you're either targeting the wrong accounts or your sales motion has too much friction. Run it quarterly: total S&M spend divided by new ARR added.
For a full breakdown of inputs (and common mistakes), use a dedicated cost to acquire customer framework.
CAC payback period tells you how long it takes to recoup acquisition costs. The common benchmark is ~12 months, though this has increased 12.5% since 2022. SMB payback typically runs 6-12 months, mid-market 12-18, and enterprise 18-30. Anything beyond those ranges should trigger a hard look at pricing or retention. If your payback exceeds 18 months on deals under $15K ACV, your unit economics are broken - no amount of volume fixes that.
Team Productivity
Quota attainment is the metric that keeps VPs up at night. Roughly 30-50% of reps hit quota in any given period, depending on market conditions and how aggressively targets are set. If fewer than 30% of your team is hitting plan, the problem is probably the plan - not the people. Reps on r/sales regularly point out that unrealistic quotas don't motivate; they demoralize. Set targets where 40-60% of the team can realistically achieve them, and use accelerators to reward overperformance.
If you’re rebuilding targets and ramp expectations, a structured 30-60-90 day plan for sales reps helps standardize what “good” looks like.
Activity-to-outcome ratio connects inputs to results. Raw activity numbers - calls made, emails sent - are meaningless without a quality counterweight. Track the ratio of activities to meetings booked, and meetings booked to qualified opportunities. When the ratio spikes (more activity, same outcomes) something's wrong with targeting or messaging. Forrester's research found that reps spend 27% of their time on non-selling activities, which means your activity metrics might be measuring busywork, not selling effort.
To define “activity” consistently across roles, use concrete sales activities examples instead of whatever your CRM happens to log.
Email response and connect rates measure whether your outreach is actually landing. Cold email response rates typically run 1-5% for cold outbound and 15-25% for warm sequences. Cold call connect rates average 4-6%. If you're below these ranges, the first thing to check isn't your messaging - it's your data. A 35% bounce rate doesn't just waste rep time; it poisons every downstream metric. Prospeo verifies emails with 98% accuracy on a 7-day refresh cycle, so your activity data reflects rep performance rather than data decay.
If bounce is the hidden culprit, track it explicitly as an email bounce rate KPI alongside reply rate.
ARR per FTE is the efficiency metric executives care about most. In the $50M-$100M ARR segment, the benchmark is $200K per employee. Companies above $100M ARR typically hit $300K. This number captures the full picture - not just sales productivity, but how efficiently the entire org converts headcount into revenue. If you're below $150K, you're likely overstaffed relative to revenue or underpricing your product.
What Good Looks Like in 2026
Two tables cover the critical benchmark ranges.
Funnel Conversion Benchmarks
| Stage | Benchmark | Source |
|---|---|---|
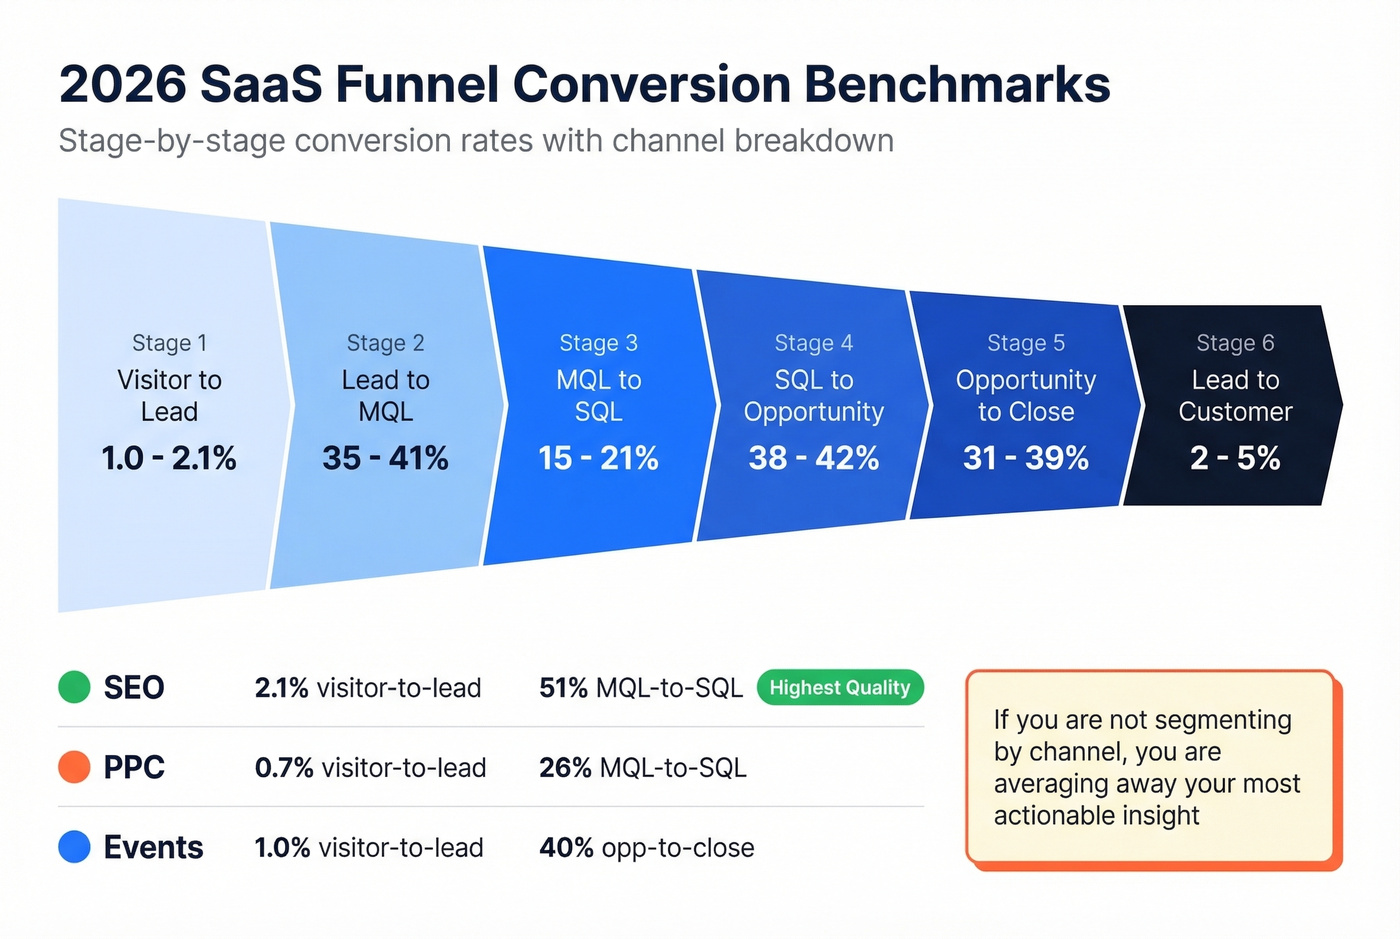
| Visitor to Lead | 1.0-2.1% | Aggregate SaaS data |
| Lead to MQL | 35-41% | Aggregate SaaS data |
| MQL to SQL | 15-21% | Aggregate SaaS data |
| SQL to Opportunity | 38-42% | Aggregate SaaS data |
| Opportunity to Close | 31-39% | Aggregate SaaS data |
| Lead to Customer | 2-5% | Aggregate SaaS data |
These ranges shift by channel. SEO-sourced leads convert at 2.1% visitor-to-lead with a 51% MQL-to-SQL rate - the highest quality top-of-funnel by a wide margin. PPC runs lower at 0.7% visitor-to-lead and 26% MQL-to-SQL. Events land somewhere in between at 1.0% and 24%, but carry a higher opportunity-to-close rate of 40%. If you aren't segmenting conversion metrics by channel, you're averaging away the most actionable insight in your funnel.
If you want to go deeper on funnel instrumentation, map these to a dedicated funnel metrics dashboard.
SaaS Economics Benchmarks
| Metric | Latest Median | Trend |
|---|---|---|
| NRR | 101% | Compressing |
| GRR | 88% | Down from 90% |
| New CAC Ratio | $2.00 per $1 ARR | Up 14% YoY |
| CAC Payback | ~12 months | Up 12.5% since 2022 |
| Expansion ARR Share | 40% of new ARR | +5pp YoY |
| Median Deal Size | $26,265 | Stable |
The expansion ARR number changes how you build your dashboard. Existing customers now generate 40% of total new ARR at median, and over 50% for companies above $50M. If your metrics framework doesn't account for expansion revenue, you're measuring half the picture. Salesforce's latest State of Sales data adds another dimension: reps using AI agents are 3.7x more likely to meet quota, and 88% say AI tools increase their odds of hitting plan. That isn't a future trend - it's a current performance variable your metrics should capture.
If you’re tying expansion into the same scorecard, pair NRR/GRR with a churn analysis view so you can separate retention from expansion.
Pipeline velocity depends on four variables - but all four collapse if your reps are dialing wrong numbers and bouncing emails. Prospeo delivers 98% email accuracy and 125M+ verified mobiles with a 30% pickup rate, so your activity-to-outcome ratios actually improve.
Stop measuring a broken funnel. Fix the data underneath it.
KPIs by Role
The relevance of a metric depends entirely on who's looking at it. SDRs should never be measured on revenue. CROs should never be measured on call volume.
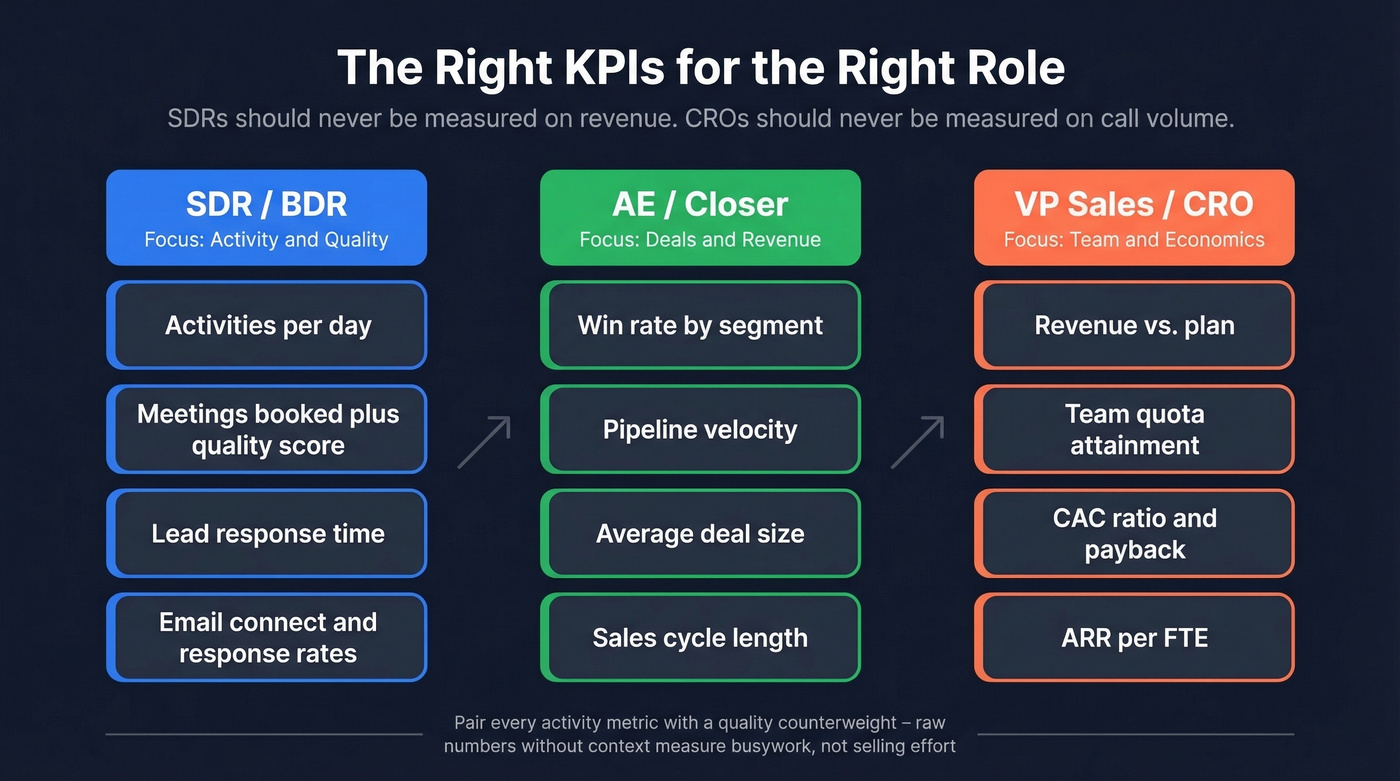
| SDR / BDR | AE / Closer | VP Sales / CRO |
|---|---|---|
| Activities per day | Win rate | Revenue vs. plan |
| Meetings booked + quality | Pipeline velocity | Team quota attainment |
| Lead response time | Average deal size | CAC ratio and payback |
| Qualification rate | Sales cycle length | NRR / GRR |
| Pipeline generated | Forecast accuracy | ARR per FTE |
Measure people on what they can control. An SDR can control activity volume and qualification quality. An AE can control deal progression and close rate. A CRO can control strategy, resource allocation, and the overall system. Misaligned KPIs create perverse incentives - and reps are very good at gaming metrics that don't reflect their actual job. The r/sales community has a term for this: "metric theater," where reps optimize for dashboard optics instead of actual revenue outcomes.
If you’re formalizing ownership and reporting, a sales operations metrics framework helps keep KPIs consistent across teams.
5 Leading Indicators Most Teams Ignore
Lagging metrics tell you the score. Leading indicators tell you whether you're about to win or lose.
1. Multithreading rate - the percentage of deals with 3+ engaged stakeholders. This is the single most predictive metric for enterprise deals. Single-threaded deals die when your champion changes roles, goes on vacation, or loses internal influence. I've seen teams increase enterprise win rates by 15+ points just by making multithreading a tracked, coached metric. If you track one new thing from this article, make it this.
2. Stage velocity - median days per pipeline stage. This identifies exactly where deals stall before they die. If your average deal spends 40 days in "proposal sent" but only 5 days in every other stage, you don't have a pipeline problem - you have a proposal problem. Pull this report weekly and watch for stages where median time exceeds your historical norm by more than 50%.
If you’re seeing consistent stalls, it’s usually one of the classic sales pipeline challenges hiding in plain sight.
3. Proposal engagement score - how prospects interact with your proposals predicts close rates with surprising accuracy. One study found that proposals opened within 24 hours with 8+ minutes of reading time close at 67%. Opened in 2-4 days with 3-7 minutes? 38%. Opened after 5+ days with under 2 minutes? Just 9%. Never opened? 2%. If you aren't tracking this, you're flying blind on deal health.
4. Deal slip rate - the percentage of deals that push from one forecast period to the next. A healthy slip rate is under 20%. When it climbs above 30%, your forecasting process is broken and your pipeline is softer than it looks. Track this at the rep level to identify who consistently over-commits and needs coaching on deal qualification.
5. Champion engagement score - a composite of how frequently your primary contact responds, attends meetings, and shares materials internally. When champion engagement drops mid-deal, the opportunity is dying whether the CRM stage reflects it or not. Build a simple scoring rubric: responsive within 24 hours = 3 points, attends all scheduled calls = 2 points, introduces you to other stakeholders = 3 points. Anything below 5 out of 8 is a red flag.
5 Metric Mistakes That Mislead
Mistake #1: Measuring activity without quality counterweights. When you measure meetings booked without meeting quality, reps book garbage meetings. The r/sales community calls these "tension metrics" - you need to balance quantity, quality, and resource cost so optimizing one doesn't destroy another. Every activity metric needs a quality partner. Calls made pairs with conversations held. Emails sent pairs with reply rate. Meetings booked pairs with meetings that advance to a next step.
Mistake #2: No benchmarks. A 22% win rate means nothing if you don't know the industry range is 20-30%. Without context, every number is just a number. Use the benchmarks in this article as starting points, then build internal baselines over 2-3 quarters. Your own historical trend matters more than any external benchmark - but you need external context to know whether your baseline is healthy.
Mistake #3: Ignoring data quality. This is the mistake that corrupts everything downstream. Bad data costs organizations $12.9M annually according to Gartner, and McKinsey estimates missed pipeline opportunities from bad data can cost up to 30% of revenue potential. Forrester adds that reps spend 27% of their time on non-selling activities - much of it cleaning up bad records, re-researching contacts, and working around bounced emails.
Every metric in this article assumes your contact data is accurate. If your email bounce rate is above 5%, your outreach metrics are lying to you. When Snyk's 50 AEs started using verified data from Prospeo, their bounce rate dropped from 35-40% to under 5% and AE-sourced pipeline jumped 180%, generating 200+ new opportunities per month. Clean data isn't optional - it's the prerequisite for trustworthy metrics.

Mistake #4: Dashboard without a review cadence. Weekly reports that nobody acts on are just expensive wallpaper. Metrics need a cadence and an owner, or they're decoration. Assign every metric to a specific person who reviews it at a specific interval and has the authority to act on what they see.
Mistake #5: Tracking 30 metrics instead of 12. One practitioner put it perfectly: too much data and lack of focus makes it impossible to reach clear "aha" moments. Choose metrics by role, not by what your CRM can display. If a metric doesn't change a decision within a week, delete it from the dashboard. Your team will thank you.
If your qualification rate is below 15%, bad contact data might be the hidden bottleneck. Prospeo refreshes 300M+ profiles every 7 days - not every 6 weeks - so your reps reach real buyers, not dead ends. Teams using Prospeo book 26% more meetings than ZoomInfo users.
Better data in, better metrics out. Starting at $0.01 per email.
Your Review Cadence
Metrics without a cadence are just numbers on a screen.
| Cadence | What to Review | Who Owns It |
|---|---|---|
| Daily | Activities: calls, emails, meetings booked | Reps + frontline managers |
| Weekly | Pipeline: coverage, stage velocity, new pipeline created | Managers + RevOps |
| Monthly | Performance: win rate, cycle length, quota attainment | Directors + VPs |
| Quarterly | Strategic: CAC, NRR, ARR per FTE, forecast accuracy | CRO + executive team |
Your daily activity metrics should reflect whether reps are hitting the proven 8-12 touchpoint cadence over 17-21 days that Outreach's research identifies as the sweet spot for outbound sequences. At the strategic level, McKinsey's research shows that systematic engagement processes drive 10-20% pipeline improvements. The cadence itself is the system.
Look - the biggest gap we see isn't missing sales team performance metrics. It's missing accountability. Assign every metric to a specific person at a specific cadence. If nobody owns it, nobody fixes it.
FAQ
What's the difference between sales metrics and sales KPIs?
A metric measures what's happening - total revenue, deal count, call volume. A KPI measures what matters against a specific goal, like revenue growth rate versus your quarterly target. Every KPI is a metric, but not every metric deserves KPI status. Track 10-12 total and promote 4-5 to KPIs per role based on what that role can actually influence.
How many metrics should a sales team track?
Track 10-12 total, segmented by role. SDRs need 4-5 activity and pipeline generation metrics. AEs need 4-5 deal and revenue efficiency metrics. Executives need 4-5 strategic and economic metrics. More than that creates dashboard noise without improving decisions - if a metric doesn't change someone's behavior, cut it.
How do you ensure sales metrics are accurate?
Start with data quality. If your CRM contact data has a bounce rate above 5%, every downstream metric is compromised. Enforce CRM hygiene standards and audit data completeness quarterly - a metric built on dirty data gives you confidence in the wrong direction.
What are the highest-impact sales KPIs?
Win rate, pipeline velocity, quota attainment, sales cycle length, and CAC ratio cover the three pillars of any performance framework: funnel health, revenue efficiency, and team productivity. Layer in leading indicators like multithreading rate and stage velocity to catch problems before they hit the revenue line.