Sales Win Rate by Industry: Benchmarks Nobody Agrees On
You're prepping for a QBR, you need a sales win rate by industry benchmark, and the first three sources you find say 47%, 21%, and 1.1%. Same metric, same search, wildly different numbers. You're not losing your mind - the data really is that messy.
Quick version: Win rates range from around 1% to 47% because sources measure different things. Pipeline-stage win rate averages ~20-21%. Proposal-stage win rate benchmarks around 47%. The tables below give you both, by industry, so you can benchmark against the right number.
What Is Sales Win Rate?
The formula is simple: Deals Won / Deals Pursued x 100. If your team worked 50 opportunities last quarter and closed 12, that's a 24% win rate.
The hard part isn't the math. It's defining "deals pursued." That denominator is where every benchmark disagreement starts, and it's why the numbers you find online look like they're describing different planets.
Why Benchmarks Contradict Each Other
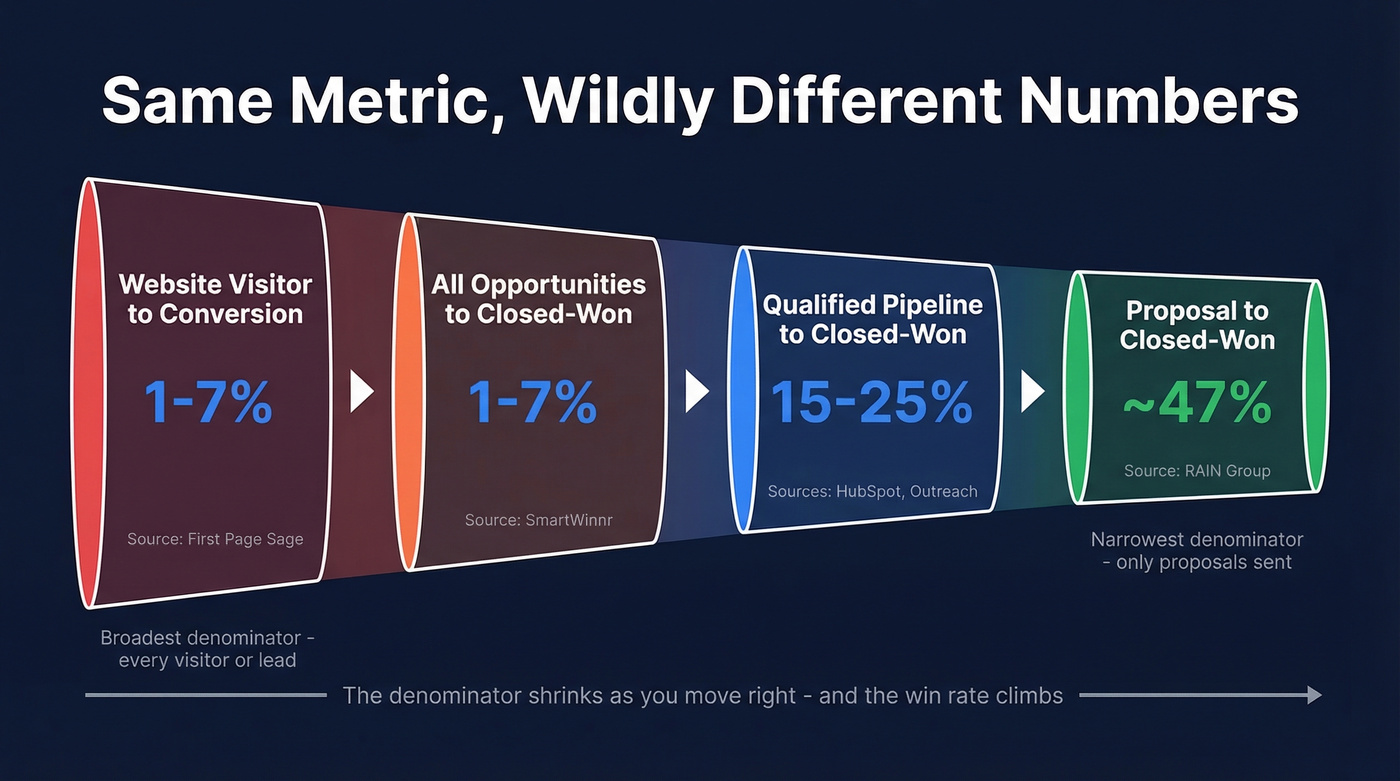
Four different measurement tiers produce four completely different "win rates":
| Measurement Tier | What's Counted | Typical Range | Sources Using This |
|---|---|---|---|
| Website visitor to conversion action | All inbound traffic | 1-7% | First Page Sage |
| All opportunities created to closed-won | Every opp in CRM, including early-stage | ~1-7% | SmartWinnr |
| Qualified pipeline opp to closed-won | Opportunities that passed qualification | 15-25% overall, ~29% for qualified opps | HubSpot, Outreach |
| Proposal to closed-won | Late-stage deals only | Around 47% | RAIN Group |
RAIN Group's benchmark of 47% comes from 472 sellers and sales executives measuring wins against proposals or quotes sent. HubSpot's ~20% comes from a 1,000+ person survey measuring close rate across industries. SmartWinnr's 1.1% counts every opportunity created, including early-stage opportunities that never made it to a real conversation.
First Page Sage and SmartWinnr produce similarly low numbers but measure different things - website conversions vs. CRM opportunity close rates. The percentages also mirror each other closely across several industries, suggesting shared or overlapping underlying data.
There's also the buyer's perspective. Altify's study of 1,245 sales professionals found that if three vendors are shortlisted, the baseline win rate is simply 33% - one divided by the number of competitors. New-logo acquisition win rates differ meaningfully from expansion deals, which face fewer competitors and shorter cycles. Expansion win rates by deal size tend to be significantly higher than new-business rates, especially for upsells under $50k where the buyer already trusts the vendor.
We've seen teams panic over a 15% win rate when their denominator includes every inbound lead. Know which tier you're measuring before you sound the alarm.
Close Rates by Industry (All Opportunities)
This table uses SmartWinnr's data, which measures closed-won deals divided by all opportunities created. These numbers look low because the denominator includes everything - early-stage, disqualified, the works.
| Industry | Close Rate (%) |
|---|---|
| Legal Services | 7.4 |
| POS Services | 7.0 |
| Medical Devices | 3.1 |
| Heavy Equipment | 3.0 |
| Lending/Loan Servicing | 3.0 |
| Commercial Real Estate | 2.8 |
| Shipping & Logistics | 2.7 |
| Industrial IoT | 2.2 |
| Call Center/Customer Service | 2.0 |
| Pharmaceutical Sales | 2.0 |
| Commercial Insurance | 1.7 |
| B2B Software/SaaS | 1.1 |
| Computer Product Mfg | 1.1 |
If your CRM counts every inbound lead as an "opportunity," these are your benchmarks. Legal services topping the list at 7.4% makes sense - the buyer intent behind "I need a lawyer" is dramatically higher than behind "I'm evaluating SaaS platforms."
Opportunity-Stage Win Rates
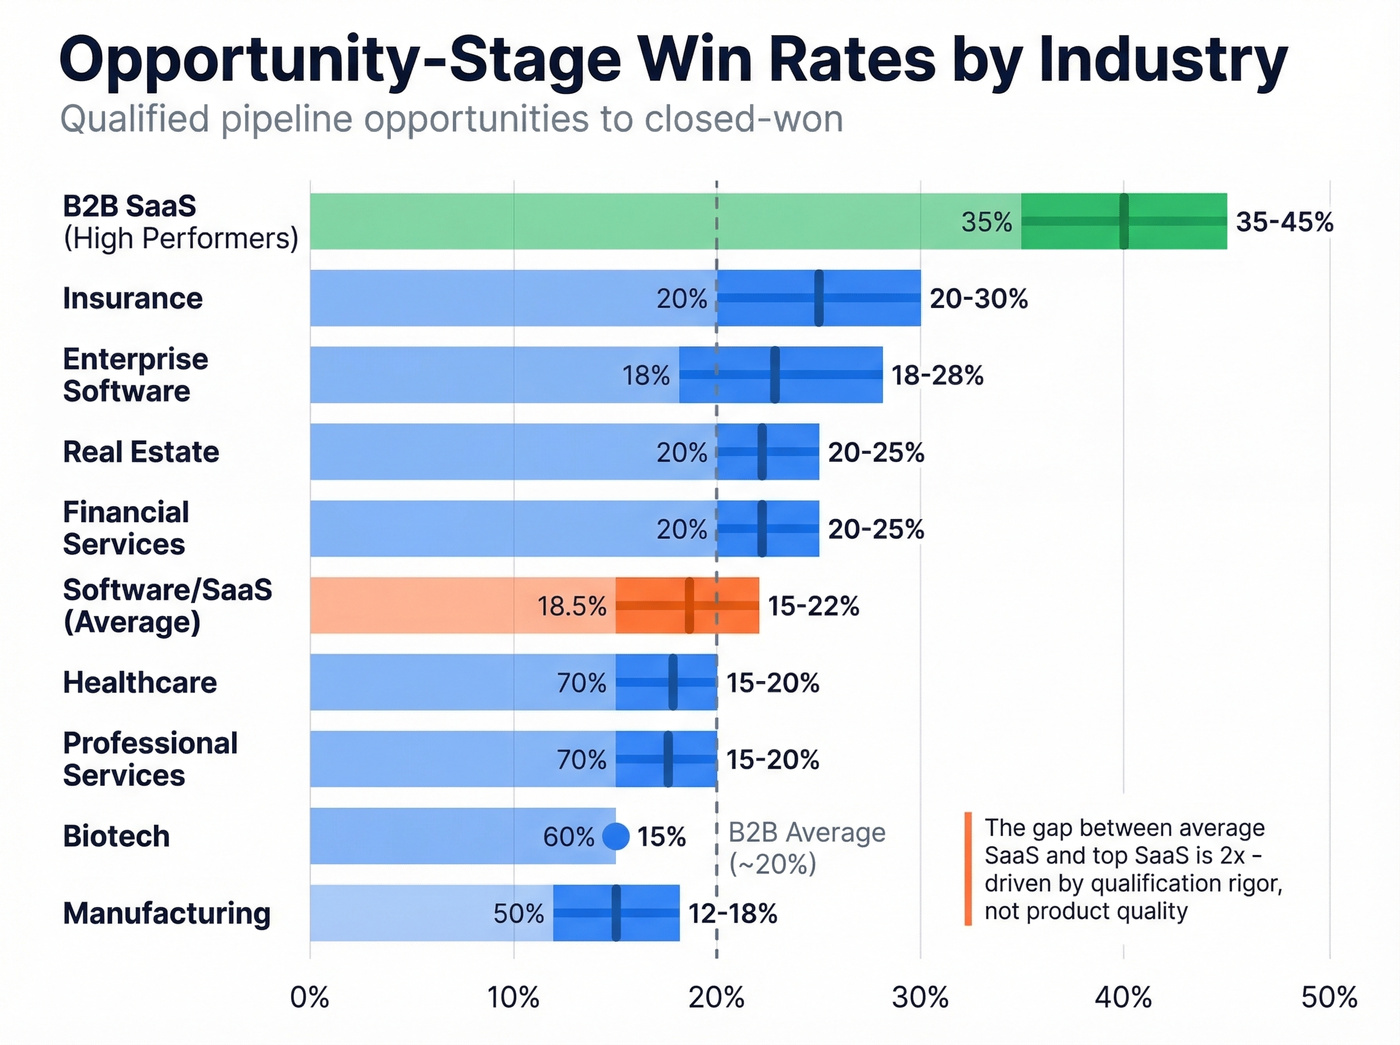
This is what most sales leaders actually mean when they say "win rate." The table below compiles pipeline/opportunity-stage benchmarks from HubSpot, DigitalThriveAI, and RevNew.
| Industry | Win Rate Range (%) |
|---|---|
| B2B SaaS (high performers, opportunity to closed-won) | 35-45 |
| Insurance | 20-30 |
| Enterprise Software | 18-28 |
| Real Estate | 20-25 |
| Financial Services | 20-25 |
| Software/SaaS (average) | 15-22 |
| Healthcare | 15-20 |
| Professional Services | 15-20 |
| Biotech | ~15 |
| Manufacturing | 12-18 |
The gap between "average SaaS" at 15-22% and "high-performing SaaS" at 35-45% is massive. That spread usually comes down to qualification rigor and deal velocity, not product quality. DigitalThriveAI places enterprise software lower (5-15%) because their data likely includes earlier-stage leads - another reminder that the denominator drives everything.
When you break down win rates by segment - SMB, mid-market, enterprise - the patterns shift further, which is why a single industry average rarely tells the full story.
Deals with a known contact close at 37% - nearly 2x cold outreach. Prospeo's 300M+ profiles and 98% verified emails help your reps reach decision-makers directly, cutting cycle times and boosting win rates across every industry.
Stop losing deals to bad contact data. Start reaching the right buyers.
Win Rate by Deal Size and Cycle Length
Here's the thing: deal size and cycle length are often better predictors than industry alone.
If you're trying to improve win rates systematically, it helps to map these drivers to your broader sales pipeline benchmarks and pipeline health metrics.
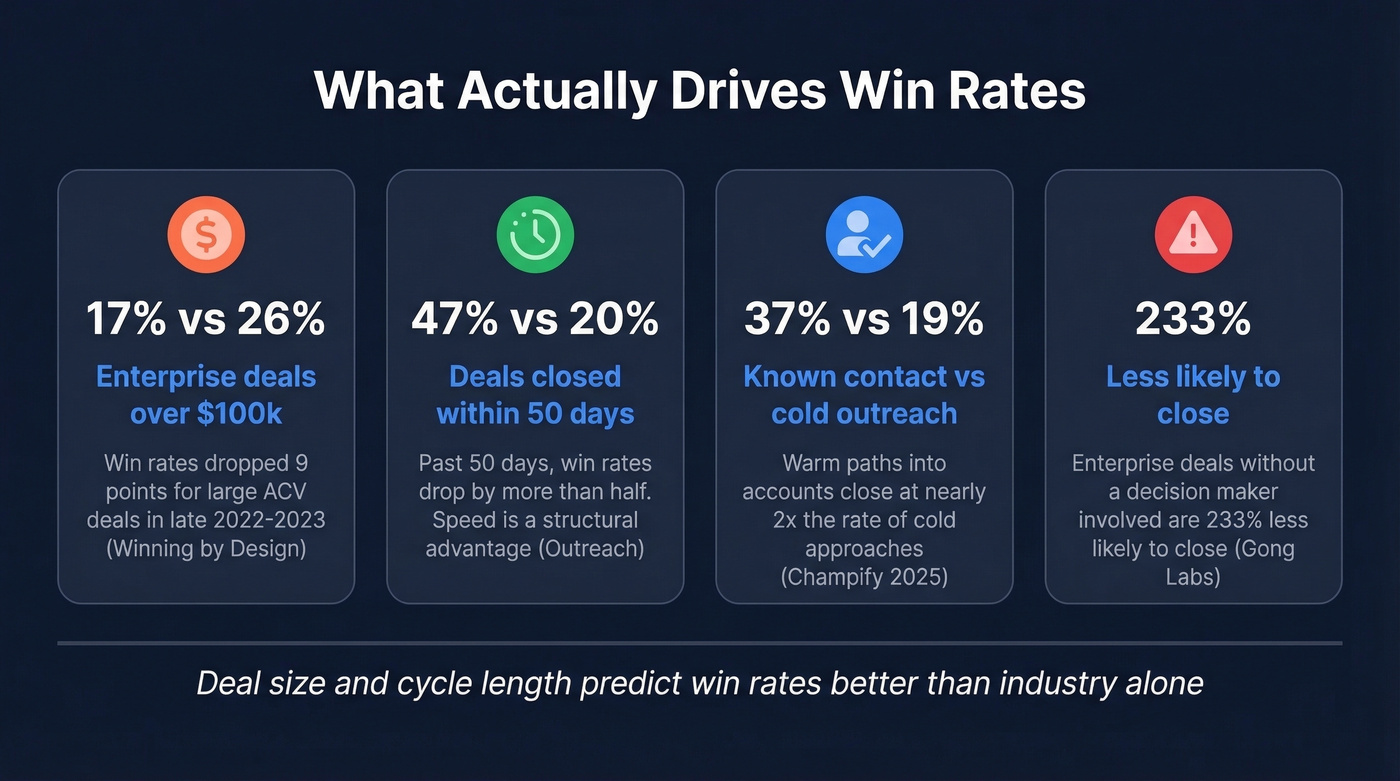
Deal size matters. Winning by Design found that enterprise deal win rates for ACV above $100k fell from ~26% to ~17% in late 2022/early 2023. More stakeholders, longer procurement, more chances for a deal to die quietly in someone's inbox.
Speed kills (in a good way). Outreach's data shows opportunities closed within 50 days carry a 47% win rate. Past 50 days, that drops to 20% or lower. Enterprise software deals often stretch 6-18 months, compounding the decay effect with every additional week.
Known contacts win more. Champify's 2025 Impact Report found deals involving a known contact close at 37% vs. 19% for cold outreach - nearly 2x more effective. Warm paths into accounts aren't a nice-to-have; they're a structural advantage.
Decision-maker access changes outcomes. Gong Labs data shows enterprise deals are 233% less likely to close if the decision maker isn't involved. That stat alone should reshape how your team qualifies using a real ideal customer profile and a consistent lead scoring model.
Geography plays a role too. Win rates by region can vary by 5-10 percentage points depending on competitive density, buying culture, and economic conditions in a given market.
If your average deal cycle exceeds 50 days and your ACV is under $50k, your win rate problem is almost certainly a qualification problem. You're letting deals linger that should've been disqualified or fast-tracked weeks ago.
2023-2026 Trends
Win rates aren't static, and the trend isn't encouraging.
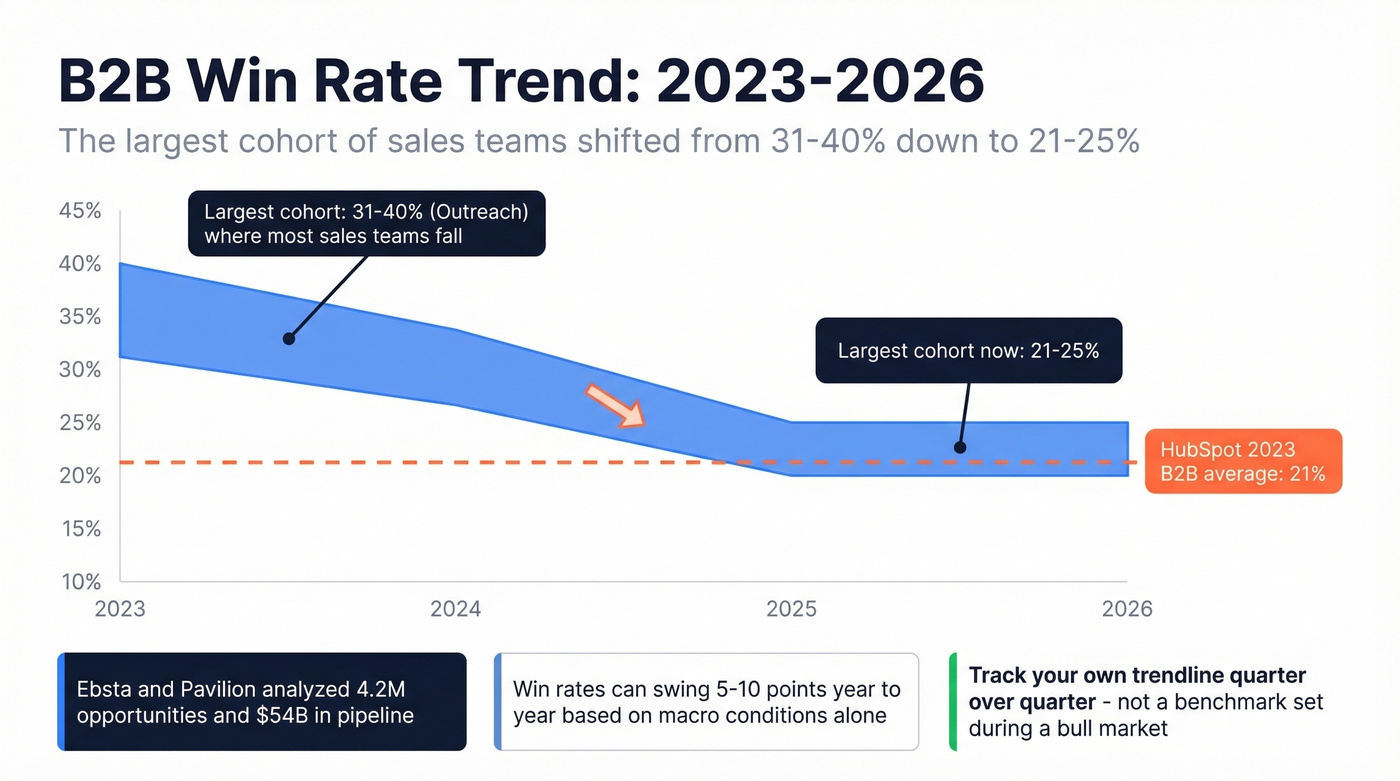
HubSpot's 2024 Sales Trends Report pegged the average B2B win rate in 2023 at 21%. Outreach's platform data shows the largest cohort of sales teams now falls into the 21-25% bracket, down from 31-40% a year prior. That's meaningful compression.
Ebsta and Pavilion's analysis of 4.2M opportunities and $54B in pipeline confirms the volatility - win rates can swing 5-10 percentage points year-to-year based on macro conditions alone. If your win rate dropped in 2024 or 2025, you're not alone.
Let's be honest: chasing a benchmark during a down cycle is a trap. In our experience, the teams that weather these shifts best are the ones tracking their own trendline quarter-over-quarter instead of comparing to a number that was set during a bull market - especially when your sales forecasting solutions and sales operations metrics aren’t aligned.
How to Diagnose a Low Win Rate
Before you overhaul your sales process, run through these diagnostics.
Are you measuring the right stage? If you're comparing your all-pipeline number to someone else's proposal-stage benchmark, you'll always look bad. Align your denominator first using a consistent set of funnel metrics.
Is your qualification too loose? One poster on r/sales described a team with a 55% discovery show rate, 30% opportunity acceptance rate, and a 4% win rate. The problem wasn't closing - it was letting unqualified deals into the pipeline in the first place.
Are deals stalling past 50 days? If more than half your open pipeline is older than 50 days, those deals are dragging your rate down. Kill them or re-engage them with a new angle.
Is bad contact data inflating your denominator? Every bounced email or disconnected number creates a phantom "lost" deal that tanks your win rate. Prospeo verifies emails at 98% accuracy on a 7-day refresh cycle, so dead contacts don't pollute your metrics. If stale data is creating phantom opportunities, cleaning your inputs is the fastest fix - start with data enrichment and a tighter lead generation workflow.
Are you tracking win rate by rep? One underperforming rep can pull the whole team number down. Segment before you diagnose.

Win rates drop to 20% past 50 days. Every week your rep spends hunting for the right contact is a week your deal decays. Prospeo delivers verified emails at $0.01 each and 125M+ direct dials with a 30% pickup rate - so your team reaches decision-makers before the window closes.
Shorten your deal cycle by reaching buyers on day one, not day forty.
FAQ
What's a good sales win rate?
For qualified pipeline opportunities, 20-30% is solid across most B2B industries. From the proposal stage, around 47% is the benchmark. If you're consistently above 40% on qualified pipeline, your team is outperforming the vast majority of peers.
Why is my win rate lower than published benchmarks?
Most likely a denominator mismatch. If your CRM counts every opportunity created - including early-stage and disqualified deals - your rate will look far lower than benchmarks counting only proposals sent. Align your measurement tier before comparing.
How can I improve my win rate without changing my sales process?
Start with data quality - verify contact data before leads enter your pipeline to remove dead opportunities. Then tighten qualification criteria and kill deals stalling past 50 days. Teams that clean their CRM inputs typically see a 3-5 point win rate lift just from removing phantom losses.
Does deal size affect win rate more than industry?
Yes, in most cases. Winning by Design data shows ACV above $100k correlates with win rates 8-10 points lower than deals under $50k, regardless of vertical. Cycle length and stakeholder count matter more than the industry label on the deal.