A Strategic Sales Plan Example You Can Actually Use - Filled In, With Real Numbers
Your VP wants a strategic sales plan by Friday. You've downloaded four templates. They're all blank shells with headers like "Revenue Target: ___" and "ICP: ___." That's not a plan - that's a worksheet.
A basic sales plan sets targets. A strategic one reverse-engineers the math to get there. What follows is a complete, filled-in strategic sales plan example for a mid-market SaaS company - every number explained - plus segment-specific variations for SMB and enterprise. Steal the structure, swap in your numbers.
Why Most Sales Plans Fail
Even after quotas were reduced across the industry, nearly 77% of sellers still missed their number in recent years. And 47% of companies cite market uncertainty as their top planning challenge. The plan wasn't the problem. The plan's relationship to reality was.
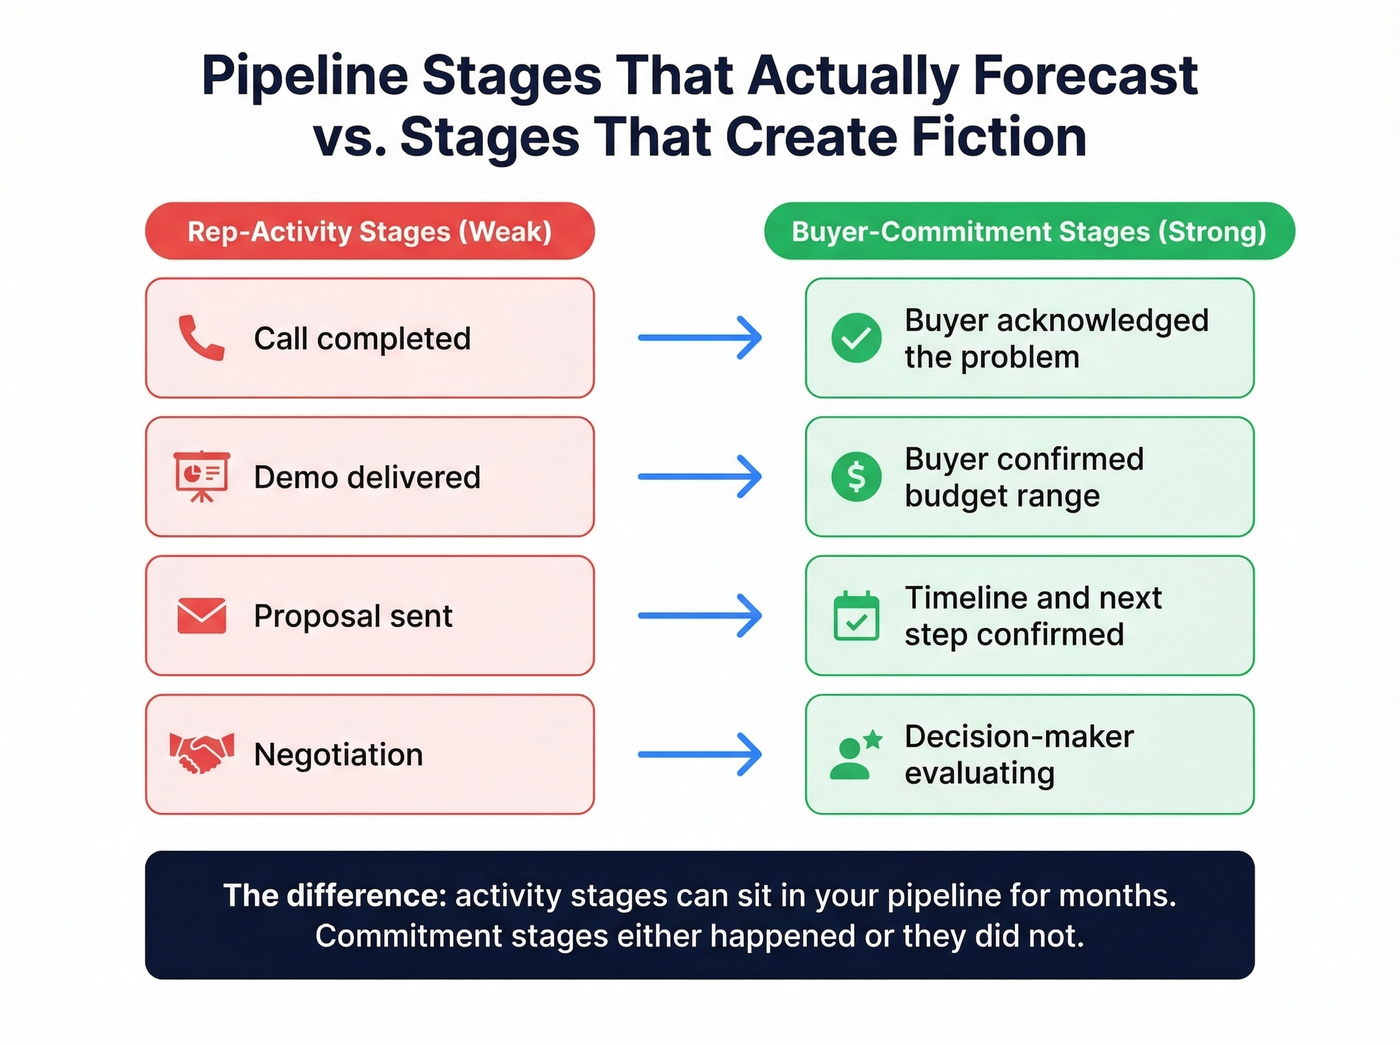
Most plans fail for two reasons. First, they define pipeline stages by rep activity ("demo delivered," "proposal sent") instead of buyer commitment ("confirmed budget range," "involved a decision-maker"). A rep can send 50 proposals and have zero committed buyers. The plan looks healthy right up until the quarter collapses.
Second, the plan is a static document. Someone builds it in November, presents it in December, and nobody touches it again until the next off-site. Meanwhile, 57% of sales professionals say cycles are getting longer, buyer behavior shifts quarterly, and the pipeline coverage number that looked safe in January is underwater by March. A plan that doesn't adapt quarterly isn't strategic - it's decorative.
The Filled-In Plan
This is a mid-market SaaS company targeting $5M ARR for the year. Every number below is explained so you can swap in your own. Want this as a spreadsheet? Copy the pipeline math table into your own sheet and replace the assumptions with your actuals.
Revenue Targets & Pipeline Math
The annual target is $5M, which breaks down to $1.25M per quarter. Average deal size is $31K. That means the team needs to close roughly 40 deals per quarter.
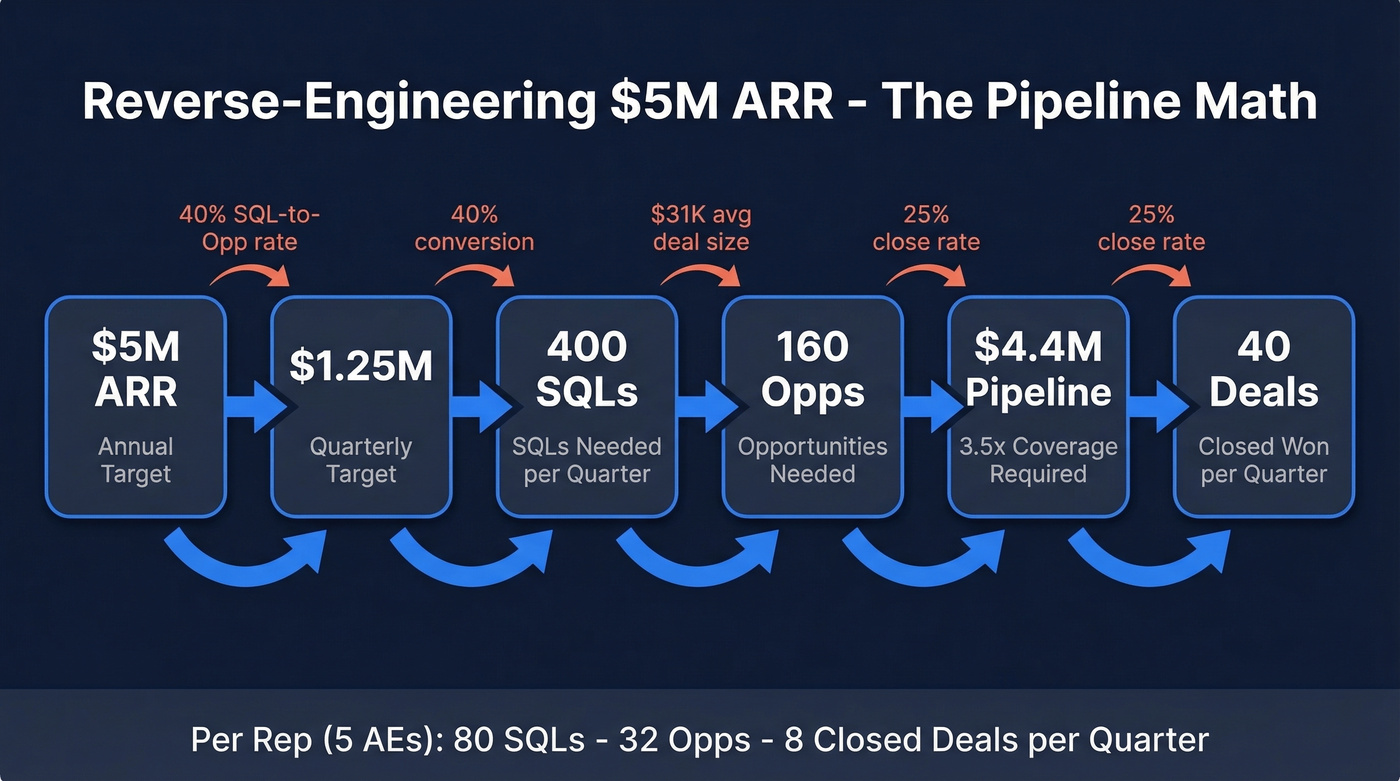
Most plans stop here. But the math keeps going. If your opportunity-to-close rate is 25% and your SQL-to-opportunity rate is 40%, you can reverse-engineer every number upstream.
| Metric | Number | How we got it |
|---|---|---|
| Quarterly target | $1.25M | $5M / 4 |
| Avg deal size | $31K | Historical data |
| Deals needed/quarter | 40 | $1.25M / $31K |
| Pipeline needed (3.5x) | $4.4M | 40 deals / 25% close rate x $31K |
| Opps needed | 160 | 40 / 25% close rate |
| SQLs needed | 400 | 160 / 40% SQL-to-Opp rate |
Divide by your effective headcount and you've got per-rep targets. With 5 effective AEs, each rep needs to work roughly 80 SQLs and close 8 deals per quarter - about 2 closed deals per month. Teams that skip this reverse-engineering step end up with a plan that looks great in December and falls apart by February because nobody did the upstream math.
ICP & Buyer-Commitment Stages
The ICP for this plan: mid-market SaaS companies, 50-500 employees, with a VP+ buyer. The team sells a platform deal that touches multiple stakeholders, so the pipeline stages need to reflect buyer behavior, not rep activity. If you need a quick structure, start with an ideal customer profile template and scoring rubric.
Here's the thing - this buyer-commitment framing keeps surfacing in sales communities for a reason. Reps want stages that reflect what the buyer actually committed to, not what the rep did. The difference is stark:
| Stage | Rep-Activity Version (Weak) | Buyer-Commitment Version (Strong) |
|---|---|---|
| Stage 1 | "Call completed" | Buyer acknowledged the problem |
| Stage 2 | "Demo delivered" | Buyer confirmed budget range |
| Stage 3 | "Proposal sent" | Timeline + next step confirmed |
| Stage 4 | "Negotiation" | Decision-maker evaluating |
The buyer-commitment model forces reps to validate real progress. A "demo delivered" can sit in your pipeline for months. A "buyer confirmed budget range" either happened or it didn't - there's no ambiguity. This distinction separates plans that forecast accurately from plans that produce fiction.
Territory Model & Headcount
Apply the 80/20x2 framework. Identify the 20% of accounts that drive 80% of revenue - those are Tier 1. Within the remaining 80%, find the 20% that drive 80% of that remainder - Tier 2 "hidden gems." Everything else is Tier 3. This is also where account-based selling becomes practical instead of theoretical.
| Tier | Accounts | Rep Assignment | Motion |
|---|---|---|---|
| Tier 1 | Top ~50 | Best 2 AEs | High-touch, multi-threaded |
| Tier 2 | ~200 gems | 2 mid-level AEs | Structured outbound + nurture |
| Tier 3 | ~1,000+ | 2 ramping AEs | Automated sequences, inbound |
Headcount: 6 AEs total. Two are ramping (months 1-3), so assume 50% productivity. Effective capacity = 5 FTE. Your pipeline math is built on this number - if a rep leaves, the math breaks and you need to adjust immediately, not at the next quarterly review.
Tech Stack & Activity Targets
Every tool should map to a planning variable. Sellers who partner with AI-powered sales tools are 3.7x more likely to meet quota, so the stack isn't optional - it's load-bearing.
- CRM (Salesforce, HubSpot): pipeline tracking, stage management, forecast roll-ups (see examples of a CRM if you're standardizing)
- Prospecting data (Prospeo): 98% verified email accuracy on a 7-day refresh cycle, which is what makes your activity math work - bounced emails blow up your conversion assumptions (use data enrichment services to keep records current)
- Forecasting (Clari, Gong): deal inspection, pipeline coverage tracking (compare sales forecasting solutions if you're evaluating)
- Enablement (Highspot, Seismic): content delivery, rep readiness
Per-rep weekly activity targets, derived from the pipeline math:
- 80 targeted outbound touches (email + phone) (more sales activities examples here)
- 15 discovery calls booked (pair with a discovery questions bank)
- 8 qualified opportunities advanced
- 2 proposals delivered to committed buyers
KPIs, Owners & Review Cadence
Every KPI needs an owner. If nobody owns it, nobody watches it.
| KPI | Owner | Frequency |
|---|---|---|
| Pipeline coverage (3.5x) | VP Sales | Weekly |
| Stage conversion rates | RevOps | Bi-weekly |
| Activity targets (per rep) | Sales Managers | Weekly |
| Quota attainment distribution | VP Sales | Monthly |
| Win rate by segment | RevOps | Quarterly |
Review cadence follows the Assess - Plan - Execute model: October assess what worked, November align territories and quotas, December execute so reps enter Q1 with a plan, not a scramble. If you run formal reviews, align this with your QBR meaning and format.
Your pipeline math assumes emails reach real inboxes. At 98% verified accuracy and a 7-day data refresh cycle, Prospeo is the prospecting layer that makes your activity targets actually convert. Bounced emails don't just waste time - they blow up every conversion assumption in your plan.
Fix the data before you finalize the plan.
Adapting the Plan by Segment
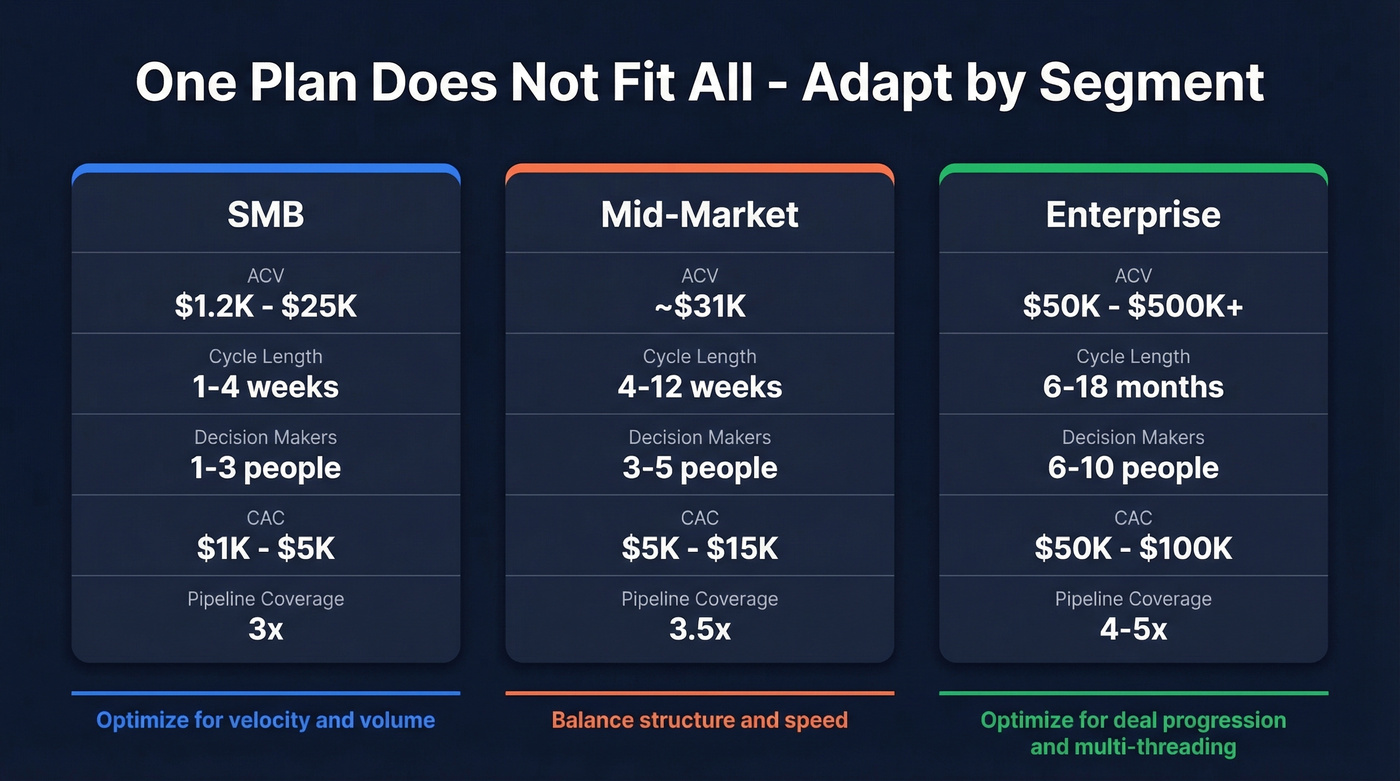
The plan above is built for a mid-market motion. Apply mid-market assumptions to an enterprise pipeline and your forecast will be wrong by 6-12 months.
| Variable | SMB | Mid-Market | Enterprise |
|---|---|---|---|
| ACV | $1.2K-$25K | ~$31K | $50K-$500K+ |
| Cycle length | 1-4 weeks | 4-12 weeks | 6-18 months |
| Decision makers | 1-3 | 3-5 | 6-10 |
| CAC | $1K-$5K | $5K-$15K | $50K-$100K |
| Pipeline coverage | 3x | 3.5x | 4-5x |
For SMB, velocity is everything - optimize for volume and speed. For enterprise, optimize for deal progression and multi-threading across a buying committee. We've seen the same frustration from teams selling complex technical solutions: a rep selling PLC/SCADA systems needs a plan that tracks which accounts have technical buy-in and which are stuck in procurement - not a weekly call target. If you're building for complex deals, borrow patterns from enterprise B2B sales.
Let's be honest: if your average deal closes under $10K, you probably don't need a 30-page strategic plan. You need a one-page pipeline math sheet and a weekly activity scorecard. The complexity of your plan should match the complexity of your sale.
Benchmarks That Ground Your Plan
Before you finalize anything, calibrate against reality.
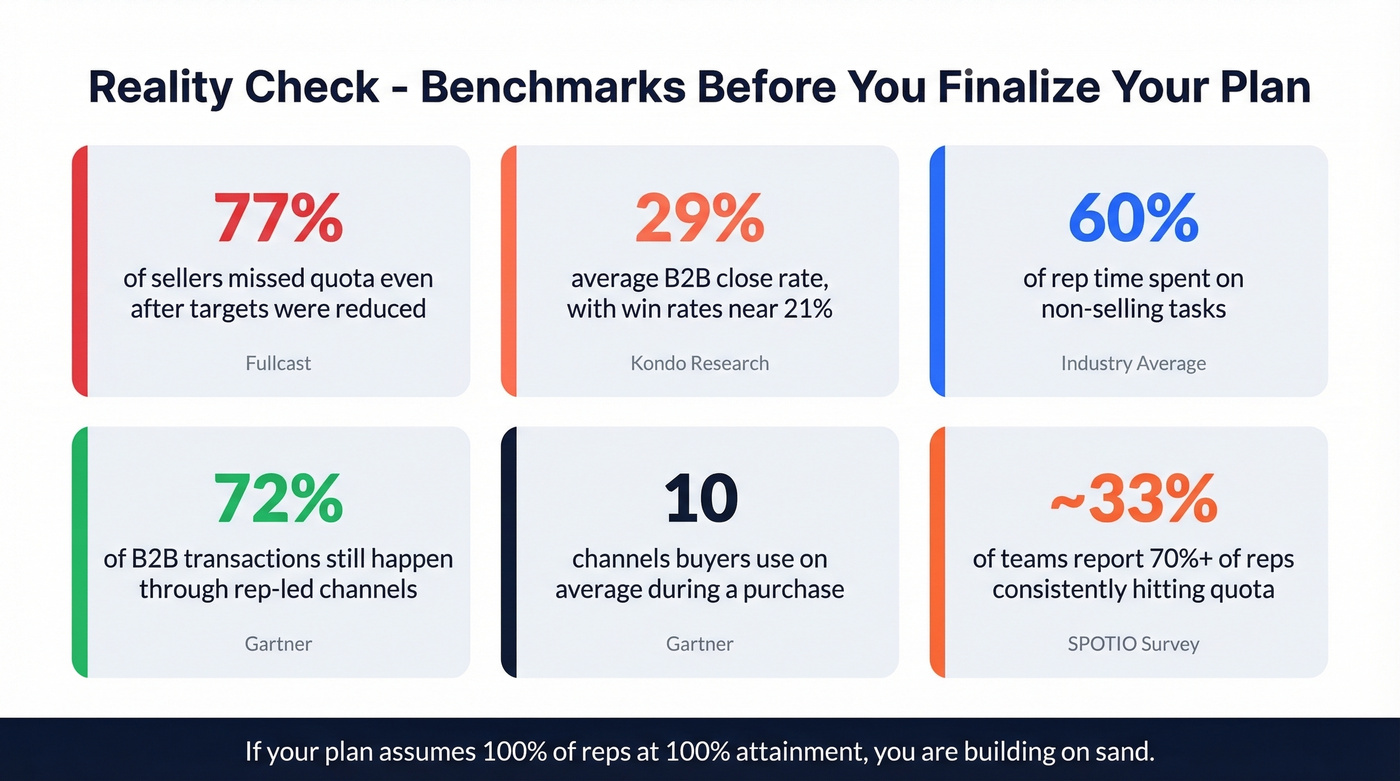
A SPOTIO survey of 452 field sales professionals found that only about a third of teams report 70%+ of reps consistently hitting quota. If your plan assumes 100% of reps at 100% attainment, you're building on sand.
Average B2B close rates run around 29%, with win rates near 21%. Buyers now use an average of 10 channels during a purchase, and 72% of B2B transactions still happen through rep-led channels - though Forrester predicts more than half of $1M+ deals will shift to digital self-serve. Your plan needs to account for both motions. If you want more calibration points, use these sales pipeline benchmarks to sanity-check assumptions.
Reps spend 60% of their time on non-selling tasks. That means your "5 effective AEs" deliver roughly 2 FTE of actual selling capacity. Build your activity model accordingly.
Mistakes That Kill Sales Plans
We've seen the same patterns sink otherwise solid plans:
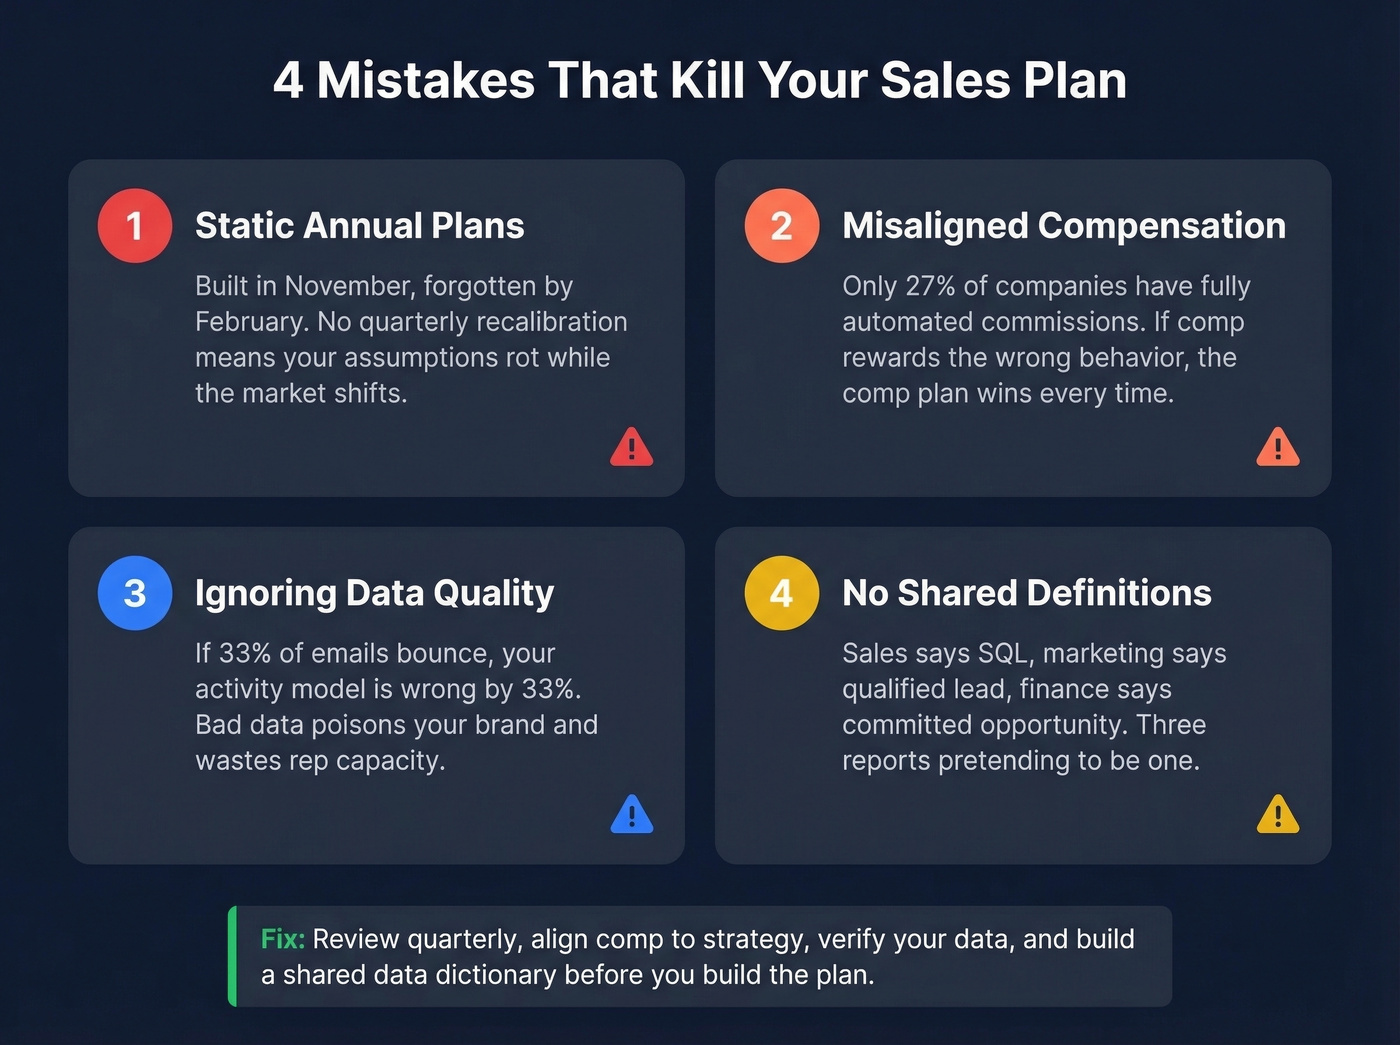
Static annual plans with no quarterly review. The market shifts. Your plan should too. Watch for warning signs: stagnant win rates, prolonged cycles, or shrinking deal sizes. Any of these means your assumptions need recalibrating - don't wait for the next off-site.
Misaligned compensation. Only 27% of companies have fully automated end-to-end commissions. If your comp plan rewards behaviors that conflict with your strategic plan, the comp plan wins every time. Reps follow the money.
Ignoring data quality. This one's frustrating because it's so preventable. Your plan says reps need 15 meetings per week. If a third of their emails bounce, they need 2x the attempts to hit that number - and your entire activity model is wrong by 33%. 73% of B2B buyers actively avoid sellers who send irrelevant outreach, so bad data doesn't just waste rep time - it poisons your brand. Snyk saw bounce rates drop from 35-40% to under 5% after switching to Prospeo, which made outbound conversion assumptions usable again. If you're troubleshooting this, start with email bounce rate benchmarks and fixes.
No shared definitions. If sales calls it an "SQL" and marketing calls it a "qualified lead" and finance calls it a "committed opportunity," your pipeline report is three different reports pretending to be one. Build a shared data dictionary before you build the plan.
Skip the 30-page plan if your team is under 5 reps and your ACV is under $15K. In our experience, a two-page doc with pipeline math, ICP definition, and weekly activity targets outperforms a polished deck that nobody opens after January.
You just reverse-engineered 400 SQLs per quarter. Now you need verified contact data for every one of them. Prospeo gives you 300M+ profiles with 30+ filters - buyer intent, technographics, headcount growth - so your territory tiers are built on real signals, not guesswork. At $0.01 per email, the math scales.
Turn your strategic plan into booked meetings this quarter.
FAQ
How long should a strategic sales plan be?
Three to five pages covering targets, pipeline math, ICP, territory assignments, and KPIs. Every rep should be able to read it in one sitting. Supporting spreadsheets - capacity models, territory maps, comp details - live separately and get updated by RevOps quarterly.
How often should you update your sales plan?
Quarterly at minimum. Review pipeline coverage, stage conversions, and quota attainment every 90 days. Adjust territory assignments based on what the data shows, not what you hoped in January. Teams that review monthly catch problems 60-90 days faster.
What pipeline coverage ratio should I use?
Use 3x for SMB, 3.5x for mid-market, and 4-5x for enterprise. The longer your sales cycle and the more decision-makers involved, the more pipeline you need to absorb deal slippage. If you're consistently closing above your coverage ratio, tighten it - excess pipeline just creates false urgency.
How do I fix bad data breaking my activity model?
Switch to a provider with verified contacts and a short refresh cycle. A 98% email accuracy rate with a 7-day data refresh keeps bounce rates under 5%, which means your conversion assumptions actually hold. Bad data inflates required activity by 30-50%, making every downstream metric unreliable.