How to Build Visual Sales Presentations That Actually Close Deals
Sales reps spend 31% of their working hours searching for and creating content. Meanwhile, 84% of them missed quota last year. Those two facts aren't unrelated.
The problem isn't that reps can't sell - it's that they're burning hours on decks that don't move deals forward, then running out of time to actually have conversations. Prettier slides don't close deals. More relevant slides do. The gap between a generic 40-slide deck and a tight visual sales presentation is the gap between a polite "we'll get back to you" and a signed contract.
Why Most Sales Decks Lose
Win rates hover around 21%, with close rates reaching 29% depending on how you measure. Fewer than one in four pitches win. And when Gong analyzed thousands of recorded sales calls, winning presentations averaged just 9.1 minutes. Not 30. Not 60. Nine.
Yet most reps show up with a 35-slide monster that opens with "About Us," meanders through a product feature tour, and ends with a pricing table that makes the CFO's eye twitch. The deck doesn't serve the buyer - it serves the rep's anxiety about forgetting something.
Reps get only about 2 hours of active selling per day. The rest disappears into content creation, CRM updates, and internal meetings. When a third of your working hours go to building decks that lose three out of four times, you don't have a sales problem. You have a presentation problem.
Here's the thing: buyers complete up to 67% of their decision-making before the first meeting. They've already read your website, checked G2 reviews, and talked to a peer who uses your competitor. Your deck isn't their introduction to you - it's their confirmation or rejection of what they already believe. That changes everything about how you should build it.
The Science Behind Visual Selling
The human brain processes visuals dramatically faster than text - by some estimates, 60,000 times faster. A clean chart lands instantly. A paragraph of the same data gets skimmed or skipped entirely. And 91% of B2B buyers now say they prefer interactive, visual content over static formats.
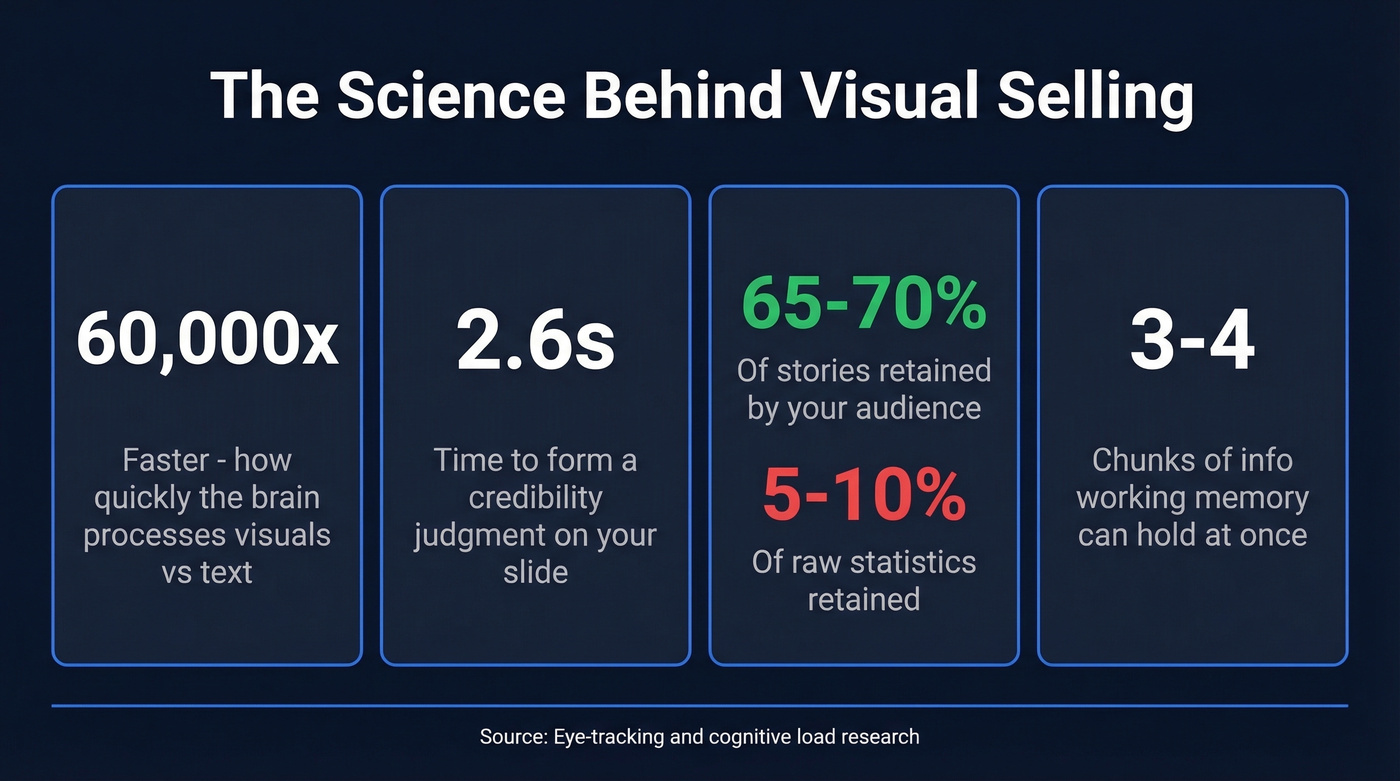
Eye-tracking studies with 500+ participants show audiences form credibility judgments in 2.6 seconds. Every slide needs to communicate its main point that fast. We call this the 5-Second Clarity Rule, and it should govern every design decision you make.
Working memory holds 3-4 chunks of information at once. Cram five data points onto a slide and you're not being thorough - you're causing cognitive overload. The research is even more damning for data-heavy decks: people retain 65-70% of stories but only 5-10% of statistics. If your deck is a spreadsheet with a logo on it, your audience will forget almost everything by the elevator ride down.
Then there's the "Three Charms but Four Alarms" principle. Three key claims build persuasion. A fourth triggers skepticism. Keep it tight.
How to Structure a Visual Sales Deck
Your buyers have already done 67% of their homework. Your deck isn't an introduction - it's a closing argument. Structure it accordingly.
Two frameworks dominate effective sales presentations:
| Element | Before-After-Bridge | Problem-Impact-Solution |
|---|---|---|
| Opens with | Status quo pain | Specific problem |
| Middle | Desired outcome | Business impact |
| Closes with | Your product as bridge | Your solution |
| Best for | Aspirational sells | Technical/ROI sells |
| Tone | Visionary | Analytical |
Some teams use a hero's journey variant - departing the status quo, battling the refusal to change, crossing the threshold to a new solution. It works well for narrative-driven pitches where the buyer needs to feel the transformation, not just calculate it.
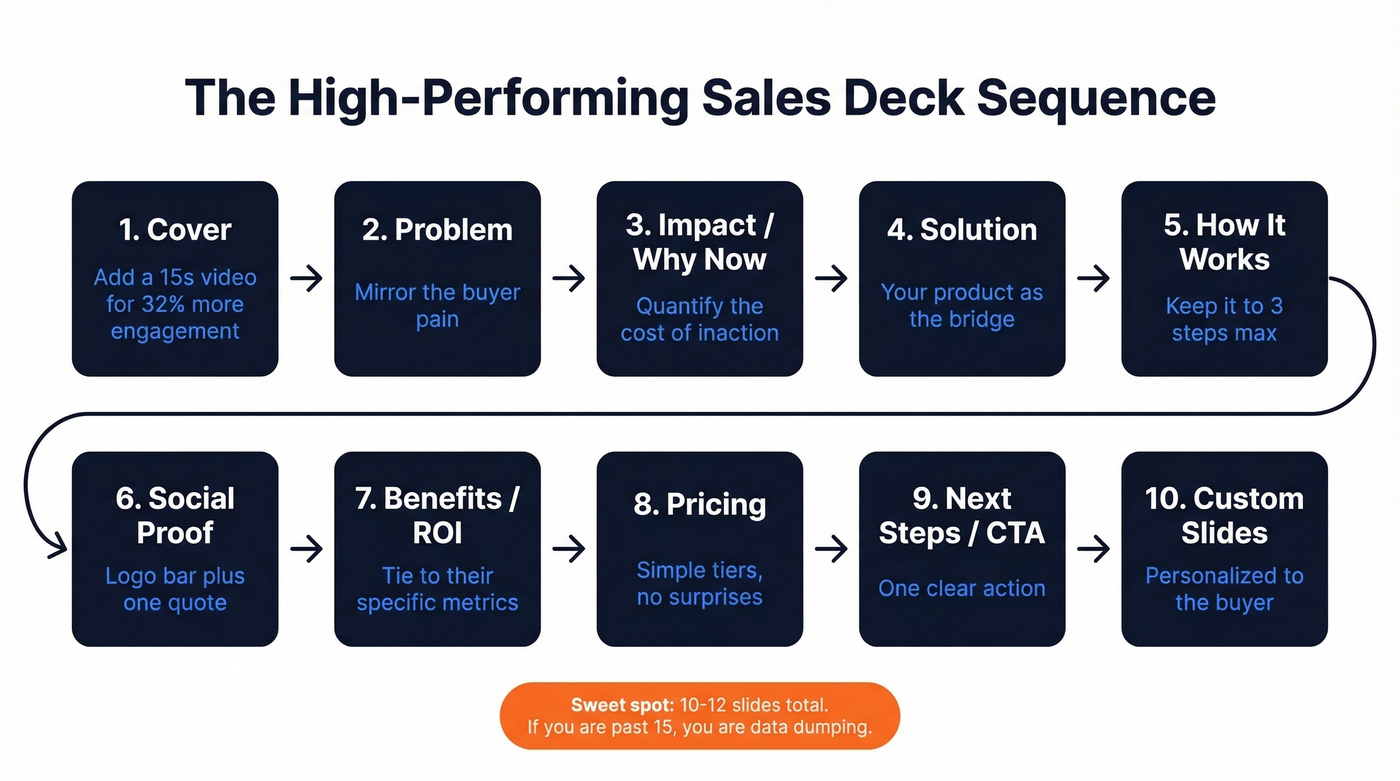
Whichever framework you choose, a high-performing sequence usually looks like this: Cover, Problem, Impact/Why Now, Solution, How It Works, Social Proof, Benefits/ROI, Pricing, Next Steps/CTA. That's 8-10 core slides. Add a couple for customization and you're at 10-12, right in the sweet spot. Adding video to your cover slide alone drives 32% more interaction, so consider embedding a 15-second clip there instead of a static image.
The 3-Idea Rule
Focus your entire deck on three central ideas maximum. Every slide should carry one idea. If you can't explain the slide's purpose in a single sentence, split it or cut it. We've seen teams cut their decks from 30 slides to 12 and watch close rates climb - not because they removed information, but because they removed noise.
If your deck is longer than 15 slides, you're data dumping.
2026 Design Trends That Work
Based on SlideEgg's analysis of 100,000+ template downloads, here's what's actually performing right now:
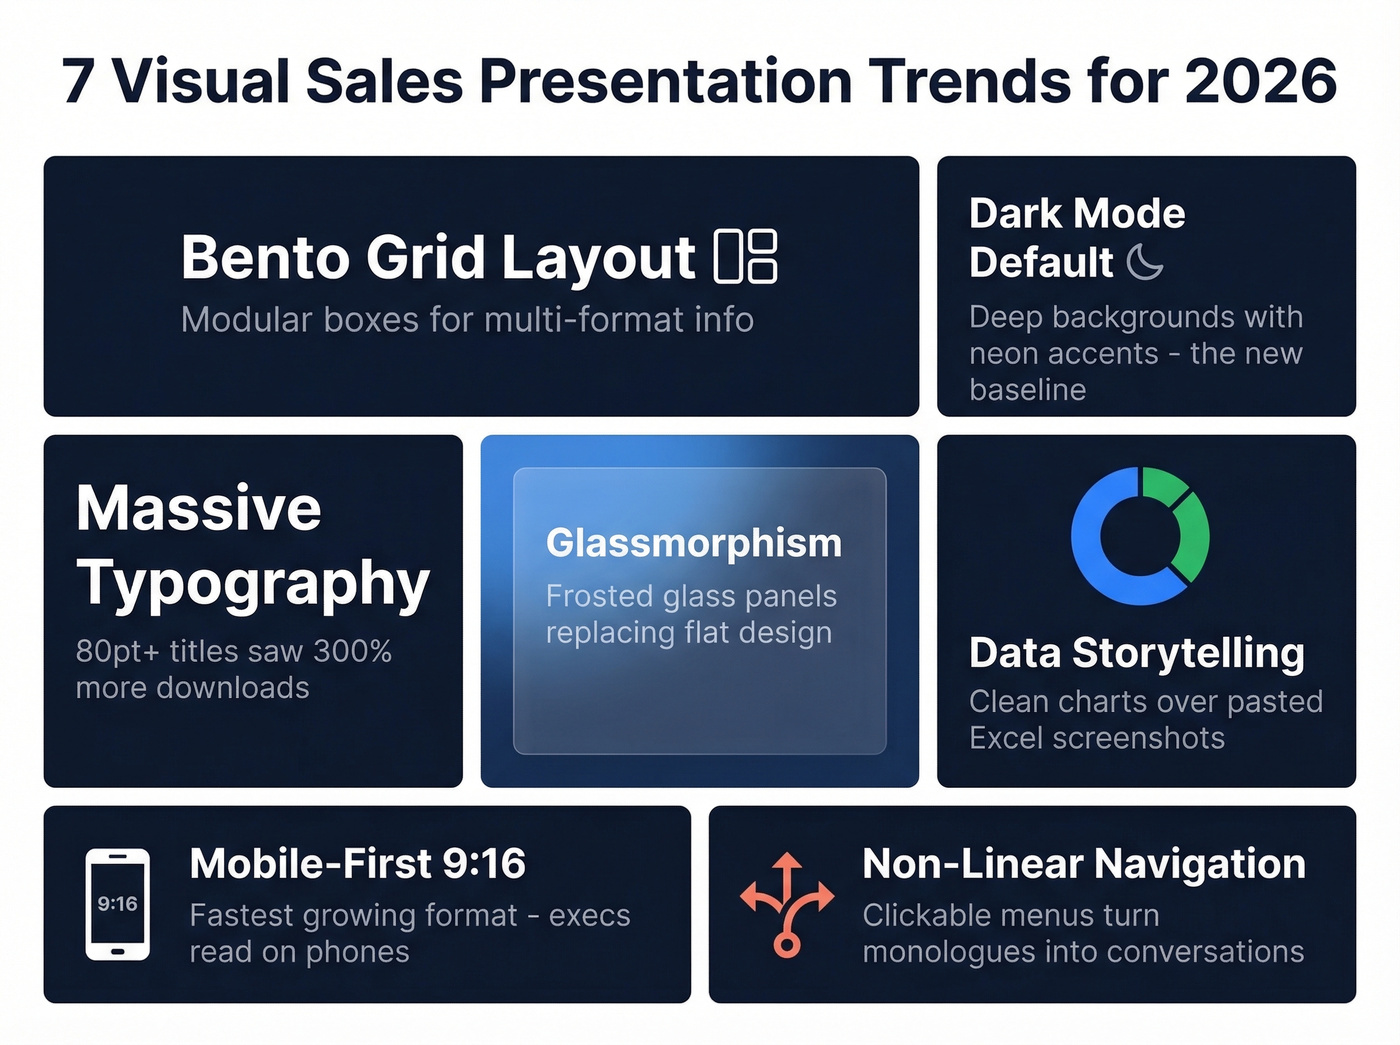
Bento grid layout. Inspired by Apple's product pages, these modular rectangular boxes let you organize a chart, a quote, and a photo on one slide without visual chaos. It's the cleanest way to present multi-format information.
Dark mode as default. Deep charcoal backgrounds with neon accents - lime green, electric blue - reduce eye strain on LED screens and make data visualizations pop. Dark mode isn't a trend anymore. It's the new baseline.
Massive typography. Downloads for decks using 80pt+ bold sans-serif titles spiked 300%. When your title takes up half the screen, there's no ambiguity about the slide's message.
Glassmorphism. The frosted glass effect is replacing flat design across pitch decks and product demos. Semi-transparent panels layered over background imagery create depth without clutter, and it's particularly effective for SaaS product screenshots where you want the UI to feel modern.
Data storytelling over data dumping. Clean donut charts, Sankey diagrams, and simplified funnels are replacing pasted Excel screenshots. If you're still screenshotting a pivot table, you're losing credibility before you say a word. Crunchbase's data visualization guide recommends limiting chart categories to 4-7 and using color to tell the story, not decorate it.
Mobile-first slides. The 9:16 vertical format is the fastest-growing category. Executives read decks on phones between meetings. If your deck only works on a projector, half your audience never sees it properly.
Non-linear navigation. Clickable menus that let you jump to sections based on audience questions turn a monologue into a conversation. Fujitsu uses a central visual as a navigation portal showing six customer challenges - the buyer picks their path, which means they engage with the content that actually matters to them instead of sitting through slides meant for someone else.
Let's be honest, though: these trends matter only after you've nailed the substance. A gorgeous bento grid layout with generic content still loses to an ugly deck that speaks directly to the buyer's problem. Design amplifies a good message. It can't rescue a bad one.
Before and After: Slide Redesigns
MideaHub's team has redesigned 500+ pitch decks. Three of their transformations illustrate the core principles.
A Go-to-Market slide crammed with text, arrows, and overlapping icons - classic information overload. The fix simplified it to three key areas with custom icons, pushing details to subsequent slides. One idea per slide, enforced ruthlessly.
A Use of Funds pie chart - the default choice for every founder since 2010. The redesign replaced it with a treemap chart that uses space more efficiently and creates better visual balance. Sometimes the "standard" chart type is the wrong one.
A financial data table - rows and columns of numbers that nobody processes in a live presentation. The redesign converted it into a growth chart with highlighted key numbers. The audience sees the trajectory instantly instead of squinting at cells. The pattern across all three: remove information that doesn't serve the immediate story. Every element earns its place or gets cut.
Reps spend 31% of their time on content and still miss quota. What if you spent less time building decks and more time personalizing them with verified buyer data? Prospeo gives you 30+ filters - including buyer intent and job changes - so every slide speaks directly to the right person.
Stop presenting to the wrong people. Find the right ones first.
Design by Delivery Context
How you deliver the presentation changes what "good design" looks like.
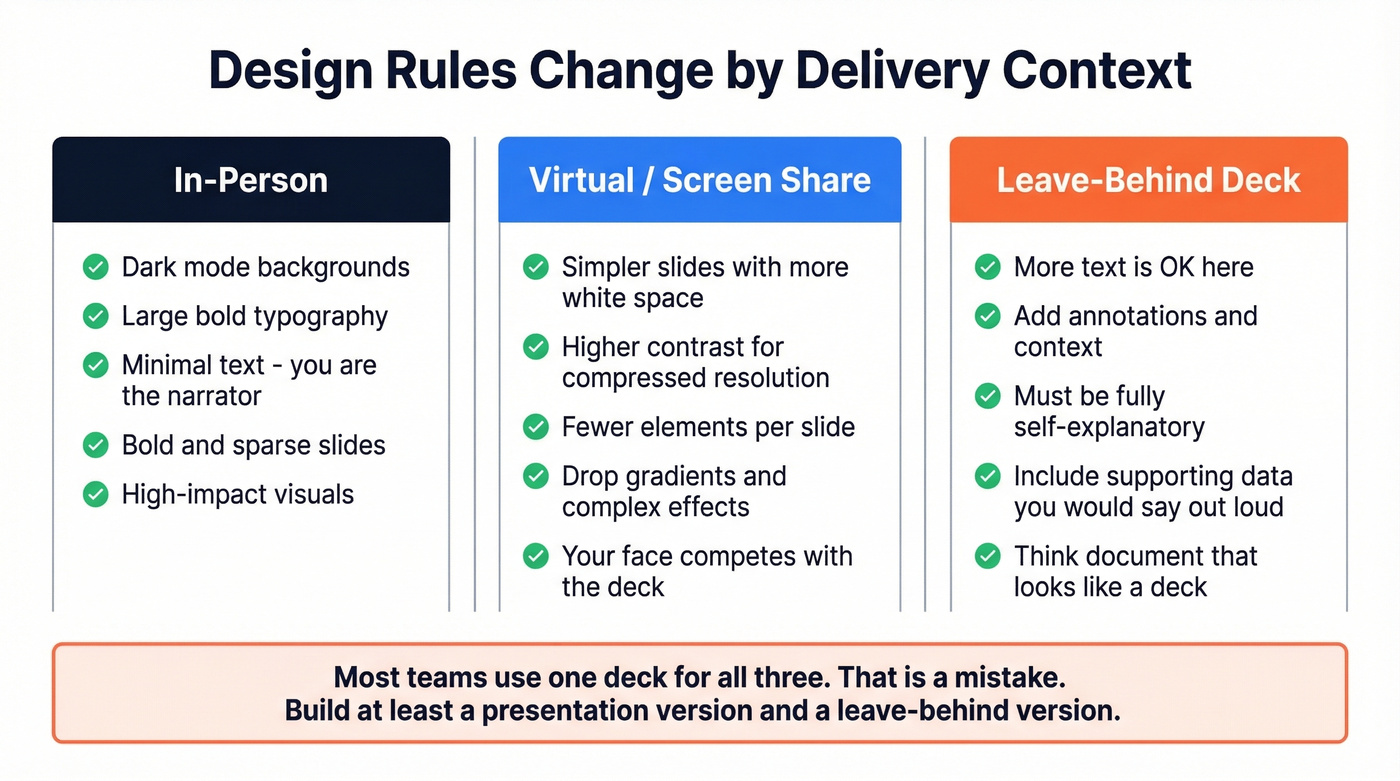
In-person presentations benefit from dark mode, large typography, and minimal text. You're the narrator - the slides are your backdrop. Keep them bold and sparse.
Virtual presentations need simpler slides with more white space. Screen sharing compresses resolution, and your face is competing with the deck in a tiny window. Drop the gradients, increase contrast, and use fewer elements per slide. (If you're presenting over Zoom all day, borrow a few tactics from our virtual presentations playbook.)
Leave-behind decks are the exception to every "less text" rule. These need to be self-explanatory because nobody's presenting them. Add context, annotations, and supporting data that you'd normally say out loud. Think of them as a document that happens to look like a deck.
Most teams use one deck for all three contexts. That's a mistake. At minimum, build a presentation version and a leave-behind version.
Personalize or Lose
Personalized decks get 68% more complete reads and are shared internally 2.3 times more often than generic ones. In a world where 6-10 stakeholders weigh in on a typical B2B buying decision, that internal sharing multiplier is everything. Your deck needs to sell when you're not in the room.
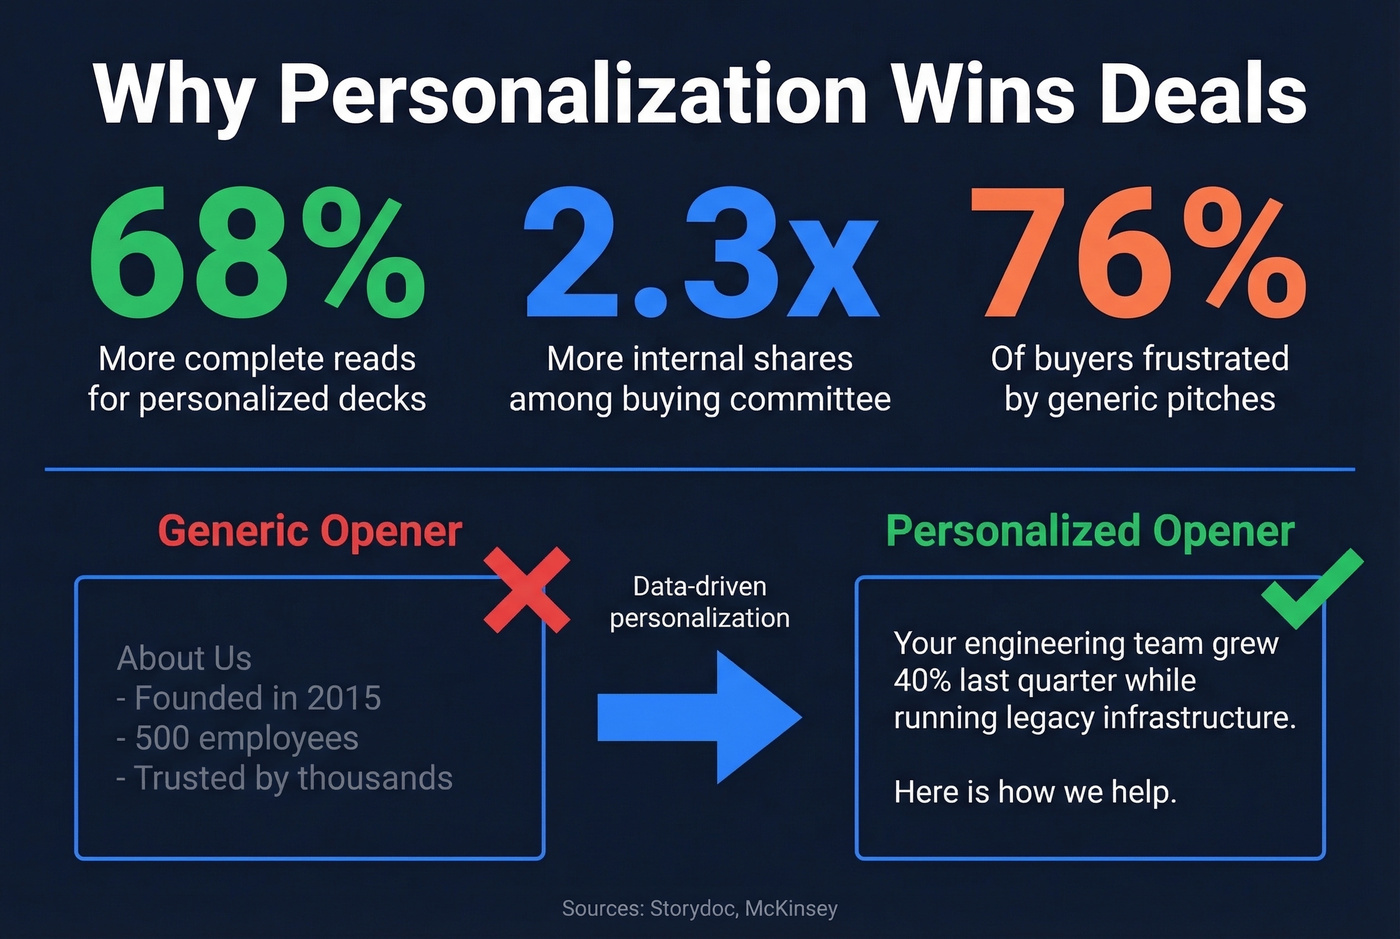
McKinsey found that 71% of buyers expect personalized interactions, and 76% get frustrated when they don't get them. Zuora built what's widely considered the best sales presentation ever - not because of design, but because they anchored the entire narrative around a market transition their buyers were living through. Udemy B2B uses dynamic variables to reference specific discovery call concerns in their opening slide. These aren't design tricks. They're data tricks.
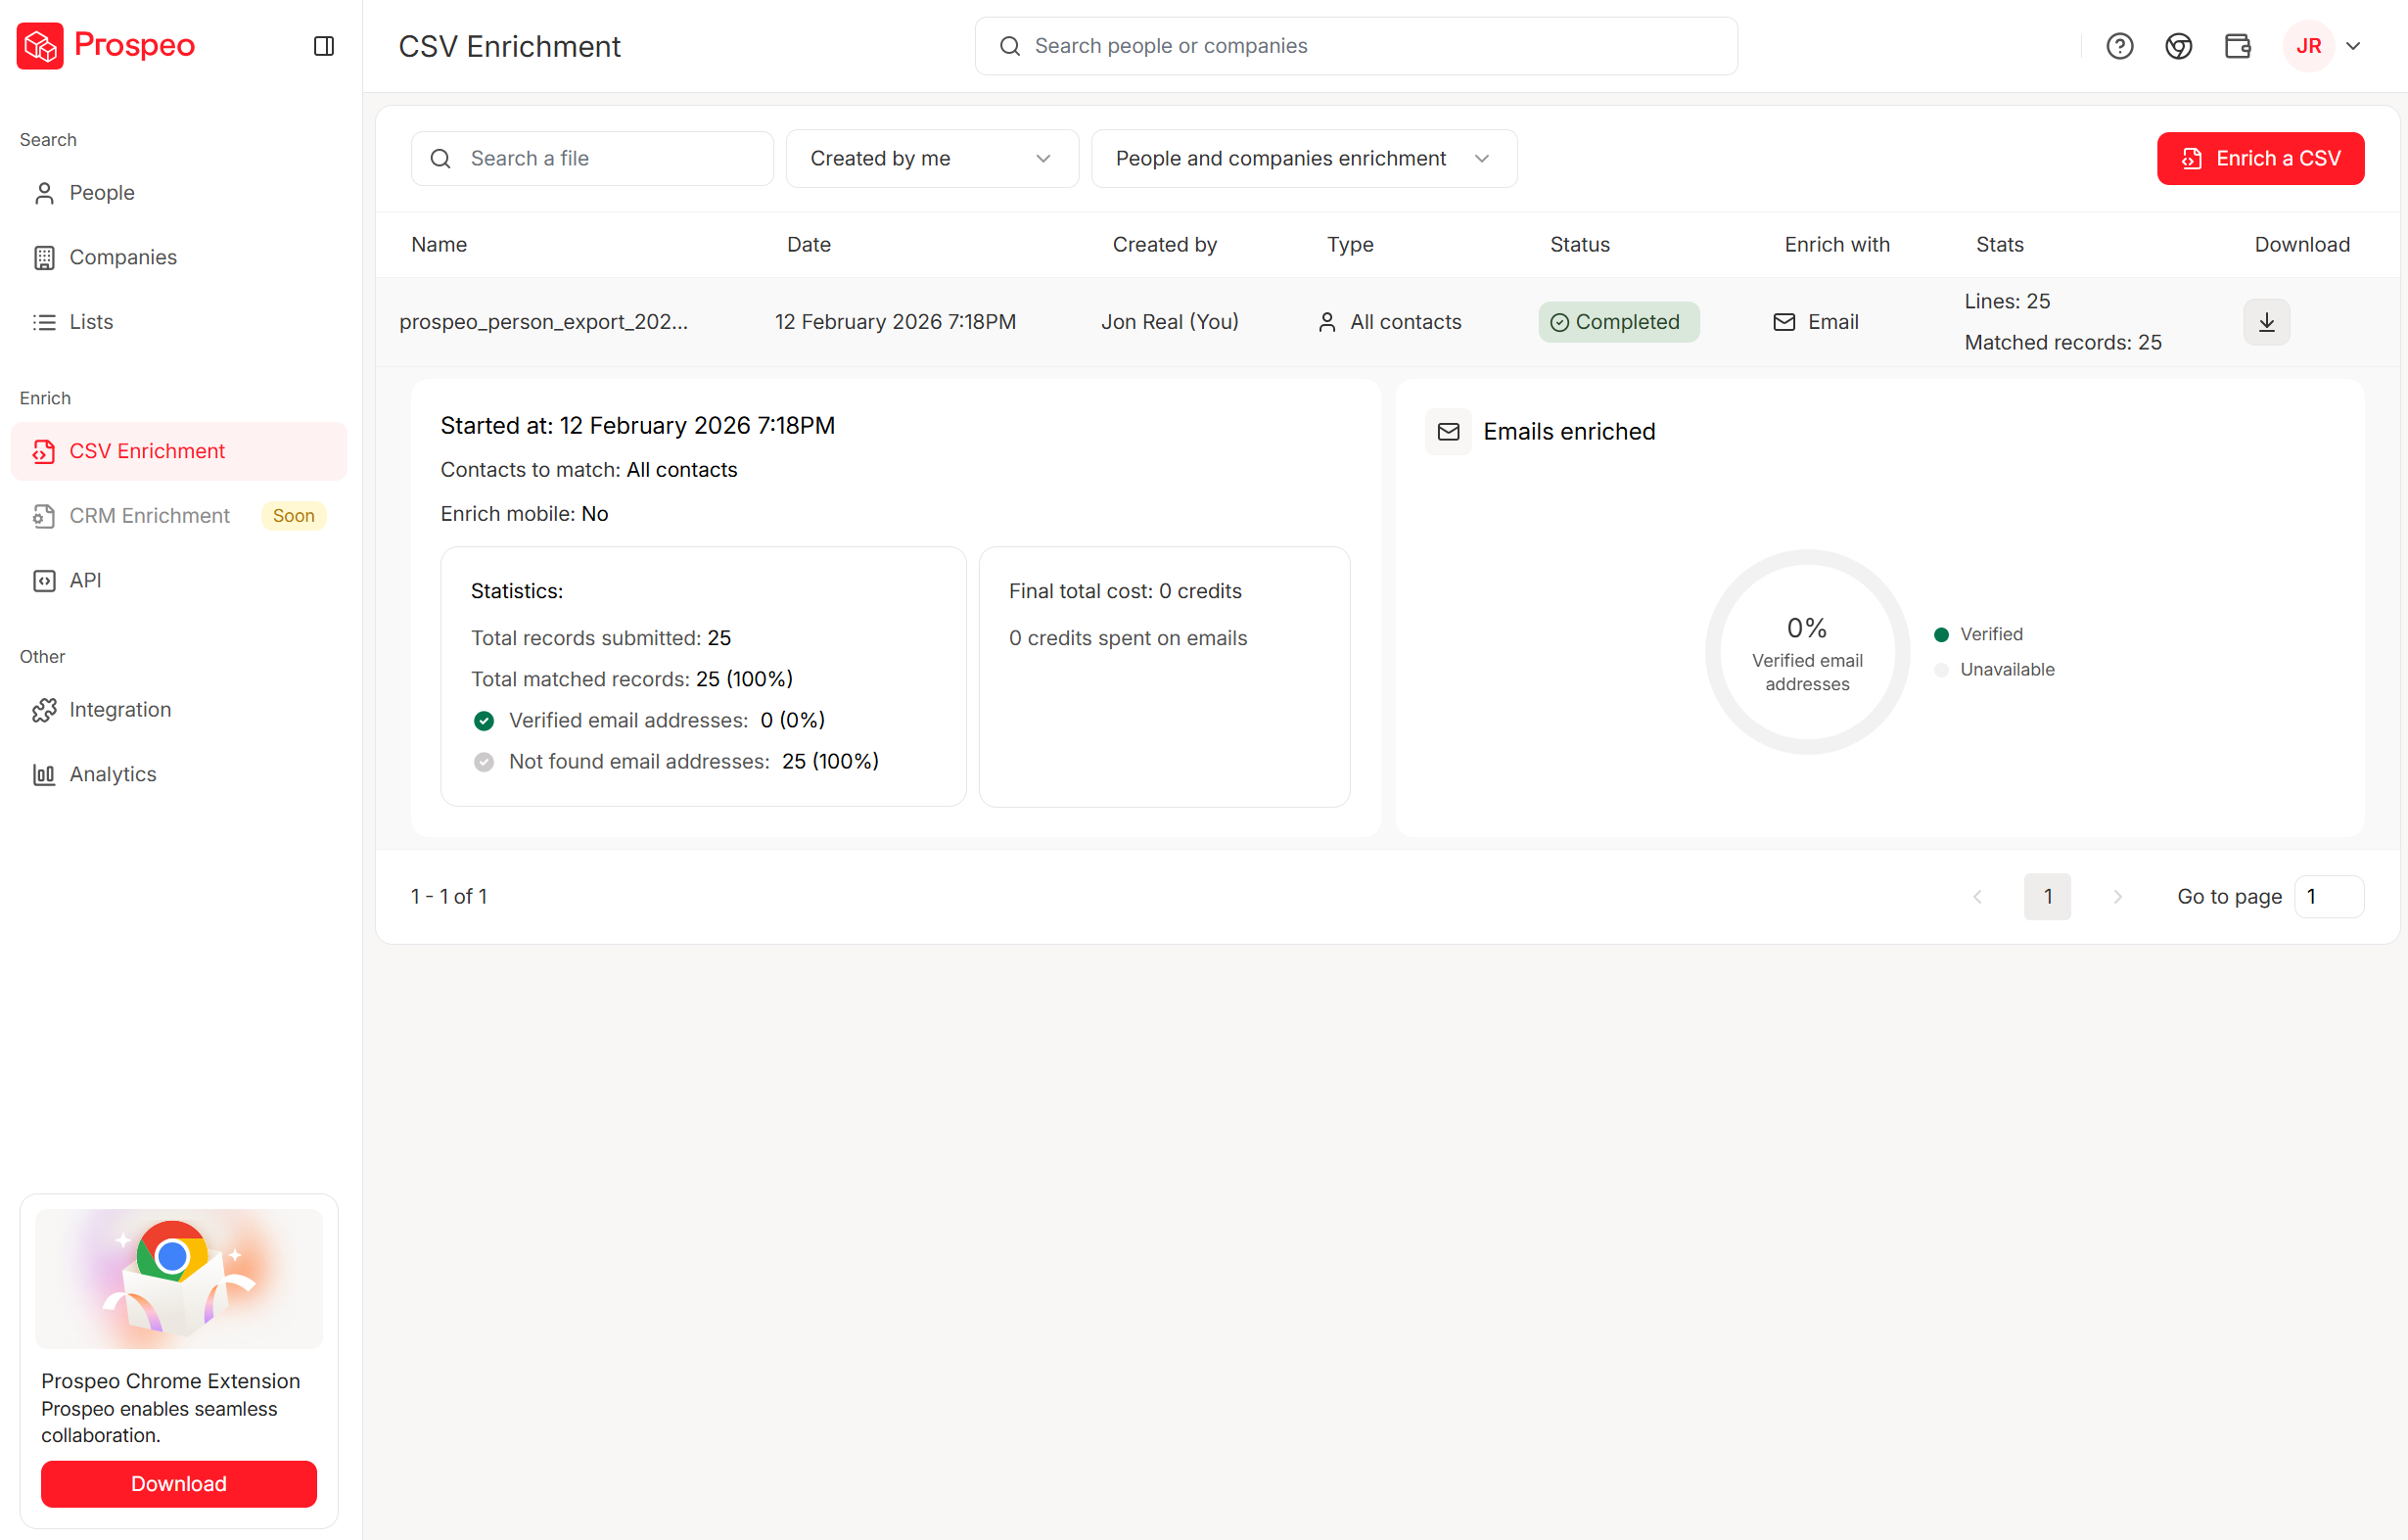
The problem is that personalization at scale requires prospect data you probably don't have in your CRM. Job titles are stale. Department sizes are guesses. Tech stack information is nonexistent. Prospeo fills that gap - it returns 50+ data points per contact, including job title, department headcount, tech stack, and buyer intent signals drawn from 15,000 Bombora topics, with an 83% enrichment match rate. (If you're evaluating vendors, start with our breakdown of data enrichment services.)
Turn a generic "About Us" opener into "We noticed your engineering team grew 40% last quarter while you're still running legacy infrastructure." That's the difference between a deck that gets forwarded to the CTO and one that gets filed.
Mistakes That Kill Your Deck
Terri Sjodin's study of 5,000+ business professionals found the #1 self-identified mistake: being overly informative. "Nobody complains that a talk was overly persuasive. They complain about the data dump." In our experience, the "About Us" slide is the first thing buyers skip - and the last thing reps are willing to cut.
The kill list:
- Data dumping. Excessive content without context. Fix: one idea per slide, three ideas per deck.
- Inconsistent branding. Mismatched colors, fonts, and themes signal sloppiness. Fix: two complementary colors, two fonts, white space everywhere.
- Forgetting the audience. Making it about your company achievements instead of their pain. Fix: the buyer's problem goes on slide 2, not your founding story.
- No USP. Burying or missing your value proposition entirely. Fix: your differentiation belongs on its own slide, stated in one sentence.
- Concluding without closing. A conclusion wraps up what you said. A close is a specific call to action. Fix: your last slide is a next step with a date, not a "Thank You" graphic.
- Sloppy design. Poor fonts, clashing colors, stretched images. Fix: use a design tool with auto-layout like Beautiful.ai or Canva, or hire a designer for your master template.
Skip the custom-designed deck entirely if your average deal size is under $15k. A clean template with strong personalization will outperform a designer deck with generic content every single time. Stop polishing slides and start researching buyers (and tighten your sales prospecting techniques so the right accounts see the deck in the first place).
Delivery Techniques That Win Deals
Even the best-designed deck falls flat with poor delivery. These techniques consistently turn a one-way pitch into a two-way conversation:
Pause after pricing. When you reveal the number, stop talking. Let the silence do the work. Rushing past pricing signals that you're uncomfortable with it, which makes the buyer uncomfortable too. (If you want a repeatable process, map this to the steps to close a sale.)
Watch the budget holder. In a multi-stakeholder meeting, identify who controls the money and read their reactions. If they're nodding during the ROI slide, linger there. If they're checking their phone during the demo, you've lost them - pivot to business impact.
Ask, don't present. After every 3-4 slides, pause and ask a question. "Does this match what you're seeing internally?" turns a pitch into a conversation, and conversations close deals. The consensus on r/sales is that the best reps spend more time listening during presentations than talking, which sounds counterintuitive until you try it. (For question prompts, use a tighter set of discovery questions.)
Best Tools for Sales Decks in 2026
AI tools have compressed deck creation from 4-6 hours to a 30-60 minute sprint. But the tool you pick depends on what's actually slowing you down.
Design Tools
| Tool | Starting Price | Best For | Key Strength |
|---|---|---|---|
| Beautiful.ai | $12/mo | Non-designers | Auto-layout engine |
| Canva | Free | Budget teams | Template library |
| Gamma | $8/mo | Speed | AI generation |
| Pitch | Free | Team collab | Real-time editing |
| PlusAI | $10/mo | Google Slides users | Native integration |
| monday CRM | $12/user/mo | CRM-connected teams | Pipeline integration |
Beautiful.ai is the best option if design is your bottleneck. The auto-layout engine means you can't make an ugly slide even if you try - it enforces alignment, spacing, and visual hierarchy automatically. At $12/mo, it's cheaper than one hour of a freelance designer's time. Skip it if you need deep customization or already have a design team.
Canva is the obvious free starting point. The template library is massive, Magic Write handles copy drafts, and the brand kit keeps everything consistent. It won't auto-layout like Beautiful.ai, but for teams that can't justify any spend on presentation tools, it's the clear winner.
Gamma is the speed play. It generates a complete deck from a single prompt in under a minute. We've tested it - the output always needs editing because AI-generated decks still feel generic, but as a starting point for a first draft, nothing's faster.
Pitch earns its spot for teams. Real-time collaboration, analytics on who viewed what, and branded templates make it the Google Docs of presentations. The free tier is genuinely usable.
PlusAI is worth a look if your team lives in Google Slides. $10/mo for AI-assisted slide creation without switching ecosystems.
monday CRM connects deck creation to your pipeline. At $12/user/mo, it's overkill for just presentations, but if you're already using monday for project management, the CRM integration creates a connected workflow from deal stage to deck. (If you're comparing stacks, see a few examples of a CRM before you commit.)
Real talk: design tools are table stakes now. Every tool on this list produces decent-looking slides. The actual edge is knowing your audience before you open any of them. Creativity in sales isn't about flashy animations or clever transitions - it's about finding the one insight that makes a buyer lean forward and say, "You actually understand our problem." (That’s the core of data-driven selling.)
A tight 10-slide deck loses its power when it lands in a dead inbox. Prospeo's 98% email accuracy and 7-day data refresh mean your visual sales presentation actually reaches decision-makers - not bounced addresses that torch your domain reputation.
Great decks deserve verified contacts. Start at $0.01 per email.
FAQ
How many slides should a visual sales presentation have?
Aim for 10-15 slides, with one idea per slide. Gong's research shows winning presentations average 9.1 minutes - roughly one minute per slide at the upper end. Go beyond 15 and you're almost certainly data dumping, which is the fastest way to lose attention and credibility.
What's the biggest mistake in sales presentations?
Being overly informative. Sjodin's multi-year study of 5,000+ professionals identified this as the #1 self-reported failure. Cut the "About Us" slide, trim the feature tour, and focus on three ideas that connect your solution to the buyer's specific problem.
How do I personalize a sales deck at scale?
Use a B2B data platform to pull prospect data - job title, department size, tech stack, intent signals - before building the deck. Personalized decks get 68% more complete reads and are shared internally 2.3x more often. The data does the heavy lifting; the design just presents it.
How does visual storytelling improve close rates?
Visual storytelling replaces bullet-point feature lists with narrative arcs that trigger emotional engagement and long-term recall. Audiences retain 65-70% of stories versus 5-10% of raw statistics. Teams using story-driven frameworks like Before-After-Bridge consistently outperform those relying on generic feature tours.