What Are the 5 Key Performance Indicators in Sales?
Most sales leaders are told to track 15, 21, even 27 KPIs. That's not a strategy - it's a data dump. When a practitioner on r/sales asked what KPIs people actually track, the post wasn't some sprawling dashboard breakdown. It was someone tracking five numbers in Google Sheets because they "haven't found any good sales analytics platforms."
You don't need more KPIs. You need the right five.
The Quick Answer
- Revenue Growth Rate - are you growing fast enough? (Lagging)
- Conversion Rate - how efficiently do leads become customers? (Lagging)
- Average Deal Size - how much is each win worth? (Lagging)
- Sales Cycle Length - how long does it take to close? (Leading)
- Pipeline Velocity - how fast does money move through your funnel? (Compound - combines the other four)
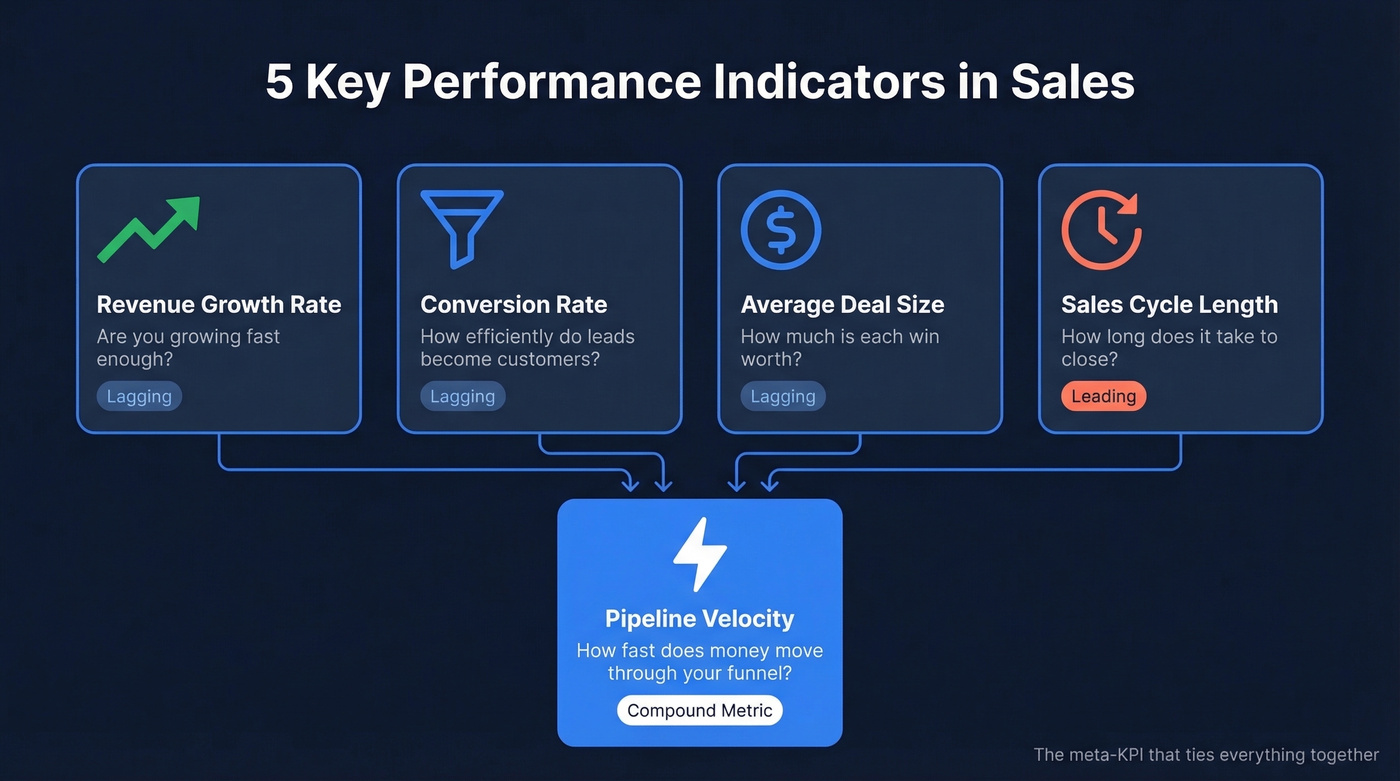
Everything else is either a sub-metric of these five or a vanity number that doesn't drive decisions. If you've ever seen a certification exam or job interview ask "which of the following are included in sales metrics," these five cover the categories that matter most: revenue, efficiency, and speed.
The 5 Sales KPIs That Matter
Revenue Growth Rate
Formula: (Current Period Revenue - Previous Period Revenue) / Previous Period Revenue x 100
This is the scoreboard. For SaaS companies in 2026, median annual revenue growth sits around 26% - down from 47% two years ago. Growth expectations have compressed across the board. For broader B2B companies, 15-25% annual growth is the healthy range.
What "good" looks like depends on your stage. Sub-$1M ARR? You should be doubling. Past $50M? 20-30% is strong. The mistake is benchmarking against companies three stages ahead of you.
Conversion Rate
Formula: Closed-Won Deals / Total Leads x 100
Most B2B sales funnels close at 15-25%. Win rate often runs 20-30% for B2B teams.
Here's the thing: speed is the hidden variable. Leads contacted within 5 minutes are 21x more likely to qualify than those contacted after 30 minutes, and 78% of customers buy from the company that responds first. Meanwhile, average B2B lead response time is 42 hours. If your conversion rate is low, check your response time before you blame the leads.
If you want tighter context on what “good” looks like, use these conversion benchmarks and compare by segment.
Average Deal Size
Formula: Total Revenue / Number of Closed Deals
This KPI tells you whether you're moving upmarket, downmarket, or standing still. Typical ACV ranges by segment:
- SMB: under $15K
- Mid-market: $15K-$100K
- Enterprise: $100K+
Average deal size also acts as a sanity check on your pipeline. If your ACV is $35K but your pipeline is full of $8K deals, you've got a targeting problem - not a closing problem. We've watched teams pour resources into "closing harder" when the real issue was they were filling the top of funnel with the wrong accounts entirely.
That’s also where lead scoring and a clear ideal customer profile stop bad-fit deals from entering the funnel.
Sales Cycle Length
Formula: Sum of Days to Close All Deals / Number of Deals
B2B sales cycles run 3-6 months on average, but that hides enormous variation. SMB deals close in days to weeks. Enterprise deals stretch 3-12 months. Track this by segment, not as a single blended number.
A shrinking cycle in your mid-market segment is a stronger signal than a blended average that mixes $5K and $200K deals.
If you’re trying to shorten cycle time, start with sales process optimization before you add more reporting.
Pipeline Velocity
This is the meta-KPI - the one that ties the other four together.
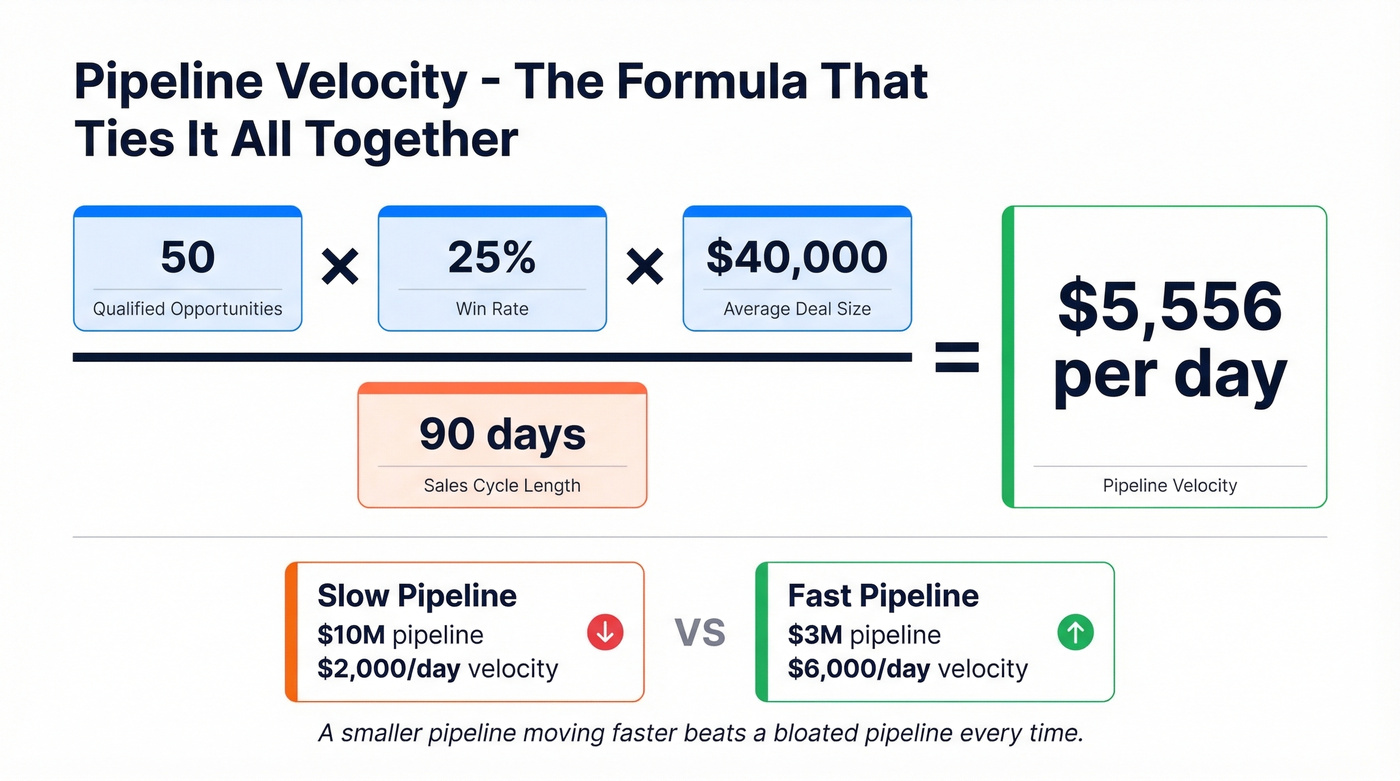
Formula: (Number of Qualified Opportunities x Win Rate x Average Deal Size) / Sales Cycle Length in Days
Let's break this down with real numbers. Say you have 50 qualified opportunities, a 25% win rate, a $40K average deal size, and a 90-day sales cycle. Your pipeline velocity is $5,556 per day. That single number tells you more about your sales engine's health than any individual metric.
We've seen teams obsess over pipeline volume while ignoring velocity. A $10M pipeline that moves at $2K/day is worse than a $3M pipeline moving at $6K/day. Velocity forces you to optimize the whole system, not just one input.
Pipeline velocity is the only KPI that deserves a permanent spot on every sales leader's desk. If you're running low-ACV transactional deals with cycles under 30 days, you can probably skip the fancy dashboards and just watch conversion rate and revenue growth. But the moment deals get complex, velocity is the number that keeps you honest.
If you want a broader view of what predicts revenue, pair velocity with pipeline health metrics.
Pipeline velocity depends on every input being clean. When a third of your emails bounce, your conversion rate, cycle length, and velocity are all fiction. Prospeo's 5-step verification delivers 98% email accuracy - so every KPI you track reflects reality, not dirty data.
Stop optimizing KPIs built on bad data. Start with contacts that actually connect.
Benchmarks by Business Model
| SaaS | Transactional | Enterprise | |
|---|---|---|---|
| KPI focus | MRR, ACV, churn | Conv. rate, AOV | Deal size, pipeline |
| ACV range | $8K-$300K | Under $5K | $100K+ |
| Cycle length | 1-3 months | Days-weeks | 3-12 months |
| CAC payback | 15-18 months | Under 6 months | 18-24 months |
| Win rate | 20-30% | 35-55% | 15-25% |
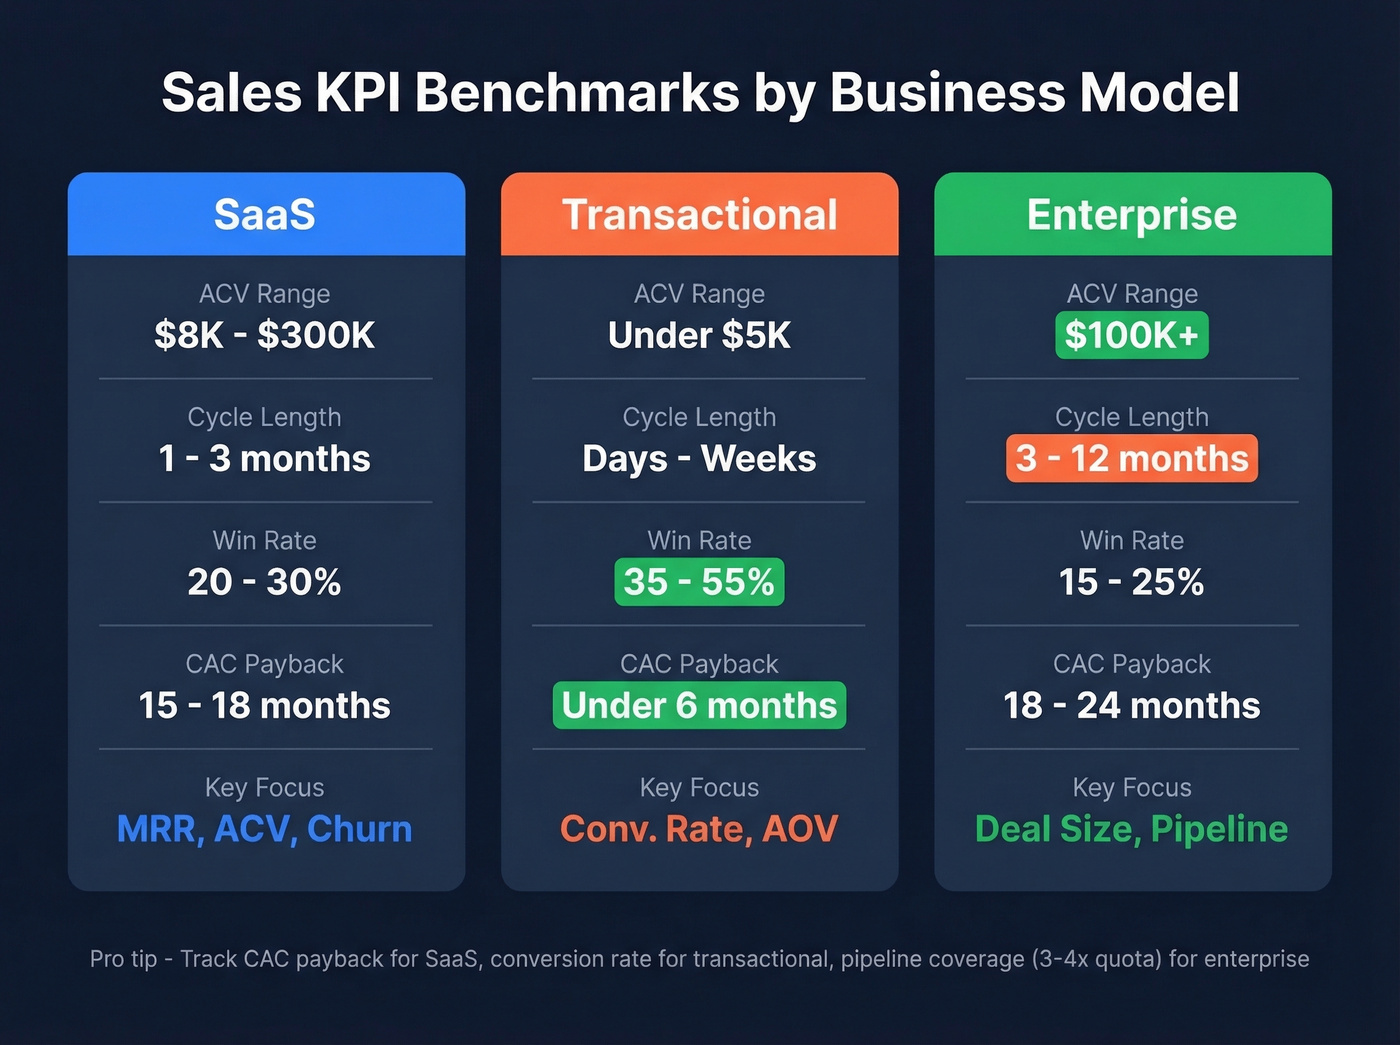
AOV = average order value. If you only track one model-specific metric beyond the core five, make it CAC payback for SaaS, conversion rate for transactional, and pipeline coverage (3-4x quota) for enterprise.
If you’re building a KPI stack for SaaS, it also helps to map these to churn analysis so growth isn’t hiding retention problems.
KPI Mistakes That Waste Time
Bernard Marr put it well: "most businesses are already data rich, but insight poor." In our experience, these five mistakes do the most damage.
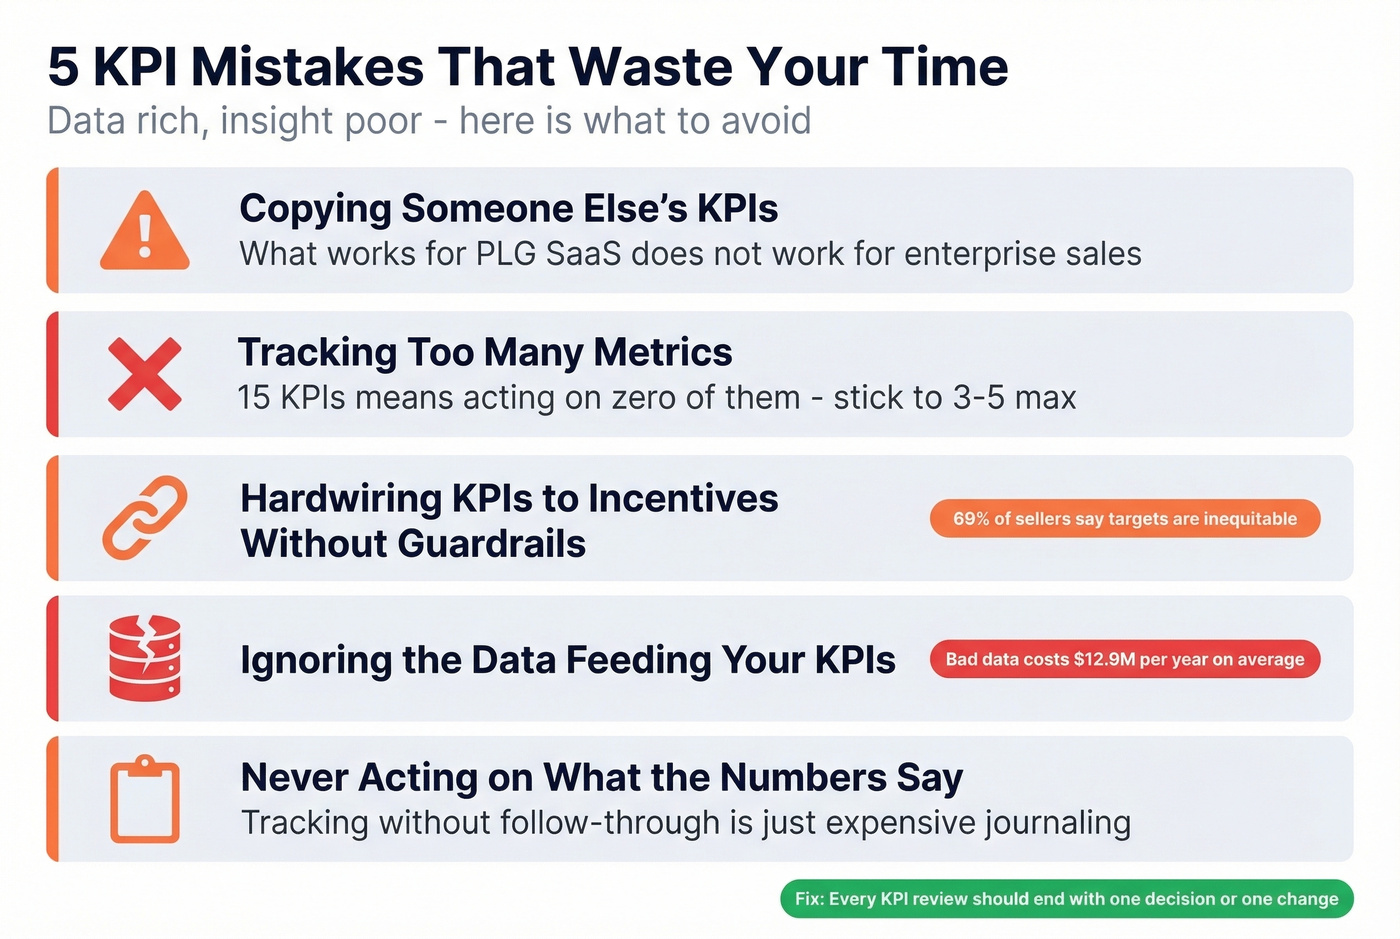
Copying someone else's KPIs. What works for a PLG SaaS company doesn't work for an enterprise sales org. Teams scan what others track and copy without context - and then wonder why the numbers don't help them make decisions.
Tracking too many metrics. The teams that track 15 KPIs act on zero of them. Three metrics per dashboard view, max. If someone asked you to name three sales metrics that actually move the needle, could you do it without checking your dashboard? If not, you're tracking too many.
Hardwiring KPIs to incentives without guardrails. When you tie compensation directly to a single metric, people game it. Research from Gartner shows 69% of sellers already say their targets are inequitable. Poorly designed KPI incentives make it worse.
Ignoring the data feeding your KPIs. Gartner estimates poor data quality costs organizations $12.9M per year on average. If a third of your emails bounce, your conversion rate is fiction. We ran into this firsthand at a client whose "pipeline" was 40% dead contacts - fixing upstream data quality with Prospeo's 5-step verification brought their bounce rate under 4% and made every downstream KPI trustworthy again.
If you’re seeing deliverability issues, start by tracking and fixing your email bounce rate and following an email deliverability guide before you trust any funnel math.
Never acting on what the numbers say. Look, tracking without follow-through is just expensive journaling. Every KPI review should end with one decision or one change. No exceptions.
How to Track Sales KPIs
The tools matter less than the discipline. Salesforce, HubSpot, or Pipedrive all handle KPI tracking fine. The problem is adoption: 40% of users rate their dashboards 3 out of 5 or lower, and 72% regularly export data to Excel anyway. Ask any AE what they actually use to track their numbers and the answer is almost always a spreadsheet.
If you’re evaluating tooling, it helps to start with a few examples of a CRM and then narrow down to sales forecasting tools if forecasting accuracy is the real gap.
Build role-specific dashboards. Your SDRs need activity metrics and conversion rates. AEs need pipeline velocity and deal size trends. Your VP needs revenue growth and forecast accuracy. One dashboard for everyone means it's useful for nobody.
55% of companies don't even know their CAC. If that's you, start there. You don't need a perfect dashboard. You need three numbers you actually look at every week - and data clean enough to trust what they're telling you.
FAQ
What are the 5 key performance indicators in sales?
The five that matter most are revenue growth rate, conversion rate, average deal size, sales cycle length, and pipeline velocity. Pipeline velocity is the compound metric that ties the other four together - improving any single input improves the whole system.
What's the most important sales KPI?
Pipeline velocity. It combines deal size, win rate, cycle length, and pipeline volume into one diagnostic number. Improving any one input improves velocity, making it the single best health check for your entire sales engine.
How many KPIs should a sales team track?
Three to five, maximum. More than that and nobody acts on any of them. Over half of companies don't even know their customer acquisition cost - start with the basics before adding complexity.
How does data quality affect sales performance indicators?
Bad data inflates your pipeline and deflates your conversion rate. If your CRM is full of invalid emails, every KPI downstream is compromised. Prospeo's 5-step verification catches bad records before they enter your system - with a 98% accuracy rate and a 7-day refresh cycle, the numbers you review weekly are numbers you can actually act on.
You just read that 78% of buyers choose the first company to respond - but you can't respond fast if you're chasing dead leads. Prospeo refreshes 300M+ profiles every 7 days, so your team reaches real decision-makers while competitors are still bouncing at 35%.
Crush your conversion rate with data that's never more than a week old.