Win Rate: What It Is, How to Calculate It, and Why Yours Is Probably Wrong
Your VP of Sales says the team's win rate is 35%. Your CRO says it's 18%. They're both looking at the same CRM. The difference? One includes stale pipeline from six months ago, the other doesn't. One counts no-decisions as losses, the other excludes them entirely. This disconnect is so common it's almost a rite of passage for growing sales orgs, and it's costing you forecasting accuracy, rep confidence, and board credibility.
Meanwhile, a practitioner on r/sales reports a 4% conversion despite disqualifying 70% of inbound leads before they even become opportunities. If aggressive qualification can't save you, what can?
The Short Version
The average B2B win rate is 21%. If yours is below 15%, your denominator is probably inflated with stale pipeline. Three fastest fixes: compress deal cycles under 50 days, purge unreachable contacts from your CRM, and run structured win-loss interviews quarterly. Below you'll find the formulas, benchmarks, and methodology to diagnose exactly where you're leaking deals.
What Does Win Rate Mean in Sales?
In B2B sales, win rate measures how often you close deals you actually compete for. The standard formula: won opportunities divided by (won + lost opportunities). Open deals don't count. Stalled deals shouldn't either - but we'll get to that.
The term shows up in other domains too. In trading, it's the percentage of profitable trades, and it only matters when paired with the win-loss ratio (average win size divided by average loss size). A retail forex trader might win 50-55% of trades and still lose money overall if their average loss exceeds their average win - that's the expectancy concept. In programmatic advertising, it means impressions won divided by impressions bid, a measure of auction competitiveness.
For the rest of this guide, we're talking about sales. If you're here for trading or ad tech, the formula section still applies conceptually, but the benchmarks won't.
Win Rate vs. Close Rate vs. Win-Loss Ratio
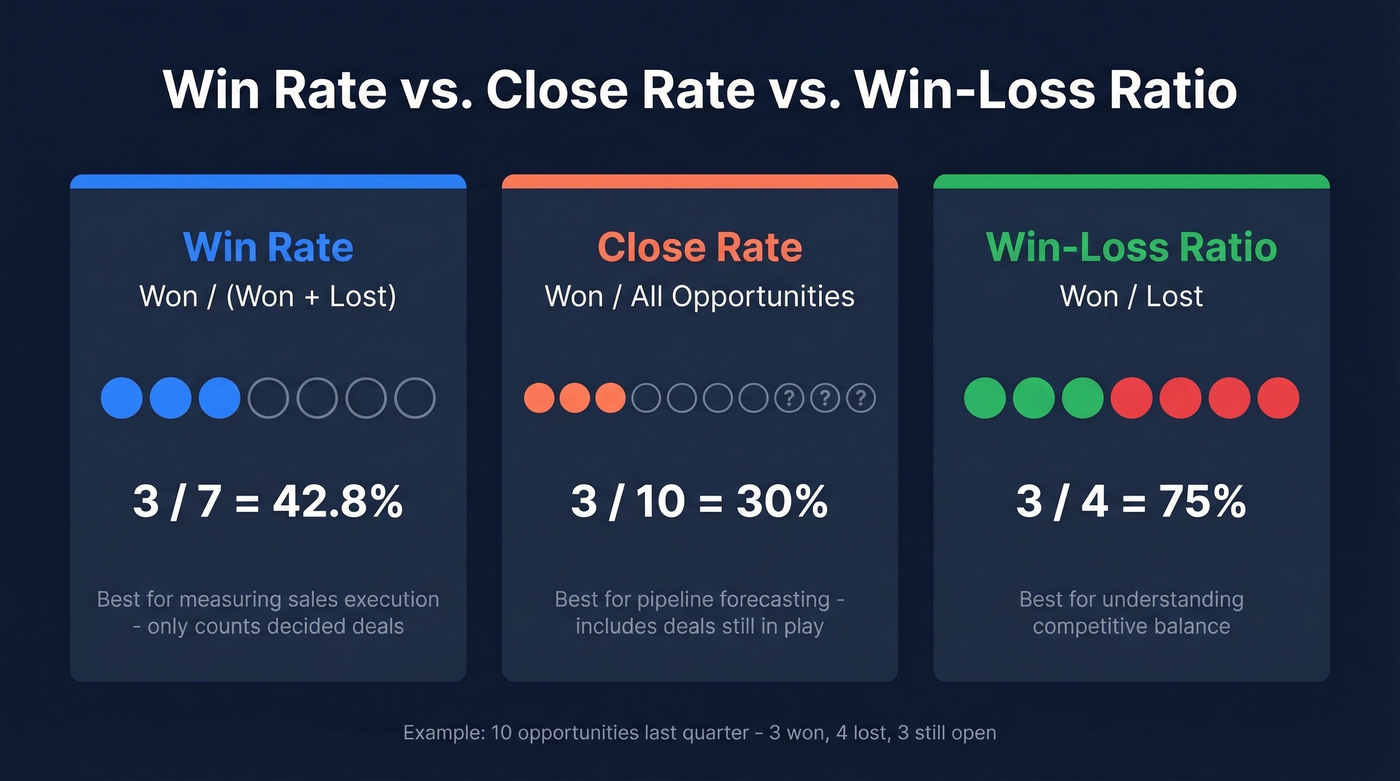
These three metrics pull from the same dataset but answer different questions. Say your team had 10 opportunities last quarter: 3 won, 4 lost, 3 still open.
| Metric | Formula | Result | What It Answers |
|---|---|---|---|
| Win rate | Won / (Won + Lost) | 3/7 = 42.8% | Win frequency among decided deals |
| Close rate | Won / All Opps | 3/10 = 30% | Total pipeline conversion |
| Win-loss ratio | Won / Lost | 3/4 = 75% | Win-to-loss balance |
In practice, "close rate" and "win rate" get used interchangeably - but they shouldn't be. Close rate is better for pipeline forecasting because it accounts for deals that might never resolve. Win rate is better for measuring sales execution because it only looks at outcomes.
You can also segment by competitive win rate - your wins divided by total opportunities where a specific competitor was involved. That's the metric that actually tells you whether you're losing to Competitor X or just losing in general.
Here's the thing: if your CRM has hundreds of "open" opportunities from six months ago, your close rate will look terrible while your decided-deal percentage stays stable. That gap is a signal. It means you've got a pipeline hygiene problem, not a selling problem.
Stale contacts are the silent win rate killer. When 60% of pipeline ends in no-decision, the real question is whether your reps ever reached the right person. Prospeo refreshes 300M+ profiles every 7 days - so your pipeline is built on contacts who actually pick up.
Stop losing deals to bad data. Start reaching real decision-makers.
How to Calculate Win Rate
By Count vs. By Amount
Most teams default to counting deals. That's fine until you realize it treats a $5k deal the same as a $500k deal. Clozd's breakdown illustrates the divergence well.
Take a quarter with 8 closed deals: 2 wins totaling $80k, 6 losses totaling $60k. By count, your result is 25% (2/8). By amount, it's 57.1% ($80k/$140k). Same quarter, wildly different story. The count-based number says your reps lose most deals; the amount-based number says they're winning the ones that matter.
Track both. Count-based tells you about process consistency. Amount-based tells you about deal selection and strategic selling. If you're running this in a spreadsheet, a simple formula gets you there: =COUNTIF(B:B,"Won")/(COUNTIF(B:B,"Won")+COUNTIF(B:B,"Lost")).
The No-Decision Problem
Up to 60% of pipeline ends in no decision - prospects who ghost, reprioritize, or just never pull the trigger. Whether you include these as losses fundamentally changes your number.
We recommend excluding no-decisions from your formula and tracking them as a separate metric. Lumping them in with losses punishes reps for market conditions they can't control. But you absolutely need to know your no-decision rate. If it's above 40%, you've got a lead scoring or urgency problem upstream.
Common Calculation Mistakes
Stale pipeline is the biggest offender. A thread on r/PowerBI captures this perfectly: teams pull in quotes from up to 120 days in the past and treat overdue quotes as live pipeline. When those finally get marked as lost, they distort the current period's numbers.
A useful heuristic: scrutinize any opportunity that's been in your pipeline 3x longer than your average sales cycle and has 30+ days of inactivity. Those deals are dead. They just haven't been buried yet. Mark them as closed-lost or move them to nurture.
The second mistake is date cohorting. If you measure by close date, a deal created in January that closes in June gets counted in Q2 - even though your Q2 pipeline had nothing to do with generating it. Cohort by opportunity creation date instead. It gives you a consistent, time-based view of how each conversion cohort actually performs.
Third: CRM hygiene failures. Duplicate opportunities, unconverted leads sitting in the wrong stage, test records nobody cleaned up. Every phantom record inflates your denominator and drags your percentage down. If you want a clean baseline, start with contact management software fundamentals before you optimize anything else.
What Is a Good Win Rate?
B2B Benchmarks by Industry
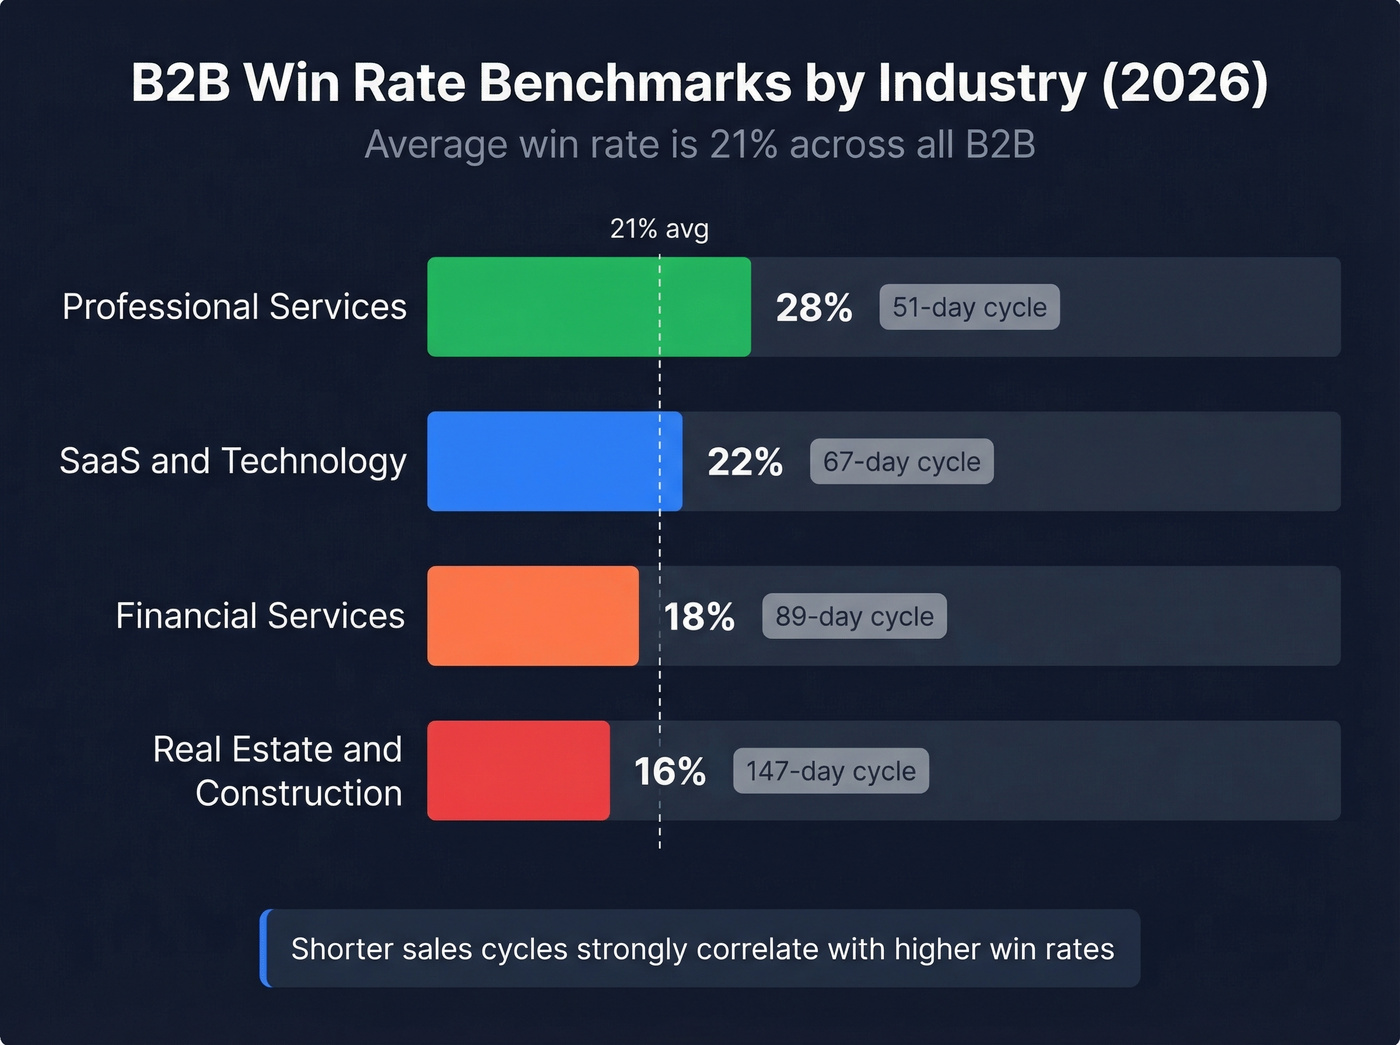
HubSpot's Sales Trends Report puts the average B2B win rate at 21%. That number hides massive variation.
| Industry | Win Rate | Avg Sales Cycle |
|---|---|---|
| SaaS & Technology | 22% | 67 days |
| Professional Services | 28% | 51 days |
| Financial Services | 18% | 89 days |
| Real Estate & Construction | 16% | 147 days |
Professional services leads at 28%, largely because shorter cycles and clearer buyer intent reduce no-decision rates. Real estate and construction sits at 16% - not because those teams sell worse, but because 147-day cycles give buyers more time to stall, reprioritize, or disappear entirely.
Benchmarks by Deal Size
Enterprise deals are getting harder to close. Winning by Design's analysis shows enterprise conversion rates (ACV >$100k) dropped from roughly 26% to 17% in late 2022 and early 2023.
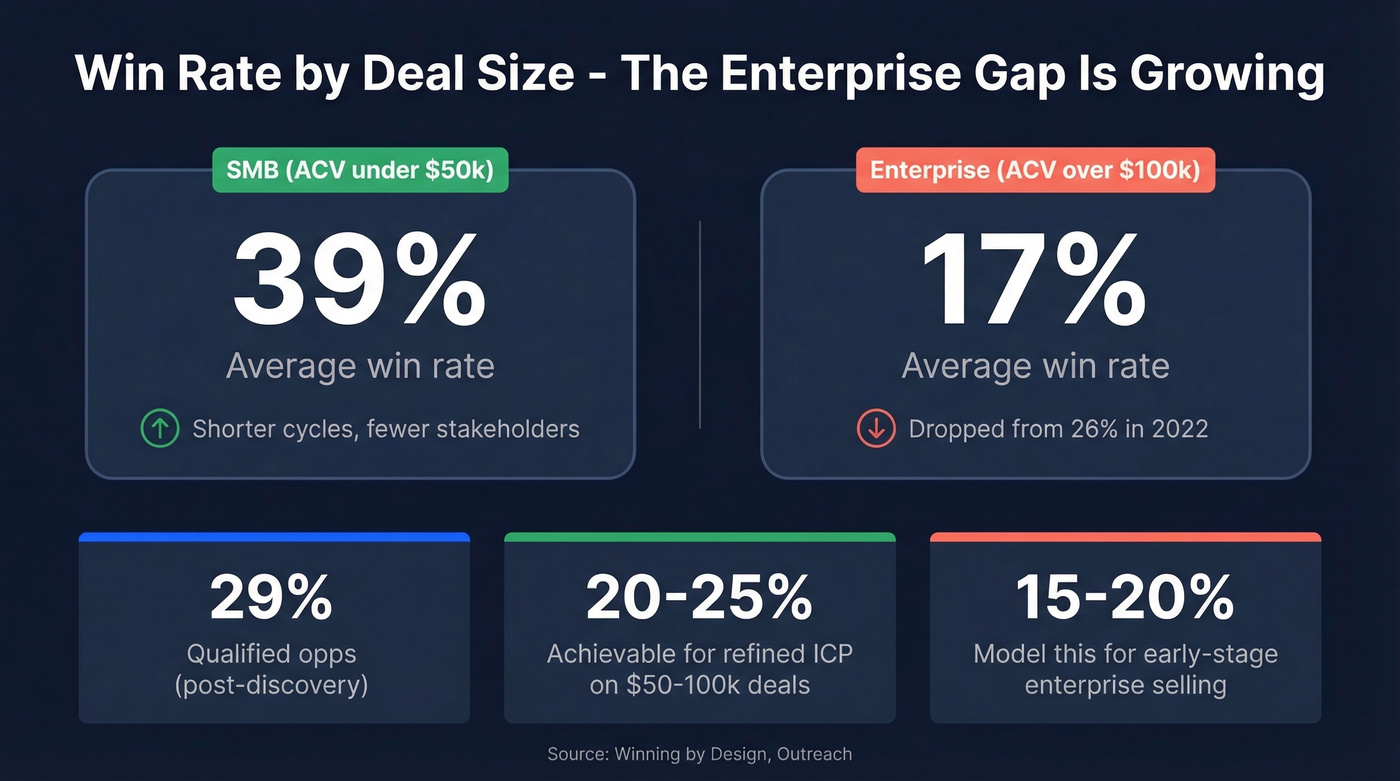
SMB opportunities still close at about 39% versus 31% for enterprise. For early-stage companies selling into enterprise, model 15-20% on $100k+ deals. After you've refined your ICP and sales process, 20-25% is achievable for $50-100k ACV. Qualified opportunities - deals that have passed a real discovery stage - average around 29% across the board.
Trends in 2026
The distribution is shifting downward. Outreach's data analysis - the most recent comprehensive dataset available - shows the largest cohort of organizations now reports 21-25%, down from 31-40% the prior year. Only 13% of organizations achieve 40% or above.
Sales cycles have lengthened 32% since 2021. More stakeholders in buying committees, tighter budgets, and longer procurement reviews are all compressing outcomes industry-wide. The Ebsta x Pavilion dataset - spanning 4.2M opportunities and $54B in pipeline - confirms this trend has held for three consecutive years with no reversal in sight.
Let's be honest about something: if your ACV is under $25k and you're closing above 30%, you're probably not prospecting aggressively enough. High conversion on small deals often means the team is cherry-picking easy wins instead of expanding the addressable market. A 22% close frequency on a larger, well-qualified pipeline will generate more revenue than a 40% rate on a pipeline half the size.
How to Improve Your Win Rate
Compress Deal Cycles
This is the single strongest lever. Deals that close within 50 days convert at a 47% rate. Beyond 50 days, that drops to 20% or lower. Speed doesn't just correlate with winning - it causes it. Fewer stakeholders get involved, priorities don't shift, and competitors can't wedge in.
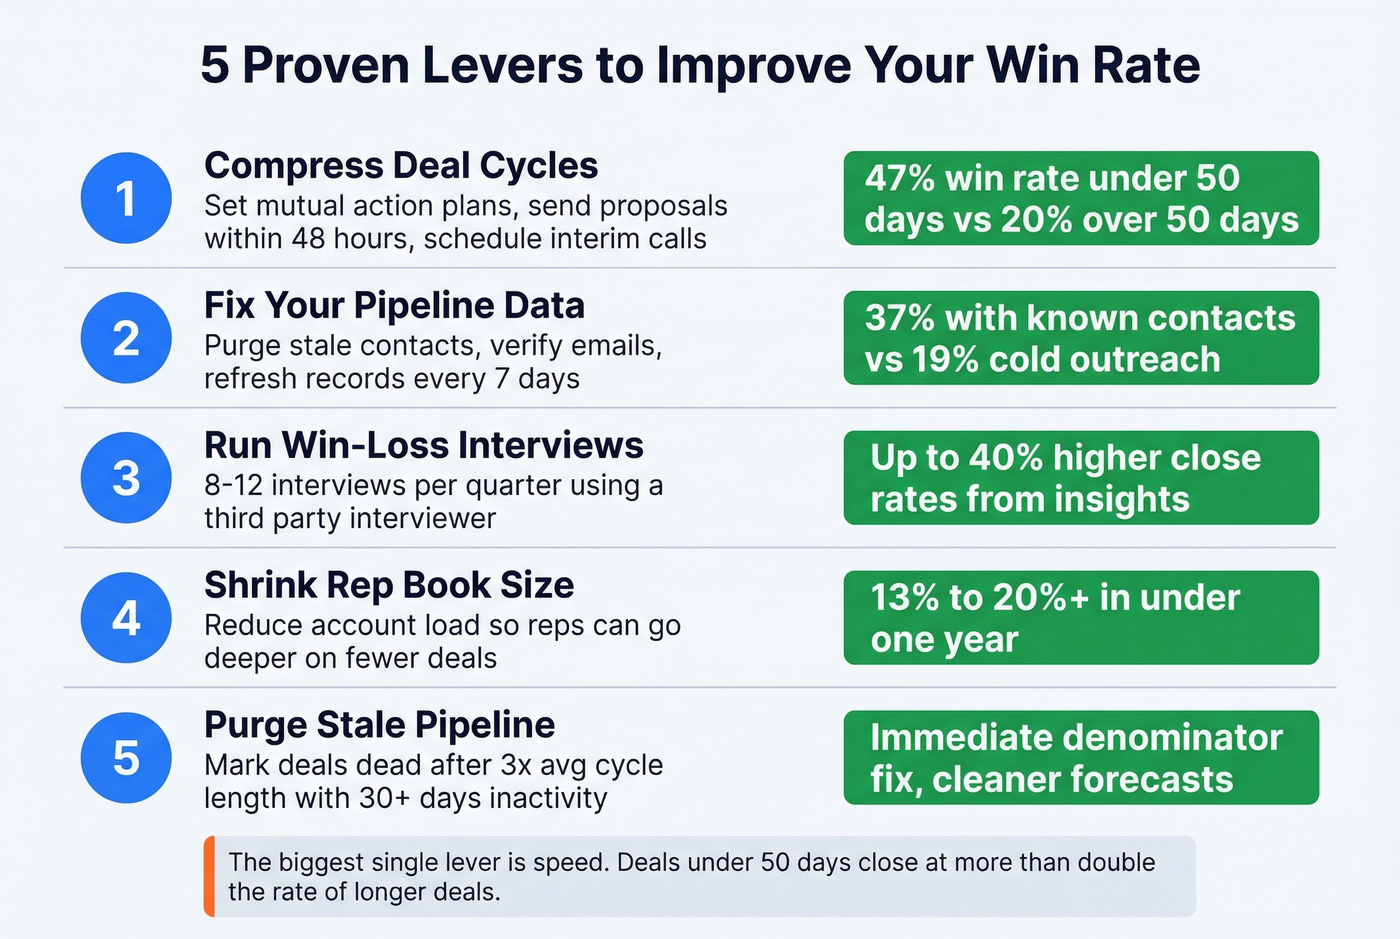
Practical moves: set mutual action plans with clear deadlines in the first meeting. Send proposals within 48 hours of discovery. Schedule a 15-minute interim call between every major milestone to prevent deals from going dark. If a deal stalls past 60 days with no next step, move it to nurture - don't let it rot in your pipeline and drag your numbers down.
Fix Your Pipeline Data
Bad contact data - wrong emails, disconnected phones, outdated titles - creates dead-weight pipeline. You think you have 200 active opportunities, but 80 of them are built on contacts you can't actually reach. That inflates your denominator and tanks your numbers before a single conversation happens. Known-contact deals win at 37% versus 19% for cold outreach.
We've seen this pattern repeatedly: teams connect Prospeo to Salesforce or HubSpot, the 7-day data refresh cycle cleans out stale records, and their win rate jumps 5-8 points without changing a single thing about their selling motion. The denominator shrinks because phantom opportunities disappear, and the numerator holds steady because reps are finally reaching real people with 98% verified emails. If you're evaluating vendors, start with a shortlist of data enrichment services.
Run Win-Loss Interviews
Eight to twelve targeted interviews per quarter can transform your competitive positioning. Focus on deals closed within 90 days, strategic segments, and head-to-head competitive situations. Include a mix of wins, losses, and no-decisions.
Use a third party. Buyers won't tell your AE why they really chose the competitor - they'll tell an independent interviewer. Companies that get win-loss analysis right see up to 40% higher close rates, not because the interviews magically close deals, but because the insights reshape messaging, pricing, and qualification criteria across the entire org.
Shrink Rep Book Size
One company increased from 13% to 20%+ in under a year by reducing account loads per rep. The math is intuitive: a rep managing 500 accounts can't meaningfully work any of them. Best teams keep active book sizes between 100-300 accounts and refresh every 30-60 days.
Most sales leaders resist this because it feels like you're shrinking your addressable market. You're not. You're concentrating effort on accounts where you can actually win. This is also where account-based selling tends to outperform spray-and-pray outbound.
Qualify Harder, Not Wider
Remember the Reddit poster with a 4% conversion despite disqualifying 70% of leads? Qualification alone isn't enough - it has to be paired with data quality and speed. Disqualifying bad leads is step one. Making sure the remaining leads have accurate contact info, relevant pain, and budget authority is where the real improvement happens. Skip this step and you'll disqualify your way to a tiny pipeline that still doesn't convert.
Segment for Actionable Insights
A single company-wide number is a vanity metric. Break it down by rep, product line, and customer segment. You'll almost always find that one product or one segment is dragging the average down while another outperforms. The rep-level view is even more revealing - it separates coaching problems from market problems. If one rep wins at 35% and another at 12% in the same segment, that's not a market issue. To operationalize this, align your reporting with sales operations metrics that tie back to revenue.
Pipeline Velocity and Win Rate
Win rate is one of four levers in the pipeline velocity formula:
(# Opportunities x Avg Deal Value x Win Rate) / Sales Cycle Length = Pipeline Velocity
You can improve velocity by increasing any of the top three or decreasing cycle length. In our experience, win rate is the hardest to move directly - it's an output of dozens of upstream decisions. The fastest indirect levers? Compress deal cycles and fix your pipeline data so every opportunity in the formula represents a real, reachable prospect. Those two moves improve both conversion and cycle length simultaneously. If you need a broader diagnostic, use a pipeline health scorecard.
You just read that CRM hygiene failures inflate your denominator and drag win rates down. Prospeo's enrichment returns 50+ data points per contact at a 92% match rate - automatically purging outdated records and filling gaps across your entire pipeline.
Clean pipeline, higher win rate. Enrich your CRM for $0.01 per lead.
FAQ
What is a win rate?
It's the percentage of decided opportunities your team closes successfully - calculated as won deals divided by (won + lost deals). It excludes open opportunities and ideally no-decisions, giving you a clean measure of sales execution rather than pipeline volume.
What's a good win rate for SaaS?
Around 22% is the 2026 industry benchmark for SaaS companies, with an average 67-day sales cycle. Enterprise deals (ACV >$100k) trend lower at 15-20%. Consistently above 25% signals strong qualification and pipeline quality relative to the market.
Should I include no-decisions in my calculation?
No. Track no-decisions separately. Including them as losses inflates your denominator and makes results look artificially low. Use won / (won + lost) as your standard formula, and monitor your no-decision rate as its own pipeline health metric.
What's the difference between win rate and close rate?
Win rate equals won / (won + lost), excluding open deals. Close rate includes all opportunities in the denominator, producing a lower number. Use win rate for measuring sales execution quality; close rate for pipeline forecasting and capacity planning.
Can better prospect data improve win rate?
Yes. Known-contact deals close at nearly 2x the rate of cold outreach (37% vs. 19%). When your reps only pursue reachable prospects with verified contact info, the denominator shrinks and effort concentrates on winnable deals - that's the fastest way to move the number without overhauling your entire sales process.