ACV vs ARR: The Practitioner's Guide to Getting Both Right
Why Your CFO and CRO Report Different Numbers
Your CFO pulls up the board deck. ARR says $4.2M. Your CRO opens Salesforce, runs a report, and gets $4.7M. The board meeting starts in two hours, and nobody can explain the gap.
This happens constantly. The root cause is almost never math - it's policy. The ACV vs ARR confusion isn't about formulas; teams disagree on what counts, when it counts, and whether that $80K implementation fee belongs in the number. The formulas are simple. The organizational discipline to apply them consistently? That's the hard part.
ACV is per-contract, annualized. ARR is company-wide, recurring only. ACV is for evaluating sales performance. ARR is for board decks and investors. The real problem is that every company defines these metrics slightly differently and nobody writes it down. Below: the formulas, 2026 benchmarks, and the governance framework that makes the disagreements stop.
The Difference at a Glance
The cleanest way to see the difference is side by side. Stripe's framing puts it well: ACV is flexible and sales-facing; ARR is more standardized and investor-facing.
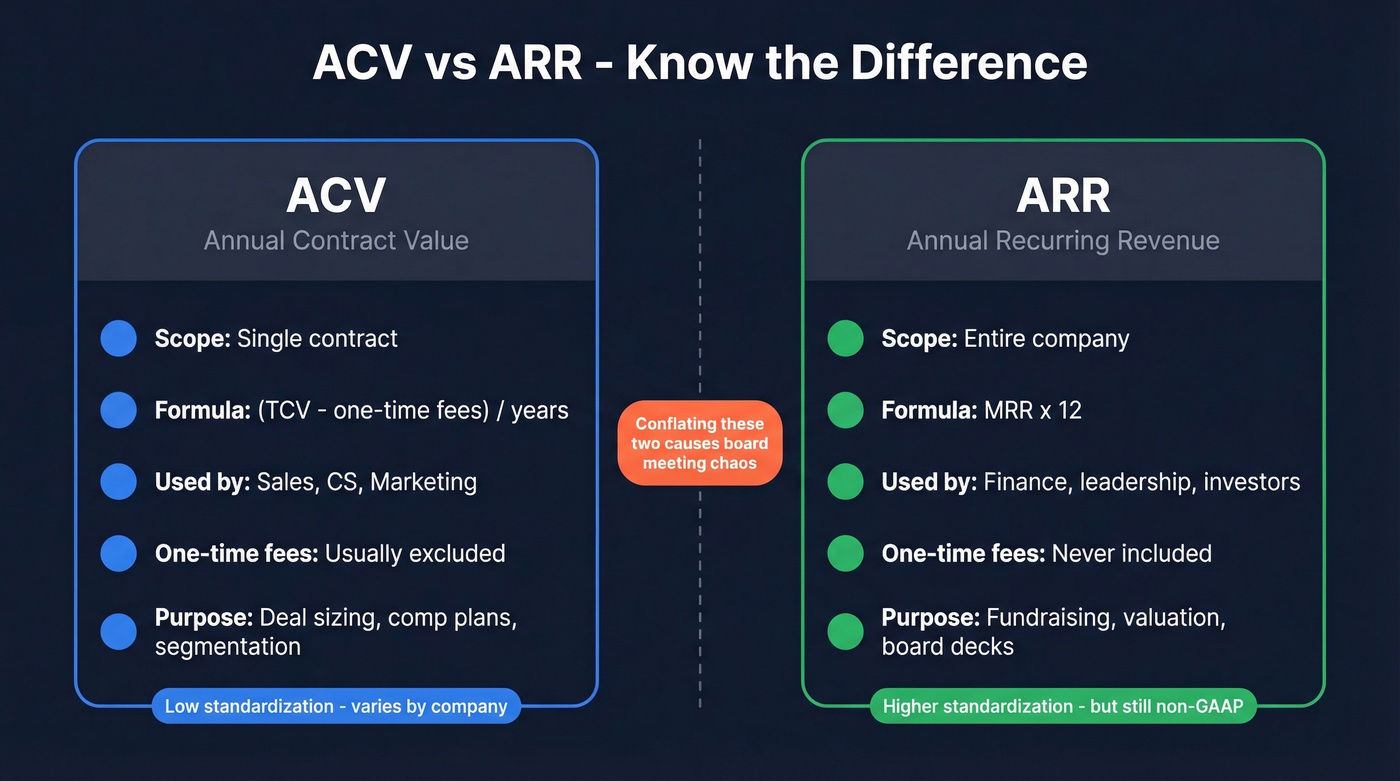
| Dimension | ACV | ARR |
|---|---|---|
| Scope | Single contract | Entire company |
| Formula | (TCV - one-time fees) / years | MRR x 12 |
| Who uses it | Sales, CS, marketing | Finance, leadership, investors |
| Includes one-time fees? | Usually no | Never |
| When it matters | Deal sizing, comp, segmentation | Fundraising, valuation, board reporting |
| Standardization | Low - varies by company | Higher - but still non-GAAP |
The distinction matters because conflating the two is exactly how you end up with that board meeting gap.
ACV Explained
Formula and Worked Example
ACV answers a simple question: how much is this contract worth per year, stripped of one-time charges?
ACV = (Total Contract Value - One-Time Fees) / Contract Term in Years
Walk through Orb's example. A customer signs a 3-year deal worth $60,000 in recurring fees plus a $6,000 setup charge. TCV is $66,000. ACV strips the setup fee and annualizes: ($66,000 - $6,000) / 3 = $18,000 ACV.
Here's where things get messy. Some companies include one-time fees in ACV. Others don't. Some annualize from contract start date; others from billing start date. Neither approach is wrong - the key is internal consistency. Pick a definition, document it, and make every team use the same one.
ACV Segments
The industry generally segments ACV into three bands:
- SMB: under $10K ACV
- Mid-market: $10K-$50K ACV
- Enterprise: $50K+ ACV
One useful finding from SaaS Capital's 2025 survey of 1,000+ private B2B SaaS companies: ACV levels don't appear correlated with growth rate. A company selling $5K deals can grow just as fast as one selling $100K contracts - what matters more is retention and expansion efficiency. That's a useful corrective for teams obsessing over moving upmarket.
While ACV and ARR originated in SaaS, telecom, financial services, and any subscription-based business use the same framework. A 3-year telecom infrastructure contract needs the same annualization discipline as a SaaS license.
ARR Explained
Formula and Worked Example
ARR tells you what your recurring revenue would be over the next twelve months if nothing changed. It's the single most important number on a SaaS board deck.
Or, if you want the components:
ARR = Starting ARR + New ARR + Expansion ARR - Churned ARR - Contraction ARR
Take a company doing $10,000 in MRR. Their ARR is $120,000. If they add $2,000 in new MRR next month and lose $500 to churn, the new MRR is $11,500, and ARR becomes $138,000.
ARR Isn't GAAP
ARR is treated like a standardized metric, but it isn't. It's a non-GAAP operating metric, and definitions vary across companies in ways that make peer benchmarking unreliable.
The r/FPandA community has flagged this repeatedly - ARR definitions differ enough between companies that comparing your ARR to a benchmark without understanding the underlying definitions is misleading. One company counts committed expansions. Another counts only live billing. A third includes usage overages above a threshold. Your ARR definition could make you look 10% better or worse than a peer depending on what you include, and investors know this. That's why diligence always involves asking exactly what's in and what's out.
Related Metrics You Need to Know
TCV, MRR, and CARR
These three metrics orbit ACV and ARR, and confusing them causes real reporting problems.
TCV (Total Contract Value) is the full dollar amount of a contract over its entire term, including one-time fees. A 3-year deal at $40K/year with a $10K implementation fee has a TCV of $130K.
MRR (Monthly Recurring Revenue) is the monthly slice of ARR. It's the most granular view of recurring revenue momentum and the metric early-stage companies should watch obsessively. If you want a deeper breakdown, see our MRR guide.
CARR (Committed Annual Recurring Revenue) is the one most teams miss. Mercury defines it as contracted recurring revenue that hasn't gone live yet. A $120K/year deal signed in June with billing starting in September sits in CARR until go-live, then moves to ARR. If you're an enterprise SaaS company with 60-90 day implementations, the gap between CARR and ARR can be significant - and investors will ask about it.
Bookings vs ARR vs Revenue
Most finance teams trip over the three-layer model. Graphite Financial's framing is the clearest we've found.
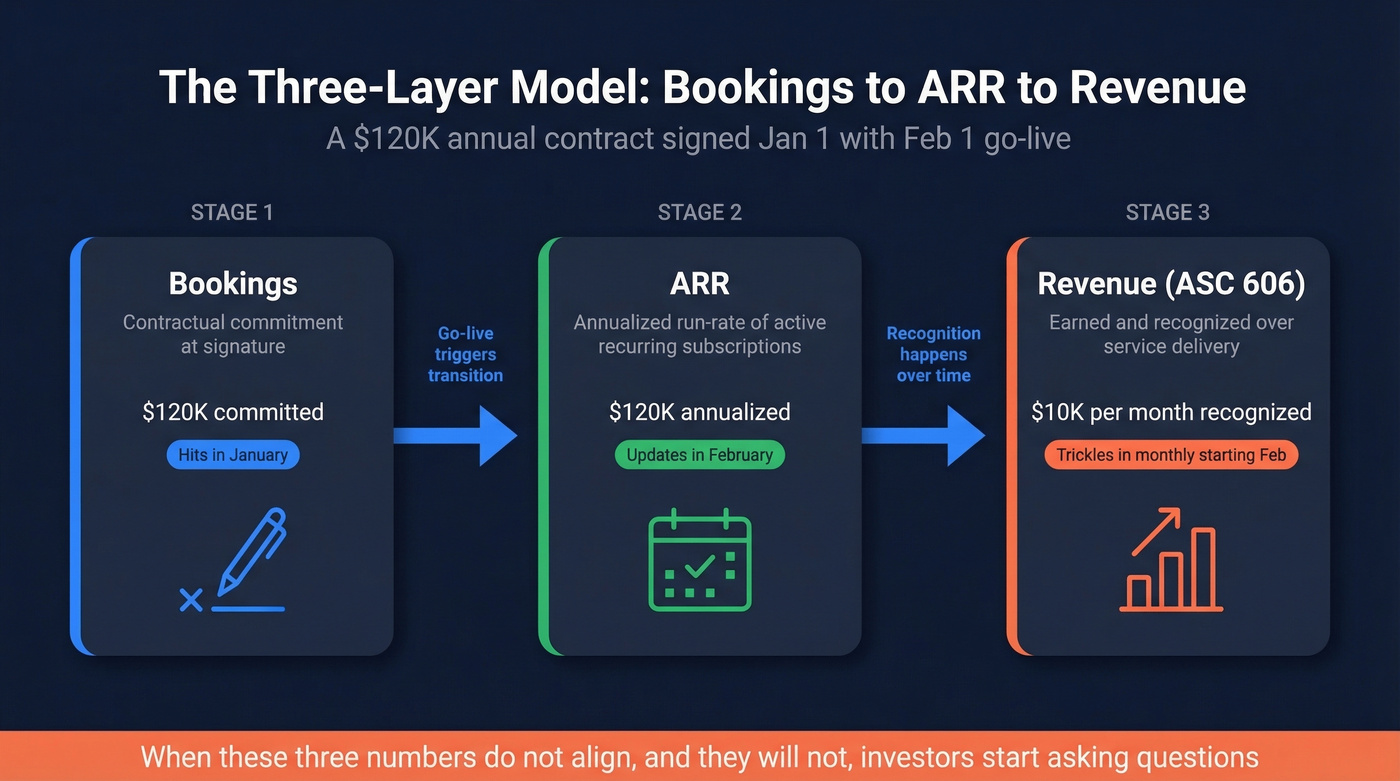
Bookings = contractual commitment at signature. The deal is signed. Money is promised.
ARR = annualized run-rate of active recurring subscriptions. It's a bridge metric between what sales closed and what finance recognizes. (More detail in our ARR guide.)
Revenue = earned per ASC 606. Recognized over the service delivery period, not at signature.
A $120K annual contract signed January 1 with a February 1 go-live date generates $10K/month in recognized revenue starting February. The bookings hit in January. The ARR updates in February. Revenue trickles in monthly. When these three numbers don't align - and they won't - investors start asking questions. Misalignment between bookings and audited revenue is a red flag in diligence.
Your ARR growth depends on pipeline. Pipeline depends on reaching real decision-makers. Prospeo's 300M+ profiles with 98% email accuracy and 125M+ verified mobiles mean your reps connect with buyers - not bounce addresses that inflate activity metrics while ARR flatlines.
Stop debating metrics. Start building the pipeline that moves them.
NRR, GRR, and Growth
Net Revenue Retention is arguably more important than ARR itself, because it tells you whether your existing customers are growing or shrinking. If you’re building an expansion motion, a land and expand strategy is usually the operating model behind strong NRR.
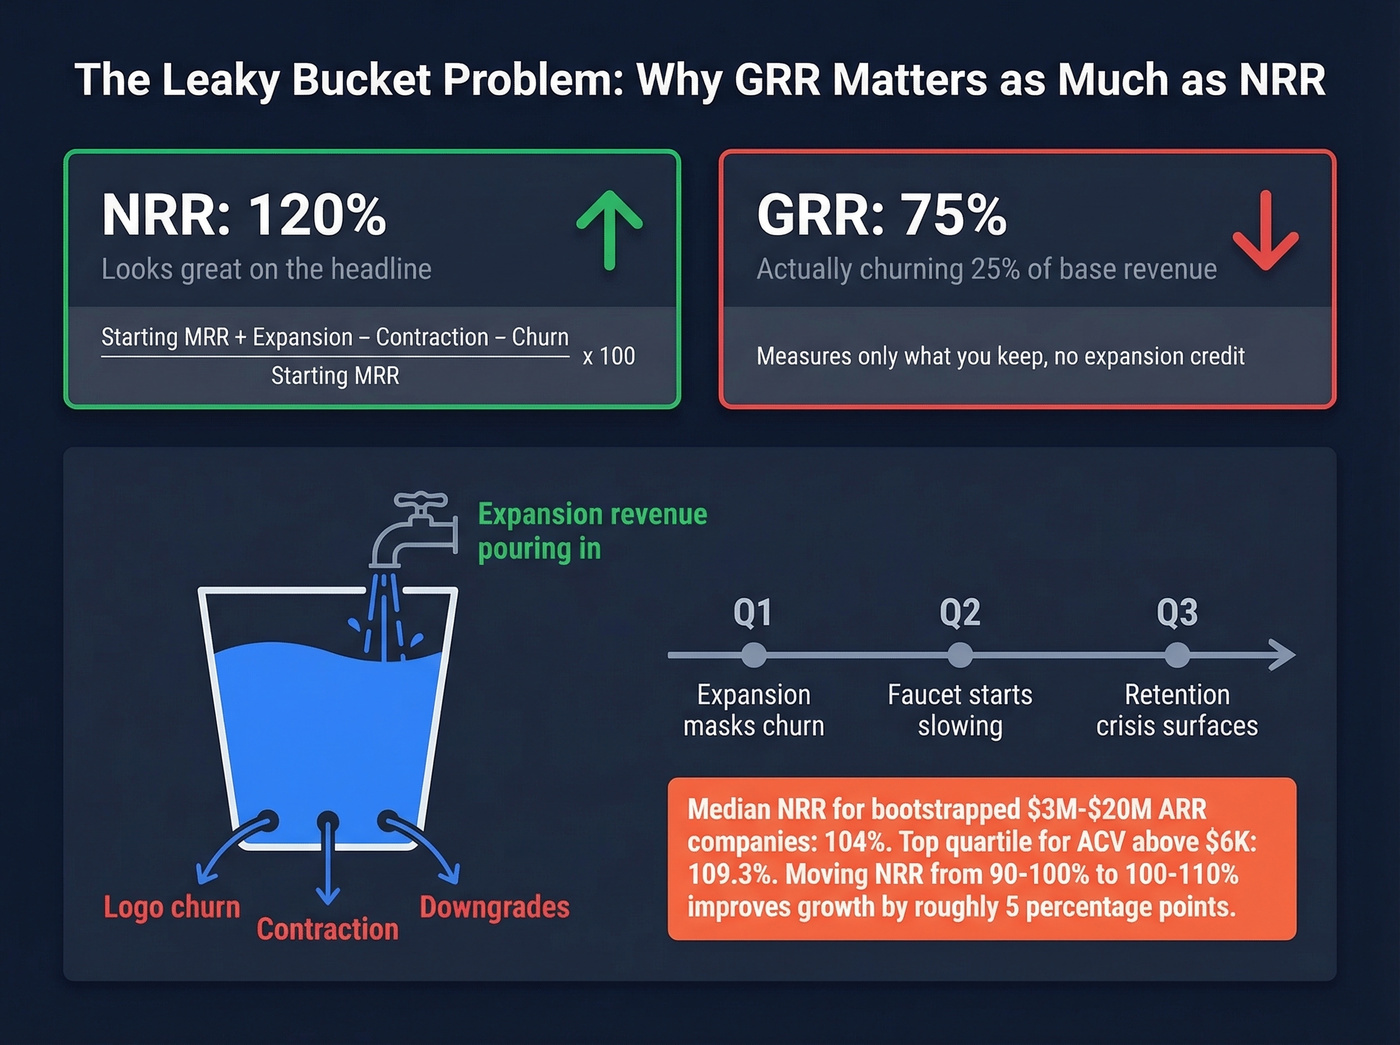
NRR = (Starting MRR + Expansion - Contraction - Churn) / Starting MRR x 100
Gross Revenue Retention strips out expansion and only measures how much you keep. GRR is always <= 100%. NRR can exceed 100% if expansion outpaces churn.
The warning from CRV's analysis is worth internalizing: a company with 120% NRR and 75% GRR looks great on the headline number but is actually churning a quarter of its base revenue and papering over it with upsells. That's a leaky bucket with a fast-running faucet. Eventually the faucet slows down.
Let's be honest - we've seen companies celebrate NRR numbers north of 130% while ignoring the fact that their GRR was cratering. The expansion revenue masked a retention crisis for two or three quarters before the whole thing unraveled. Watch both numbers. Always.
For bootstrapped companies in the $3M-$20M ARR range, median NRR is 104%, with the 90th percentile hitting 118%. B2B companies with ACV above $6K see top-quartile NRR of 109.3%. SaaS Capital's data shows that moving NRR from the 90-100% band to 100-110% improves growth by roughly 5 percentage points. That's the difference between a good company and a great one.
2026 Benchmarks
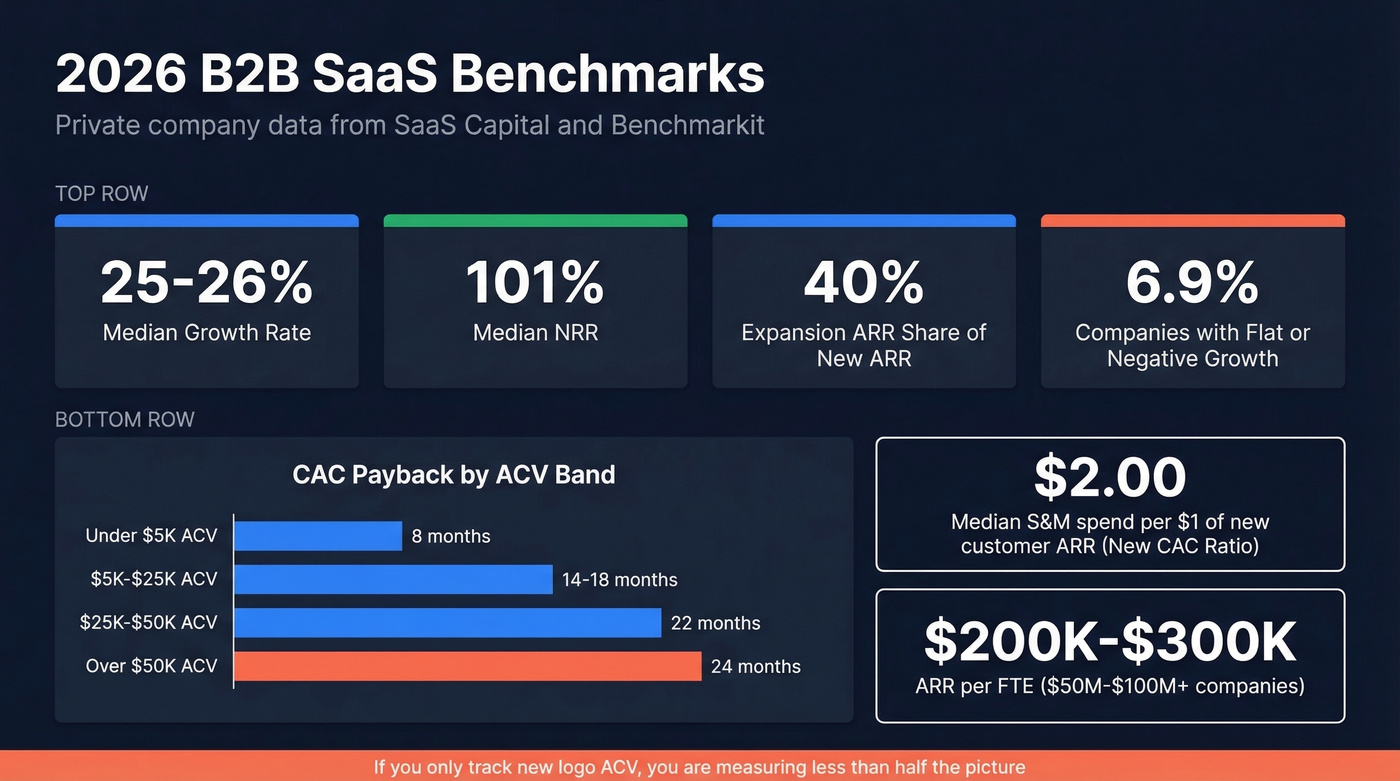
Real numbers on what "good" looks like right now, pulled from SaaS Capital's private B2B SaaS survey and Benchmarkit's operational benchmarks.
Growth and Retention
| Metric | Benchmark |
|---|---|
| Median growth rate | 25-26% |
| Flat/negative growth | 6.9% of companies |
| Bootstrapped median | 23% |
| Equity-backed median | 25% |
| Median NRR | 101% |
| Expansion ARR share | 40% of total new ARR |
| Expansion (>$50M ARR) | >50% of total new ARR |
CAC Payback by ACV Band
| ACV Band | CAC Payback |
|---|---|
| < $5K | ~8 months |
| $5K-$25K | 14-18 months |
| $25K-$50K | ~22 months |
| > $50K | ~24 months |
Two data points worth calling out: the median New CAC Ratio sits at $2.00 in S&M spend per $1.00 of new customer ARR, and ARR per FTE runs $200K for companies in the $50-100M range, climbing to $300K above $100M. If you’re pressure-testing efficiency, it helps to track a consistent set of sales productivity metrics.
Expansion ARR now accounts for 40% of total new ARR at the median. For companies above $50M, it's over half. If you're only tracking new logo ACV, you're measuring less than half the picture. This is the single biggest blind spot in sales-led organizations - the comp plan rewards new logos, but the growth engine runs on expansion.
How These Metrics Affect Sales Comp
This is where the definitional debates stop being academic and start costing people money.
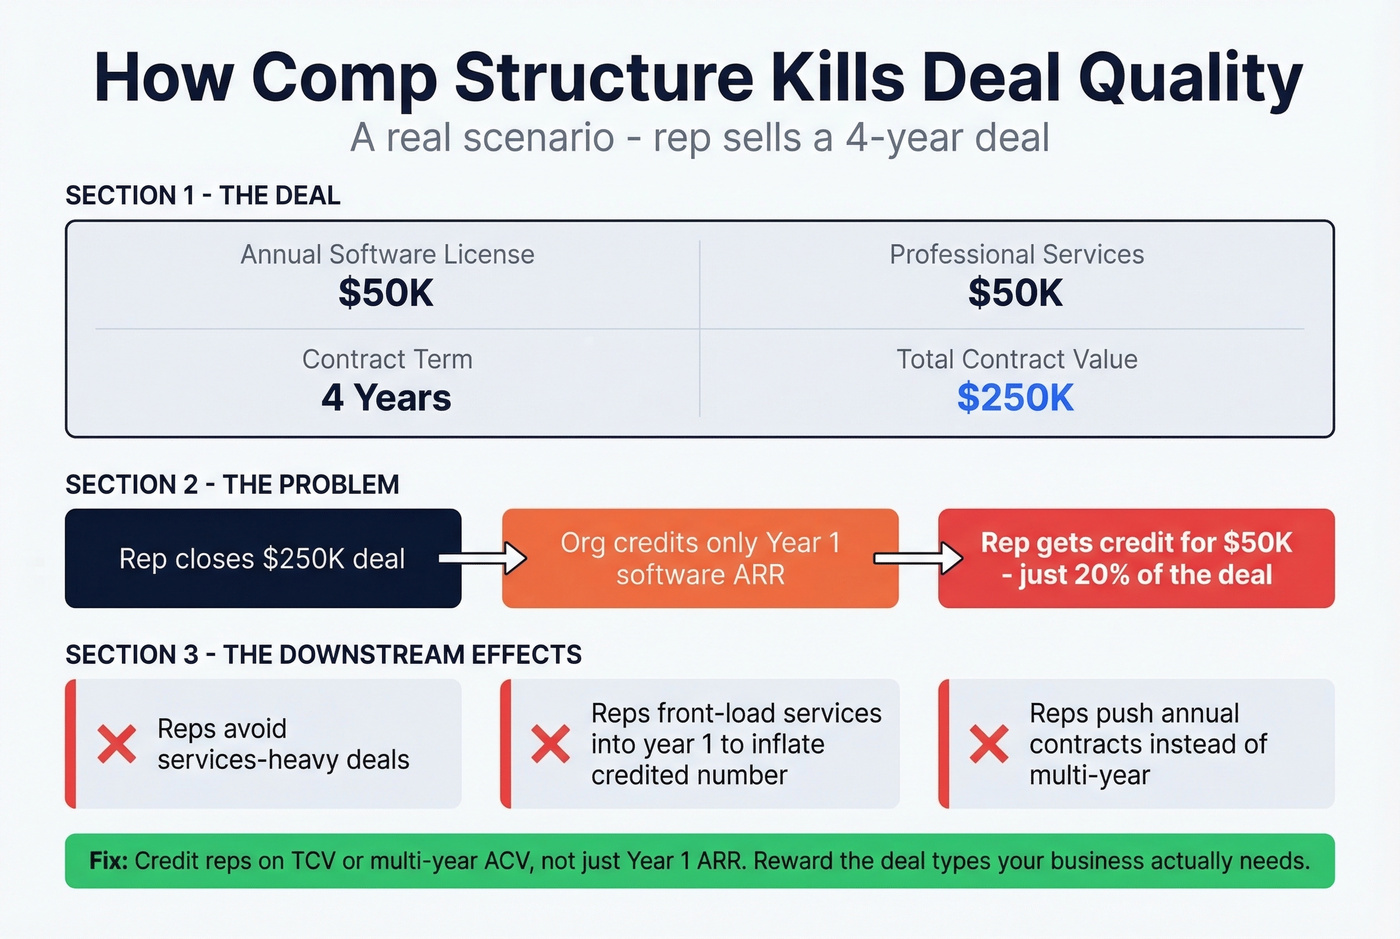
Consider a real scenario from r/sales: a rep sells a 4-year deal with $50K annual software license plus $50K in professional services. TCV is $250K. But the org credits only year-1 software ARR - $50K. The rep just closed a quarter-million-dollar deal and gets credit for a fifth of it.
The downstream effects are predictable. Reps avoid services-heavy deals. They front-load services into year one to inflate the credited number. They push for annual contracts instead of multi-year because the comp structure doesn't reward term length. We've seen this pattern destroy services attach rates at companies that should be selling implementation alongside software.
Here's the thing: most SaaS companies under $20M ARR don't have a "sales problem." They have a comp structure that punishes exactly the deal types they need. If your sales comp is based on year-1 ARR only, you're incentivizing reps to avoid multi-year deals and services attach. Fix this before you wonder why your average deal term is shrinking. This is also where a lightweight deal management software layer can help enforce consistent crediting rules.
Common Mistakes
These are the six errors we see most often, synthesized from practitioner discussions and our own operational audits.
Adding ACV totals to ARR. ACV is per-contract. ARR is company-wide. Adding them double-counts revenue. This sounds obvious, but it happens in dashboards more than anyone admits.
Including one-time fees in ARR. Setup charges, implementation fees, and training costs aren't recurring. They don't belong in ARR. Ever.
Not re-annualizing renewals at new terms. A customer renews at a different price or term length. If you don't recalculate, your ARR is stale.
No codified timing rules. Does the booking count on opportunity creation date, close date, or billing start date? If you haven't written this down, your CRM reports and finance reports will never match. This is a classic RevOps issue - see our RevOps tech stack blueprint for how teams operationalize it.
Inconsistent definitions across teams. Sales uses one ARR definition in Salesforce. Finance uses another in the board deck. Marketing uses a third for case studies. Nobody notices until the board meeting.
Counting usage overages as committed ARR. Variable consumption above a committed minimum isn't recurring. Treat it separately - either as a trailing average or exclude it entirely.
The fix is unglamorous but essential: open a doc, write down exactly how your company calculates ACV, ARR, and bookings, and make every team lead sign off. Update it annually.
And while you're cleaning up definitions, clean up the data feeding them. ARR accuracy starts with pipeline data quality - if your CRM is full of stale contacts and bounced emails, your bookings data is unreliable, and everything downstream is compromised. Prospeo's 98% email accuracy and 7-day data refresh cycle keep the contacts in your pipeline reachable and current, so the deals flowing into your ARR calculations are built on solid ground. If you’re actively fixing decay, start with CRM deduplication and a repeatable data hygiene process.
Expansion ARR and NRR don't improve if your team can't identify and reach the right stakeholders inside existing accounts. Prospeo's CRM enrichment returns 50+ data points per contact at a 92% match rate - so your CS and expansion reps always have verified paths to decision-makers.
Turn your customer base into your biggest growth lever for $0.01 per email.
Which Metric to Report
The answer depends on your stage and your audience.
Pre-PMF / Pre-seed: Lead with MRR momentum. Investors at this stage care about trajectory, not absolute numbers. Show month-over-month MRR growth.
Post-seed / Series A: ARR becomes the headline metric. Pair it with NRR and expansion trends to show the revenue engine is compounding, not just adding logos.
Board decks: Lead with ARR. Show NRR and GRR as health indicators. Use ACV for sales team context - average deal size by segment, ACV trends over time, new vs expansion mix.
Sales leaders: Track ACV by segment and by rep. Make sure comp plans account for TCV on multi-year deals, not just year-1 ARR. Review quarterly to catch incentive misalignment early. If you’re rolling this into an ABM motion, align reporting to your ABM dashboard so sales and marketing aren’t arguing over the same accounts.
Investor diligence: Be ready to explain exactly what's included and excluded in your ARR. Have the definitions doc ready. Know your CARR-to-ARR gap. The companies that can reconcile bookings to recognized revenue cleanly get better terms.
FAQ
Can ACV be higher than ARR?
Yes. ACV measures a single contract's annualized value, while ARR measures total company-wide recurring revenue. A $500K/year enterprise deal in a company with $2M ARR represents 25% of ARR. They operate at different scopes entirely.
Does ARR include professional services?
No. ARR includes only recurring subscription revenue. Professional services, implementation fees, and one-time charges are excluded. Including them inflates ARR and raises red flags during investor diligence.
How do you handle usage-based pricing in ARR?
Count committed recurring minimums in ARR. Treat variable overages separately - either as a trailing-3-month average or exclude them entirely. The approach matters less than documenting it consistently and applying it uniformly.
What's the difference between ARR and CARR?
ARR counts live, active recurring revenue. CARR includes signed contracts that haven't gone live yet - it's always equal to or higher than ARR. Investors use the gap between them to gauge deployment velocity and implementation backlog health.
How does pipeline data quality affect ARR accuracy?
Stale CRM contacts and bounced emails make bookings data unreliable, which distorts every downstream metric including ARR. Clean pipeline data - verified emails, fresh records, accurate job titles - is the foundation that makes your revenue metrics trustworthy.