How to Build a B2B Customer Journey Map That Doesn't End Up as Wallpaper
The VP of Marketing just came back from a conference. She's fired up about journey mapping. Two weeks later, there's a beautiful Miro board with color-coded stages, persona icons, and arrows pointing everywhere. Three months later, nobody's opened it.
A B2B customer journey map fails to drive change 67% of the time. Not because the concept is wrong - but because most teams build a poster when they need an operating system.
As one B2B SaaS founder asked on r/AskMarketing: "Where do you even start with customer journey mapping?" The answer is simpler than you think, and it doesn't involve mapping the entire lifecycle on day one.
Five Principles That Separate Useful Maps from Wall Art
- Start with one broken stage, not the full lifecycle. Mapping everything at once produces something too high-level to act on.
- Map the buying committee, not a single persona. B2B deals involve 6-10 stakeholders - your map should reflect that.
- Talk to 8-12 customers. Internal hypothesis maps miss 20-30% of what actually happens, and the missing pieces are the most critical.
- Include touchpoints you don't control - review sites, peer communities, analyst reports. These shape decisions more than your nurture emails.
- Assign owners and KPIs, or the map dies in a slide deck.
What Is a B2B Customer Journey Map?
A B2B customer journey map is a visual model of how a buying organization moves from "we have a problem" to "we're renewing for year three." It captures stages, touchpoints, stakeholders, emotions, and decision points across the entire relationship - not just the marketing funnel.
You're dealing with 6-10 stakeholders per deal, buying cycles that stretch months, and a process that isn't linear. Gartner's research shows buyers loop across six "buying jobs" - problem identification, solution exploration, requirements building, supplier selection, validation, and consensus creation - revisiting each multiple times. Your map needs to reflect that looping reality, not a neat left-to-right funnel.
Why B2B Journey Mapping Matters in 2026
How buyers buy has shifted in ways that make mapping non-optional.
75% of B2B buyers now prefer a rep-free sales experience. But buyers who engage with supplier-provided digital tools alongside a rep are 1.8x more likely to complete a high-quality deal. The takeaway isn't "remove reps." It's "know exactly when and where reps add value."
McKinsey's B2B Buyer Pulse Survey shows buyers now use 10+ channels to interact with vendors, up from five in 2016. They split time roughly one-third each between traditional, remote, and digital self-service interactions - and more than half will switch suppliers over a poor cross-channel experience.
The ROI is tangible. A McCorpCX case study with a global software company found that journey mapping led to a 37% reduction in touchpoints and over 20% improvement in both cost reduction and process efficiency. They identified 740 irrelevant touchpoints across 17 types in a single upgrade journey. That's real operational waste eliminated because someone mapped the journey and asked "why does this touchpoint exist?"
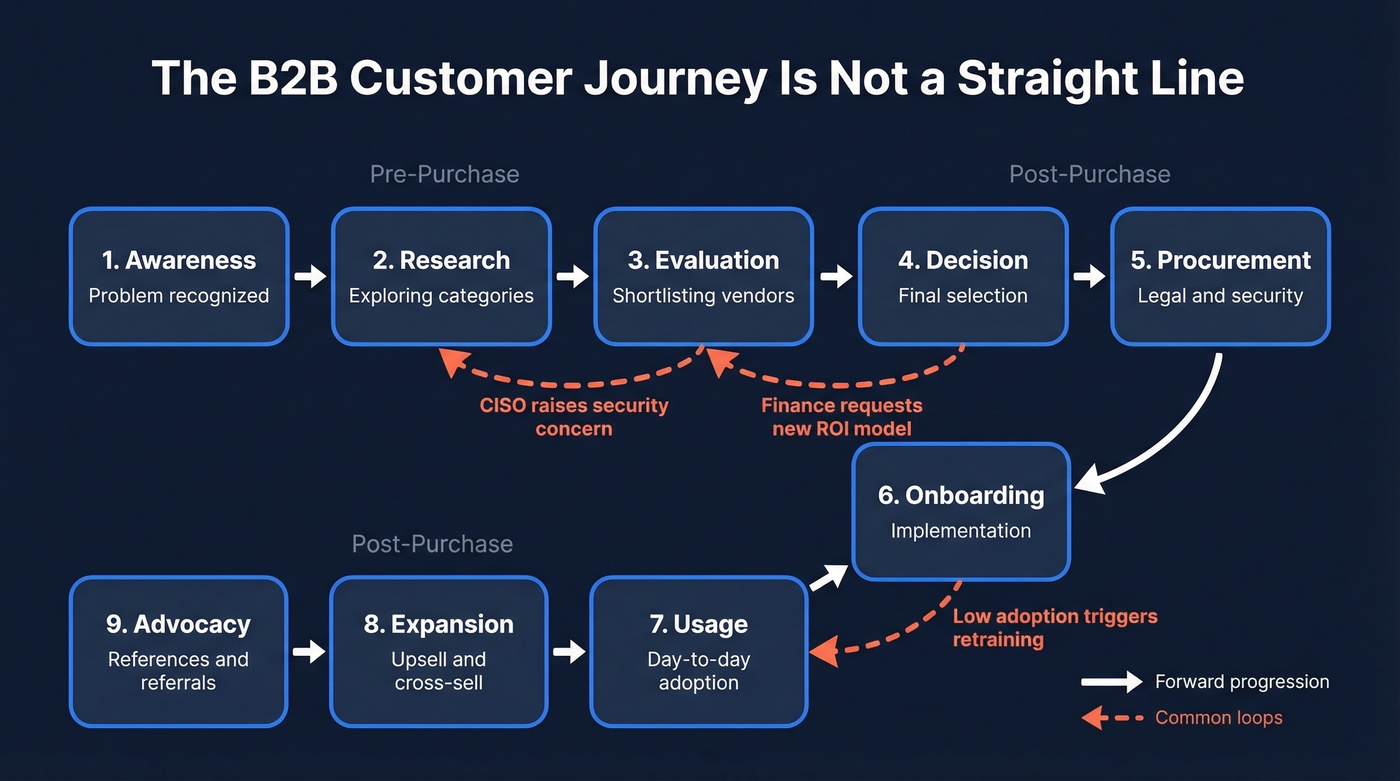
B2B Journey Stages (And Why They Loop)
Most guides give you five stages and call it done. Real B2B journeys need more granularity, especially post-purchase - where retention revenue lives and most maps conveniently stop.
| Stage | What's Happening | Who's Involved |
|---|---|---|
| Awareness | Buyer recognizes a problem | Champion, end users |
| Research | Explores solution categories | Champion, analyst |
| Evaluation | Shortlists vendors, runs demos | Committee (5-10 people) |
| Decision | Final selection, negotiation | Exec sponsor, procurement |
| Procurement | Legal, security, contracts | Legal, IT security, finance |
| Onboarding | Implementation, training | CS, IT, end users |
| Usage | Day-to-day adoption | End users, admins |
| Expansion | Upsell, cross-sell | Champion, AE, CS |
| Advocacy | References, reviews, referrals | Champion, exec sponsor |
Buyers don't march through these sequentially. A CISO raises a security concern during Evaluation that sends the committee back to Research. Finance requests a new ROI model during Decision that reopens Evaluation. Your map should show these backward arrows, not just forward progression.
Your journey map is only as useful as your ability to reach every stakeholder on it. Prospeo covers 300M+ profiles with 98% email accuracy and a 7-day refresh cycle - so the buying committee you mapped last week still has working contact data this week.
Turn your journey map into booked meetings, not wall art.
How to Build a B2B Customer Journey Map in 8 Steps
1. Pick One Broken Stage
Don't boil the ocean. Identify the stage where deals stall, churn spikes, or handoffs break. We've seen teams spend months on a full-lifecycle map that's too high-level to diagnose anything. A detailed map of your Evaluation-to-Decision gap will drive more change than a pretty poster of all nine stages.
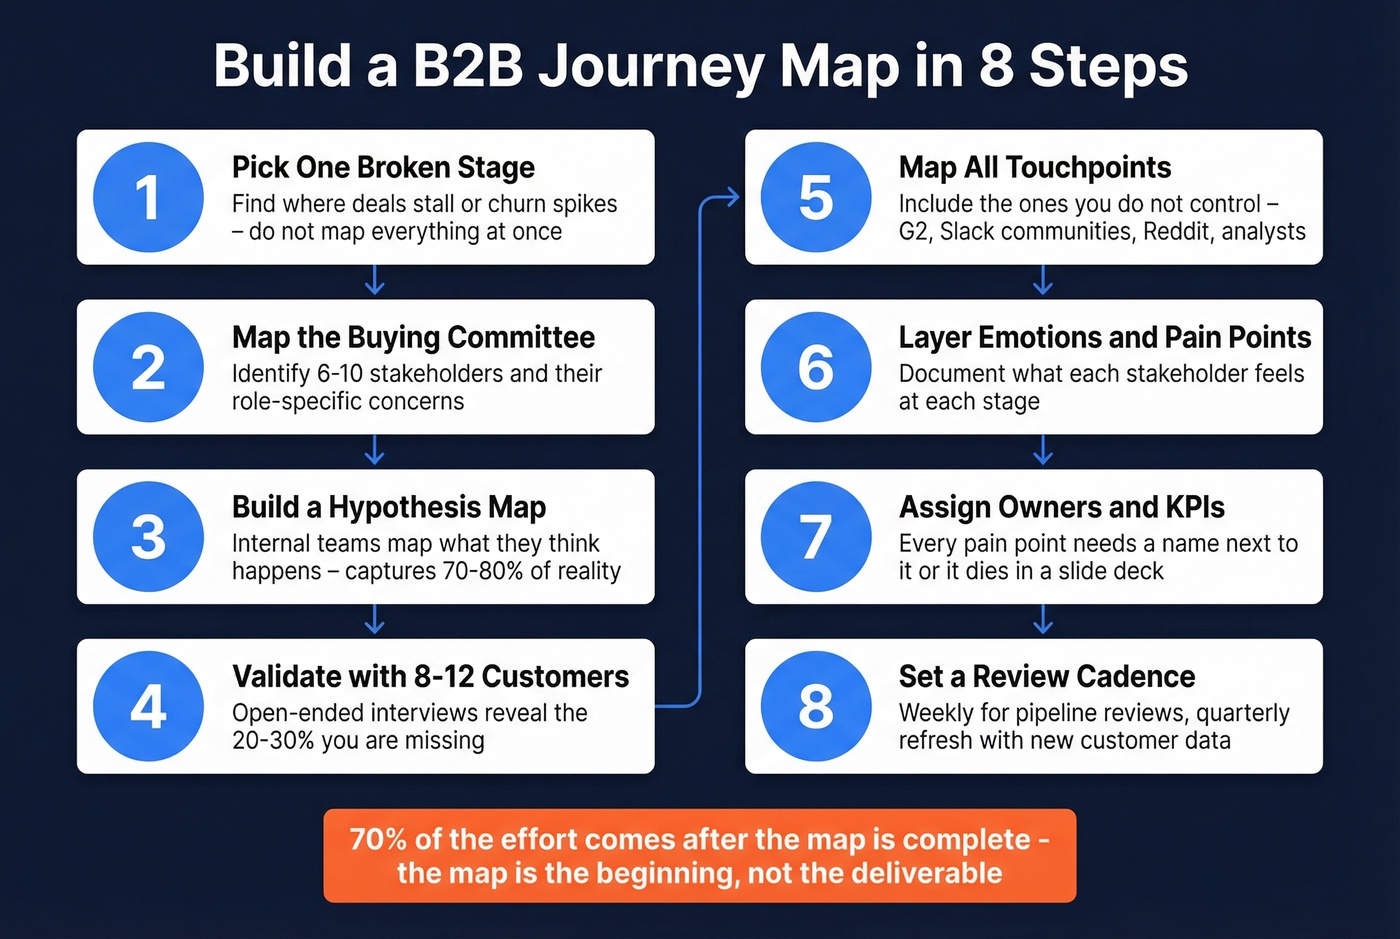
2. Map the Buying Committee
Each deal involves a committee, and each role experiences the journey differently. The CISO cares about the security review. The CFO cares about the ROI model. The end user cares about whether the tool is painful to learn.
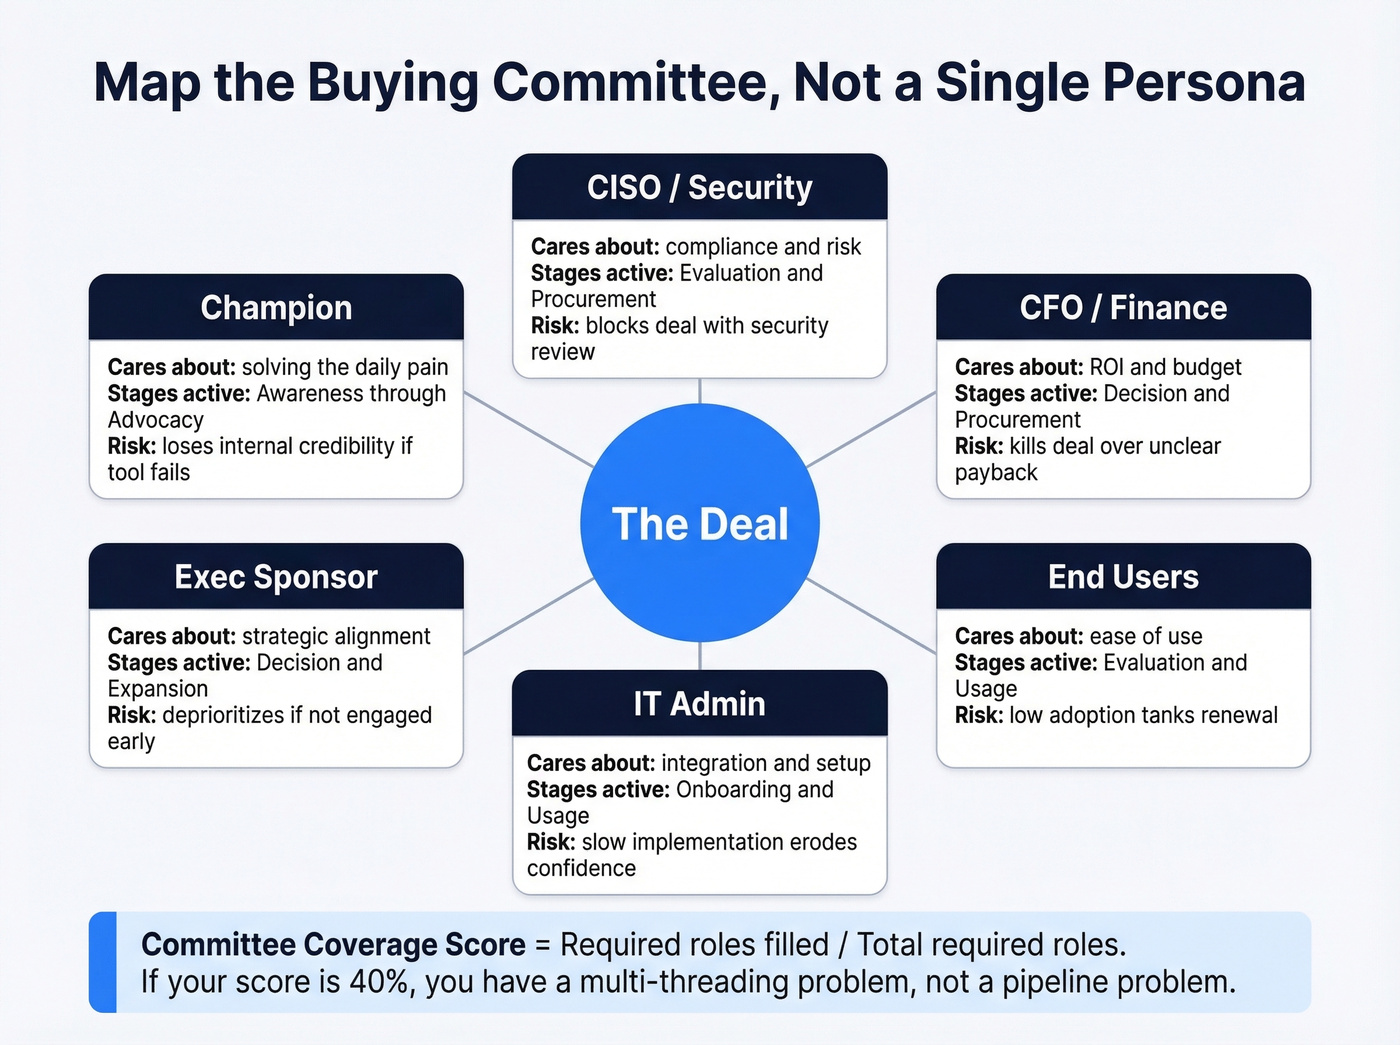
Build a committee map first, then derive role-based milestones: security review started, finance model validated, exec sponsor aligned. Track a "committee coverage score" per opportunity - required roles filled divided by total required roles. If your score is 40%, you don't have a pipeline problem. You have a multi-threading problem.
Here's the thing: your map might identify 6-10 stakeholders per deal, but your CRM has contact info for 2-3 of them. Prospeo covers 300M+ profiles with 98% email accuracy and a 7-day refresh cycle, so the committee map you built last week still has working contact data this week.
3. Build a Hypothesis Map
Start with your internal team - sales, CS, marketing, product. Map what you think the journey looks like. This hypothesis map will capture 70-80% of reality. The remaining 20-30% is where the real insights hide.
If you want to pressure-test assumptions faster, tie the hypothesis map to your go-to-market strategy and the handoffs it creates.
4. Validate with 8-12 Customers
70% of journey maps are created without direct customer input, which is why most of them are wrong. Ask open-ended questions: "Walk me through how you decided to buy us." The answers will surprise you. One customer we interviewed described a three-week internal debate about a feature we considered minor - it nearly killed the deal, and nothing in our CRM data hinted at it.
5. Map All Touchpoints
Your owned touchpoints - website, emails, demos, QBRs - are the easy part. The hard part is the "shadowy bits": G2 reviews, peer conversations in Slack communities, analyst reports, Reddit threads where someone asks "has anyone used [your product]?" Map them even though you can't control them.
If you're running ABM, this is also where intent based segmentation and channel-level tracking start to matter.
6. Layer Emotions and Pain Points
For each stage and stakeholder, document what they're feeling. "Overwhelmed by vendor options" during Research. "Anxious about migration risk" during Decision. "Frustrated by slow onboarding" during Implementation. These emotional data points reveal where you're losing trust - and where a well-timed intervention changes the outcome.
This is also a good moment to connect pain points to churn analysis so you can see which emotions predict retention risk.
7. Assign Owners and KPIs
This is where most maps die. Pain points get documented but nobody owns them. Assign each stage to a functional owner. Attach KPIs: MQL-to-SQL conversion rate for Evaluation, time-to-first-value for Onboarding, NPS for Usage.
If you need a KPI shortlist, start with funnel metrics and then add post-purchase measures like renewal and expansion.
Every pain point needs a name next to it. Otherwise it's a diagnosis without a treatment plan.
8. Set a Review Cadence
The best teams use their journey map as a weekly pipeline review artifact - checking committee coverage scores and stage progression for active deals. Quarterly, refresh the map itself based on new customer interviews and win/loss data. In our experience, teams who review their map weekly are far more likely to keep it alive past the first quarter.
To keep the cadence from turning into a status meeting, anchor it to pipeline health and a small set of leading indicators.
One CX executive estimated that 70% of the effort comes after the map is complete. The map is the beginning, not the deliverable.
Worked Example: SaaS Selling to IT Directors
Here's a filled-in journey map for a mid-market SaaS company selling security monitoring to IT Directors. This is the artifact most guides skip.
| Stage | Key Touchpoints | Primary Stakeholder | Emotion | KPI / Owner |
|---|---|---|---|---|
| Awareness | Blog post, G2 category page, peer Slack mention | IT Director | Curious but skeptical | Branded search volume / Marketing |
| Evaluation | Demo, G2 comparison page, security review call with CISO | IT Director + CISO | Overwhelmed by options | MQL-to-SQL rate / SDR-AE |
| Decision | ROI presentation to CFO, procurement negotiation, reference call | CFO + IT Director | Anxious about migration risk | Win rate, cycle length / AE |
| Onboarding | Kickoff call, technical setup, admin training | IT Admin + IT Director | Nervous about time investment | Time-to-first-value / CS |
| Expansion | QBR with VP Engineering, usage report, upsell proposal | VP Engineering + IT Director | Confident (if adoption is high) | NPS, expansion revenue / CS-AE |
When the CISO raises concerns during the security review, trigger a pre-built security FAQ package and schedule a direct CISO-to-CISO reference call - that's how you prevent the deal from looping back to Research for weeks. When onboarding stalls, the IT Director's confidence drops and Expansion becomes impossible. The map isn't a straight line. It's a system with feedback loops, and each loop needs a playbook.
Let's be honest: most teams over-invest in mapping pre-purchase stages and barely sketch post-purchase. But if your net revenue retention is below 110%, the post-purchase map is where your money is. Fix onboarding and expansion before you polish the awareness stage.
If you're trying to operationalize those loops, a RevOps owner (or a dedicated RevOps manager) is usually the difference between "map" and "system."
Why Most Journey Maps Fail
Run your map through these five diagnostic questions. If you answer "yes" to more than two, your map is already dying:
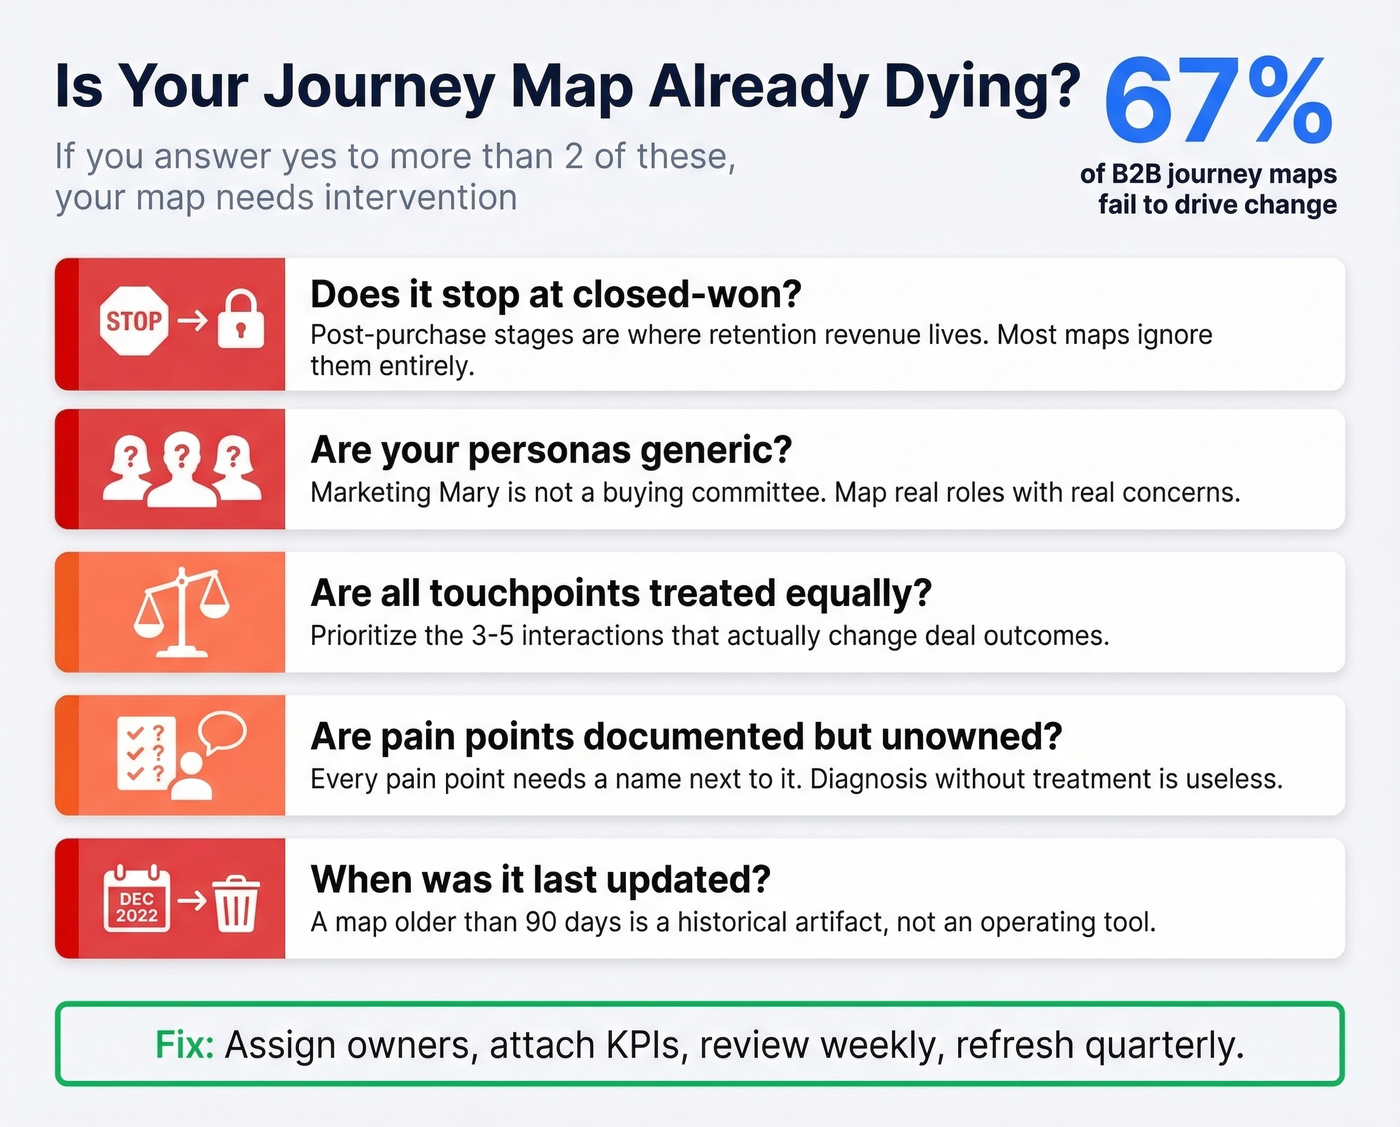
- Does it stop at "closed-won"? Post-purchase stages are where retention revenue lives. Most maps ignore them entirely.
- Are your personas generic? "Marketing Mary" isn't a buying committee. Map real roles with real concerns.
- Are all touchpoints treated equally? Prioritize the 3-5 interactions that actually change deal outcomes.
- Are pain points documented but unowned? Every pain point needs a name next to it.
- When was the last time someone opened it? A map with no review cadence is already stale.
The measurement disconnect is real. 82% of B2B teams had adopted ABM by 2025, but fewer than 25% rate their measurement practices as even fair. The gap isn't awareness - it's execution. Skip this section if your team already has a living, breathing map with quarterly reviews. For everyone else, these five questions are your starting diagnostic.
If you're stuck on the "execution" part, it often comes down to sales execution and whether teams agree on what "progress" means at each stage.
Best Tools for B2B Journey Mapping
| Tool | Free Tier | Paid From | Best For |
|---|---|---|---|
| Miro | Yes | $8/mo/member | Teams under 20 |
| FigJam | Yes | $5/seat/mo | Figma users |
| Mural | Yes | $10/user/mo | Workshop facilitation |
| Lucidchart | Yes | $9/mo | Flowchart-style maps |
| UXPressia | Yes | $160/mo | Dedicated CJM |
| Smaply | Yes | ~$390/mo | Agencies & educators |
| TheyDo | Yes | ~$35K/yr | Enterprise journey ops |
| Custellence | Yes | ~$1,999/mo | Large-scale collaboration |
For most teams, Miro or FigJam is the right starting point - they're flexible, cheap, and your team already knows how to use them. Move to UXPressia or Smaply when you need dedicated journey management features like persona libraries and impact scoring. TheyDo is the enterprise play for organizations running journey ops across multiple products.
These tools visualize the journey. But visualization without data is just a diagram. Once you've mapped who to reach and when, you still need verified contact data to act on it - which is where a platform like Prospeo fits in, giving you 143M+ verified emails and 125M+ mobile numbers refreshed weekly so your outreach actually lands.
If you're comparing options, start with a shortlist of data enrichment services so your map can actually drive outreach and follow-up.
Multi-threading fails when your CRM has emails for 2 of 8 committee members. Prospeo's 30+ search filters - including job title, department, and company - let you fill every role on your buying committee map with verified contact data at $0.01 per email.
Stop mapping stakeholders you can't actually reach.
FAQ
How many touchpoints does a typical B2B journey have?
It varies wildly. In one McCorpCX case study, highest-value customers averaged 14 touchpoints, while some lowest-value segments had 40+. The same study found 740 irrelevant touchpoints across 17 types in a single upgrade journey. Start by mapping touchpoints for one stage, not the entire lifecycle - you'll find the waste faster.
What's the difference between a journey map and a service blueprint?
A journey map shows the customer's experience across stages and touchpoints. A service blueprint adds the internal processes, systems, and people behind each touchpoint. Build the journey map first, then create a service blueprint when you're ready to redesign the operations underneath.
How does B2B journey mapping differ from B2C?
B2C maps track one person making one decision, often in minutes. B2B maps track a buying committee of 6-10 stakeholders making a collective decision over months, with non-linear loops between stages. The committee dimension is what makes B2B mapping fundamentally harder - and more valuable when done right.
How often should you update your journey map?
Quarterly at minimum. The best teams use their map as a weekly pipeline review artifact, checking committee coverage scores and stage progression for active deals. A map that isn't reviewed monthly is already stale - buyer behavior shifts faster than your slide deck.
What's the fastest way to start if you have no existing map?
Pick the stage with the most friction - usually Evaluation or Onboarding - interview 8-12 customers about that specific experience, and build outward from there. Enrich your CRM with verified stakeholder contacts first so you know exactly who to interview and can multi-thread across the committee from day one.