Blended Customer Acquisition Cost: What It Is, How to Calculate It, and When It Lies to You
Your CFO just asked for the company's CAC. You pulled the number, and it looked fine - maybe even great. Here's the problem: that single blended customer acquisition cost figure is the most important acquisition metric you track and the easiest one to misread.
The median SaaS company spends $2.00 for every $1 of new ARR. In practice, a 3-4:1 LTV:CAC ratio is the growth sweet spot - above 5:1 usually means you're under-investing. But blended CAC becomes misleading the moment you mix fundamentally different acquisition motions. Track it alongside channel-level CAC and payback period, or you're flying blind.
What Is Blended CAC?
Blended customer acquisition cost is the total cost of acquiring a new customer across every channel - paid, organic, referral, partner, all of it - divided by the total number of new customers in a given period.
Unlike paid CAC or channel-specific CAC, the blended metric doesn't try to attribute spend to individual sources. It's the "whole business" view: how much does it actually cost you to add one paying customer, everything included? That simplicity is why everyone uses it. It's also why it fools them.
How to Calculate Blended CAC
The Formula and What Goes In It
Blended CAC = Total S&M Expenses / Total New Customers
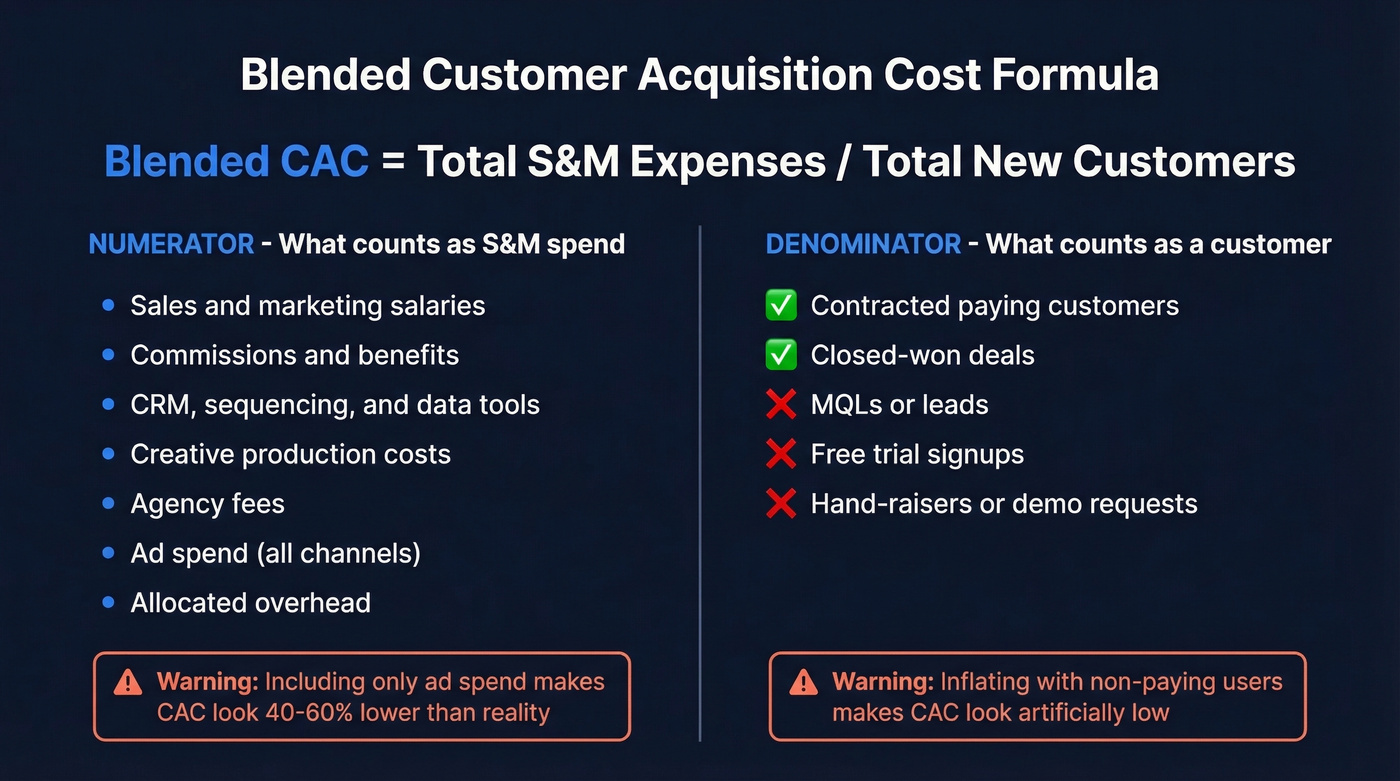
The numerator is where most teams get it wrong. "Total S&M expenses" means everything: salaries, commissions, benefits, tools (CRM, sequencing, data platforms), creative production, agency fees, ad spend, and allocated overhead. Including only ad spend produces a misleadingly low CAC that'll make your board deck look great and your unit economics look fictional.
The denominator matters too. A customer is someone contracted to pay - not an MQL, not a free trial signup, not a "hand-raiser." Inflate your denominator with non-paying users and your acquisition cost looks artificially low.
SaaS Variant: The CARR-Based Ratio
For SaaS companies, a cleaner version uses fully loaded S&M expenses required to generate $1 of new Contracted ARR, including both new and expansion CARR but excluding churn.
The critical nuance is timing. Measure S&M expenses for the period preceding new ARR by the length of your sales cycle. The average B2B SaaS sales cycle runs 134 days - up from 107 days in early 2022. So if you're calculating Q2's blended CAC ratio, you'd use Q1's S&M spend divided by Q2's new CARR.
Worked example with a 90-day lag: $1M in S&M spend / ($600K new CARR + $200K expansion CARR) = $1.25 per $1 of new CARR.
Worked Examples
SaaS example: A B2B SaaS company spends $500K on sales and marketing in Q1 (salaries, tools, ads, commissions). In Q2, they close $350K in new CARR. With a roughly 90-day sales cycle, the blended CAC ratio is $500K / $350K = $1.43 per $1 of ARR - slightly above median, signaling room to optimize the funnel or tighten spend.
Ecommerce example: An online retailer spends $80K/month across Google Ads, Meta, influencer partnerships, and email marketing. They acquire 1,200 new customers that month. Blended CAC = $80K / 1,200 = $67 per customer. But a big chunk of their total orders came from returning customers who cost almost nothing to convert, which is exactly why blended CAC can look better than paid-only CAC.
To pressure-test your acquisition math, it also helps to track funnel metrics and your sales conversion rate alongside CAC.
Bad data inflates your blended CAC silently - bounced emails, wrong numbers, wasted rep hours. Prospeo delivers 98% email accuracy and 30% mobile pickup rates, so every dollar of S&M spend actually reaches a real buyer. Teams using Prospeo book 26% more meetings than ZoomInfo users at 90% lower cost per lead.
Stop paying $2.00 per $1 of ARR when your data is the bottleneck.
Blended CAC vs. Other Types
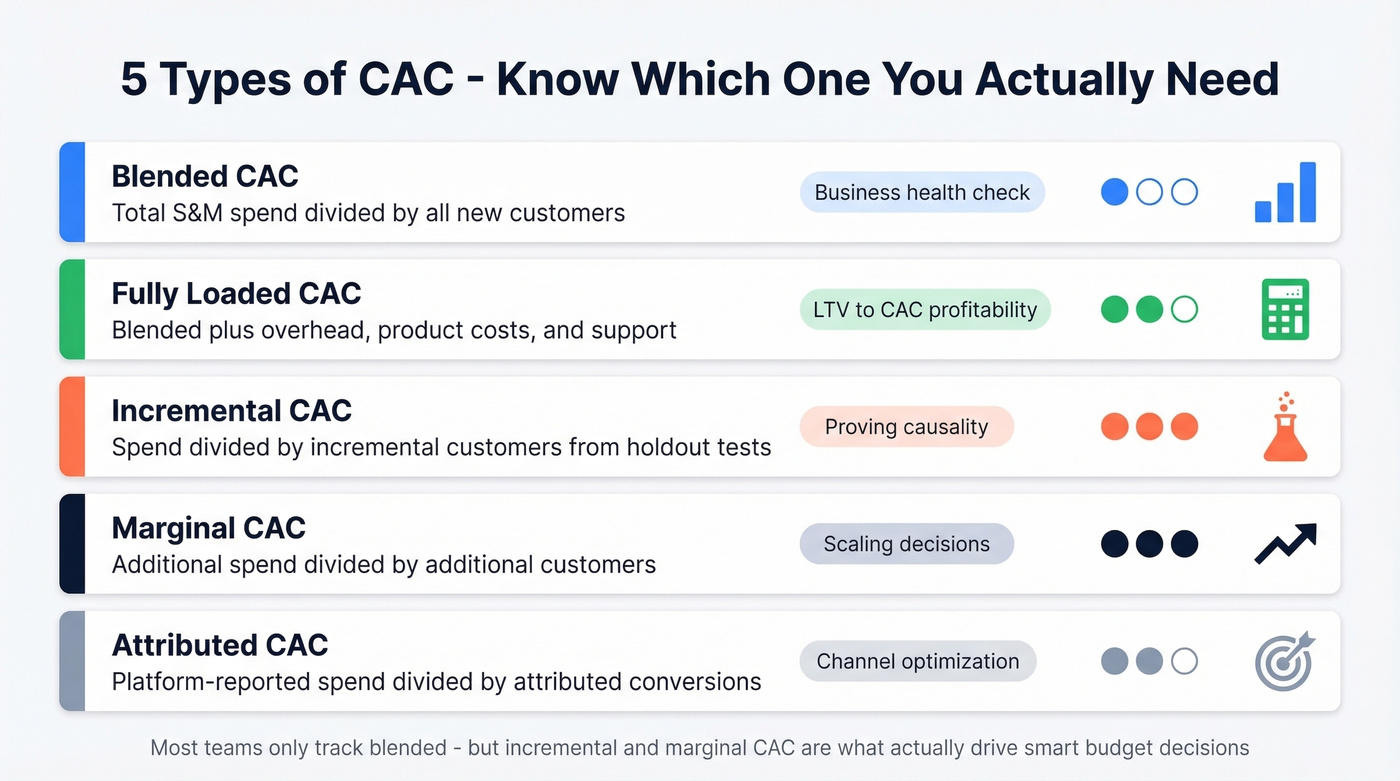
Most teams treat CAC as one thing. It's actually five different metrics.
| Type | Definition | When to Use |
|---|---|---|
| Blended | Total S&M / new customers | Business health check |
| Fully loaded | Blended + overhead, product, support | LTV:CAC profitability analysis |
| Incremental | Spend / incremental customers | Proving causality |
| Marginal | Additional spend / additional customers | Scaling decisions |
| Attributed | Platform-reported spend / attributed customers | Channel optimization |
Blended is straightforward - no attribution model required. That's its advantage. Incremental and marginal CAC require experimentation like holdout tests and geo-lifts, which is why most teams never calculate them. But if paid is a major line item, you should be running those tests.
If you want a deeper baseline on CAC definitions and variants, see our guide to cost to acquire customer.
What's a Good Blended CAC?
SaaS Benchmarks
The median SaaS company spends $2.00 to acquire $1 of new ARR. Top quartile hits $1.00. Bottom quartile bleeds at $2.82.
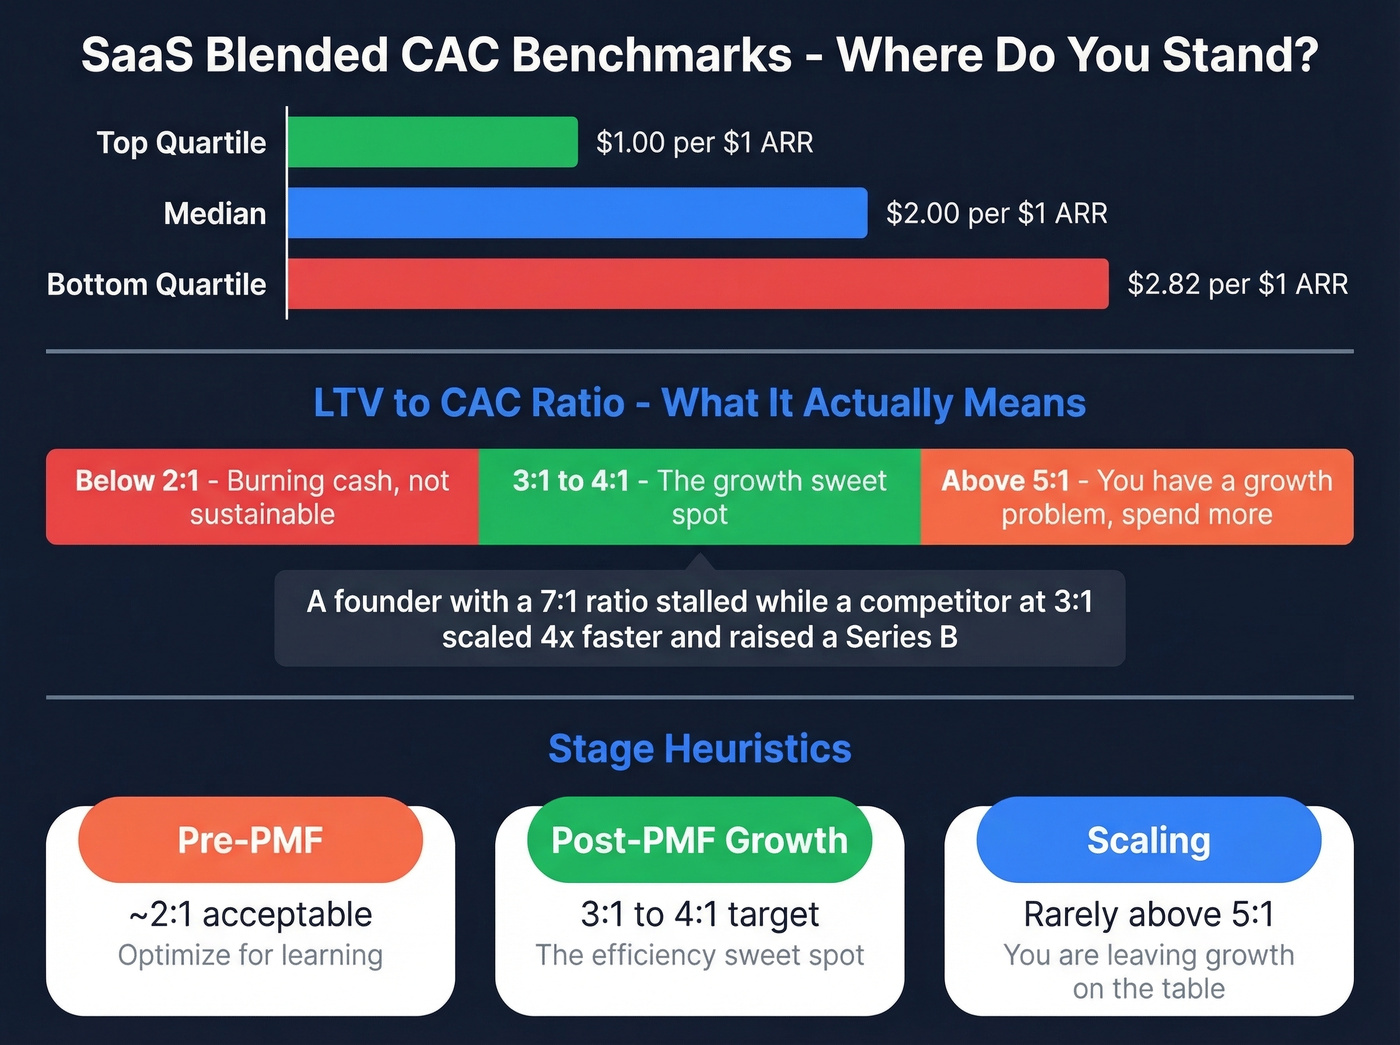
But "lower is always better" is wrong. One founder on r/SaaS shared that their "perfect" 7:1 LTV:CAC ratio was actually a sign of under-investing - a competitor at 3:1 scaled 4x faster and raised a Series B while they stalled.
Let's be honest: if your LTV:CAC ratio is above 5:1 and you're not yet at $50M ARR, you don't have great unit economics. You have a growth problem. Spend more.
Stage heuristics that hold up in practice:
- Pre-PMF: ~2:1 is acceptable - you're optimizing for learning, not efficiency
- Post-PMF growth: 3-4:1 is the sweet spot
- Scaling: Rarely makes sense to stay above 5:1 - you're leaving growth on the table
| Vertical | SMB CAC | Enterprise CAC |
|---|---|---|
| Fintech | $1,450 | $14,772 |
| Ecommerce SaaS | $274 | - |
| Ecommerce SaaS SMB payback | 9 months (good: 4 months) | - |
If you're building a more rigorous model, pair CAC with churn analysis and renewal rate to avoid "efficient" growth that doesn't stick.
Ecommerce Benchmarks
Ecommerce blended CAC ranges from $45 to $250+ depending on vertical - fashion sits at $90-$120, beauty at $90-$130, electronics can spike to $377+. The macro trend is brutal: CAC is up 60%+ over five years, with Facebook CPMs climbing 89% since 2020. If your blended CAC looks the same as it did in 2021, you're either genuinely more efficient or you're not counting everything.
When Blended CAC Misleads You
Here's the thing: blended CAC becomes useless when you're averaging across fundamentally different motions. A discussion on r/SaaS illustrated this perfectly - if your enterprise customers have $50K LTV / $15K CAC and your self-serve customers have $2K LTV / $200 CAC, both motions are healthy. Blend them and you get nonsense numbers that describe neither business accurately.
Attribution makes it worse. Apple's ATT reduced signal quality, cookie deprecation remains messy, and brand CPCs are up ~13% YoY while non-brand barely moved at ~3%. Any "exact" CAC number is a model, not a fact.
If you're mixing motions, it helps to define your ideal customer profile and track pipeline health by segment, not just in aggregate.
Warning Signs Your Blended CAC Is Lying
In our experience, the teams that get burned by blended CAC are the ones running enterprise and self-serve motions under one number. Watch for these red flags:
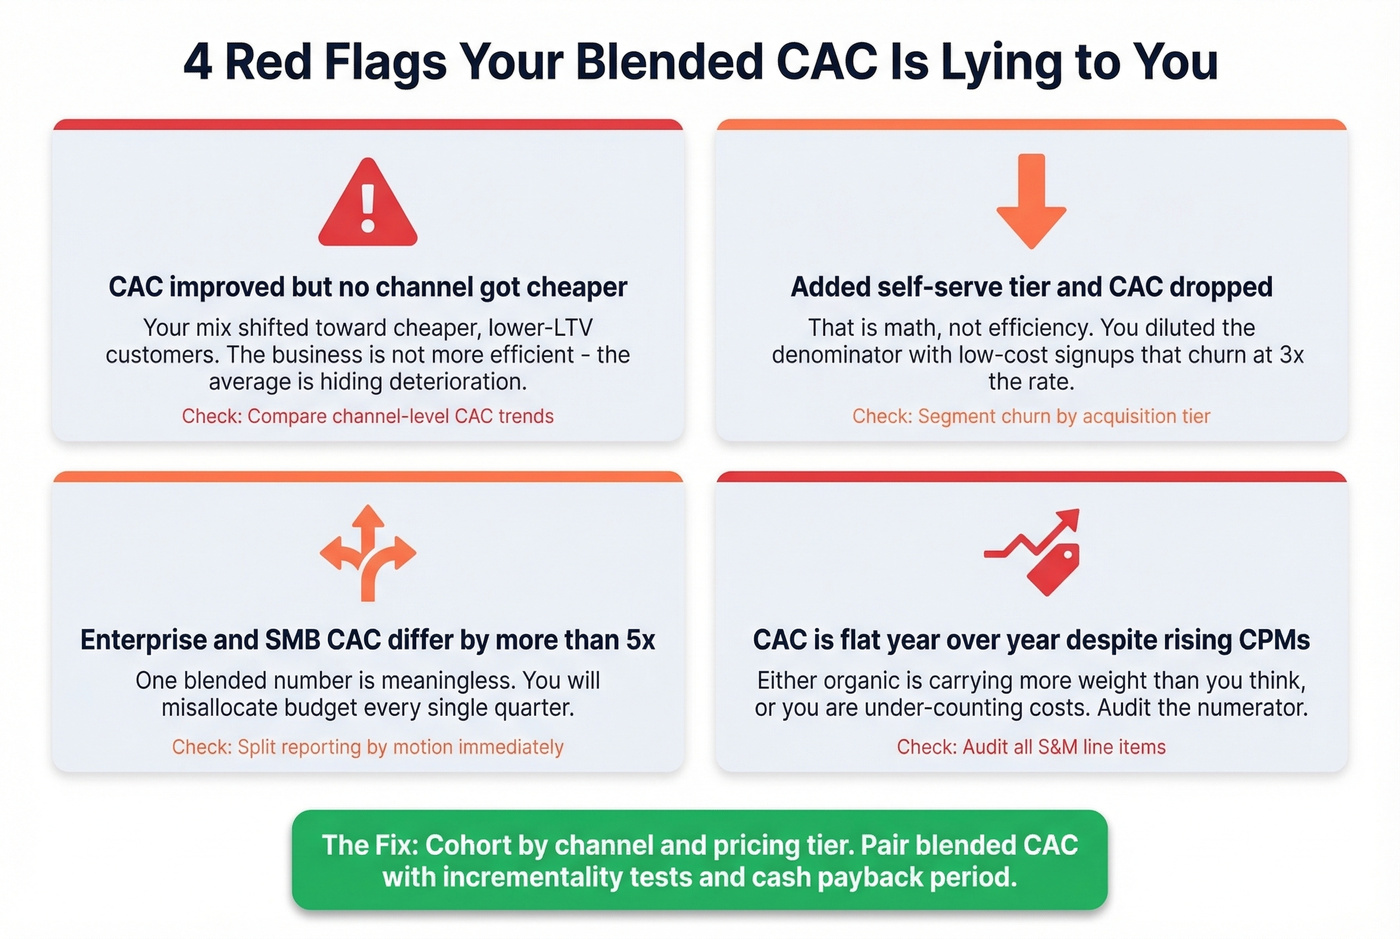
- Your blended CAC improved but no single channel got cheaper. That means your mix shifted - probably toward cheaper, lower-LTV customers. The business isn't more efficient; the average is hiding deterioration.
- You added a self-serve tier and blended CAC dropped. That's math, not efficiency. You diluted the denominator with low-cost signups that churn at 3x the rate.
- Your enterprise and SMB motions have a >5x CAC difference. One blended number is meaningless. Split them or you'll misallocate budget every quarter.
- Blended CAC is flat year-over-year despite rising CPMs. Either organic is carrying more weight than you think (good) or you're under-counting costs (bad). Audit the numerator.
The fix: cohort by channel and pricing tier. Pair blended CAC with incrementality tests and cash payback period. The blended figure tells you the business is healthy; cohorted data tells you where it's healthy.
How to Reduce Blended CAC
Three levers that actually move the number.
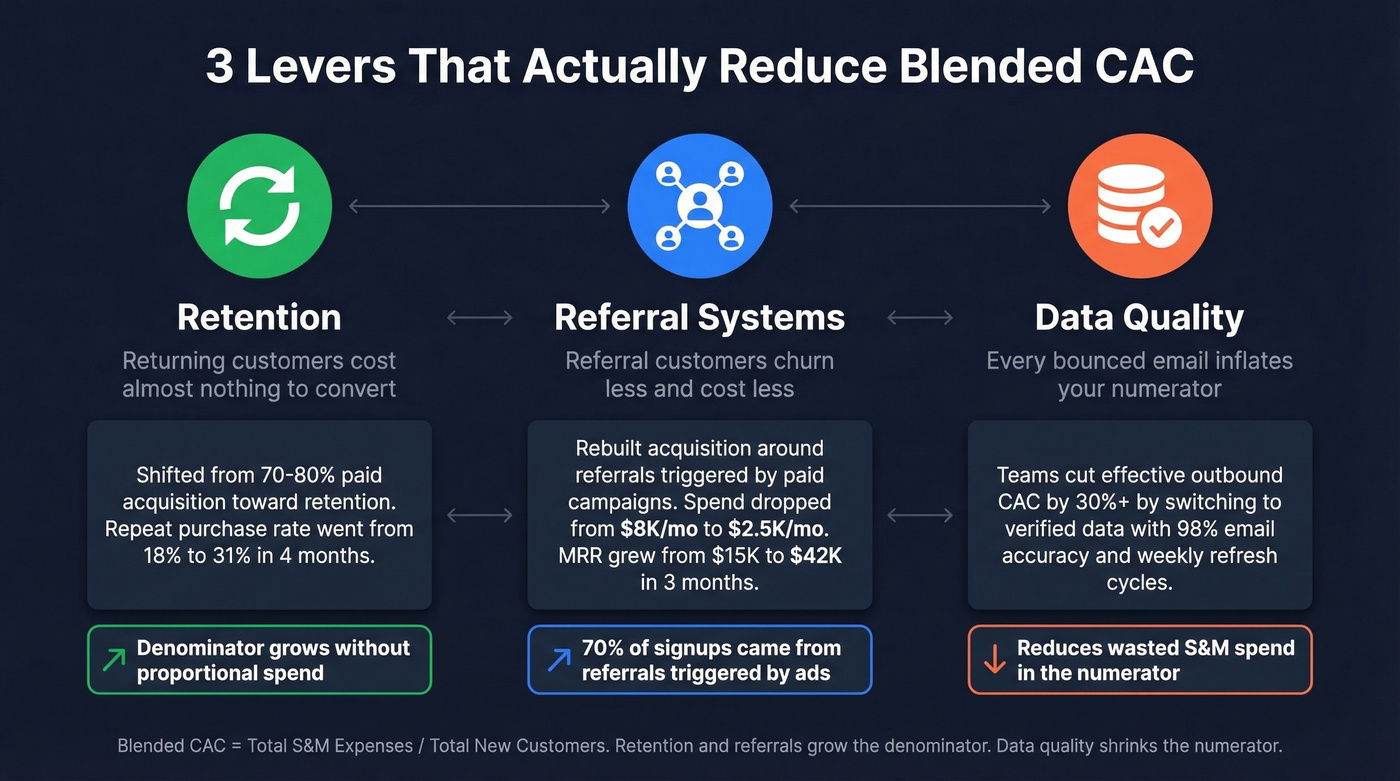
Retention. Returning customers cost almost nothing to convert. One ecommerce operator shifted budget from 70-80% paid acquisition toward retention and pushed repeat purchase rate from 18% to 31% in four months. Blended CAC dropped because the denominator grew without proportional spend. If you're spending 80% of your budget chasing new logos and ignoring the customers you already have, start there before touching anything else.
Referral systems. A SaaS founder rebuilt acquisition around referrals triggered by paid campaigns - spend dropped from $8K/mo to $2.5K/mo, MRR went from $15K to $42K in three months, and referral customers churned less. The insight: blended CAC revealed that 70% of signups came from referrals triggered by ads, which channel-level CAC would've missed entirely.
Data quality. Every bounced email and wrong phone number inflates your numerator without adding a single customer to your denominator. Bad contact data turns outbound spend into pure waste. We've seen teams cut their effective outbound CAC by 30%+ just by switching to verified data sources with 98% email accuracy and weekly refresh cycles - tools like Prospeo exist specifically for this, and the free tier lets you test the impact on your own numbers before committing.
If outbound is part of your mix, improving sales prospecting techniques and tightening sequence management can reduce wasted touches that never reach a buyer.
When you break blended CAC by channel, outbound efficiency comes down to data quality. Prospeo's 7-day refresh cycle means your reps aren't burning sequences on stale contacts - 143M+ verified emails, 125M+ verified mobiles, all at $0.01 per lead. That's how teams like Snyk drove 180% more AE-sourced pipeline with bounce rates under 5%.
Fix the denominator in your CAC formula by reaching real buyers first.
FAQ
What's the difference between blended CAC and paid CAC?
Blended CAC includes all sales and marketing spend divided by total new customers. Paid CAC isolates only paid channel spend and the customers attributed to those channels. Use blended for the full business picture; use paid to optimize specific channel budgets and spot rising CPMs before they erode margins.
What costs should I include in blended CAC?
Include all sales and marketing expenses: salaries, commissions, benefits, tools, creative production, agency fees, ad spend, and allocated overhead. Counting only ad spend produces a number 40-60% lower than reality - great for board decks, terrible for planning.
How often should I calculate blended CAC?
Monthly rolling for SaaS, weekly for ecommerce. Always lag expenses by your average sales cycle length - roughly 90-134 days for B2B SaaS. And keep your numerator honest by using verified contact data so wasted outbound spend doesn't inflate the number.
Can blended CAC be too low?
Yes. A blended CAC that produces an LTV:CAC ratio above 5:1 at sub-$50M ARR usually signals under-investment, not efficiency. Companies at 3-4:1 consistently outgrow peers who optimize for low acquisition costs at the expense of market share.