The Email Click Through Rate Formula - And Why Most Guides Get It Wrong
You're in a Monday metrics review. Your boss says the last campaign hit 5% CTR. You're looking at the same dashboard and seeing 2.3%. Neither of you is lying - you're just using different formulas, and neither of you realizes it.
The click through rate email formula seems simple, but the exact denominator you choose changes everything. This argument plays out on r/Emailmarketing regularly, where practitioners can't agree on whether the denominator should be emails sent, emails delivered, or emails opened. Let's settle it.
The CTR Formula for Email
Here's the formula most ESPs use and the one you should default to:
Email CTR = (Unique Clicks / Delivered Emails) x 100
"Delivered" means sent minus bounces. Not total sends - delivered. If you sent 5,200 emails and 200 bounced, your delivered count is 5,000. That's your denominator.
Worked example:
- Emails sent: 5,200
- Bounces: 200
- Delivered: 5,000
- Unique clicks: 150
CTR = (150 / 5,000) x 100 = 3.0%
Why unique clicks and not total clicks? Because if one person rage-clicks your link six times, that doesn't mean six people were interested. Unique clicks give you a clean count of how many individual recipients engaged. This calculation is the industry standard for a reason - it tells you what percentage of reachable people took action.
Note that ActiveCampaign's published formula uses total clicks in the numerator, and some dashboards let you toggle between unique and total. In practice, most ESP dashboards surface unique clicks as the default "click rate" number.
One thing to watch: some teams use "sent" as the denominator instead of "delivered." That artificially deflates your CTR because you're dividing by emails that never reached anyone. Always use delivered.
CTR vs CTOR vs TCTR
This is where the confusion lives. Three metrics, three different denominators, three different numbers from the exact same campaign.
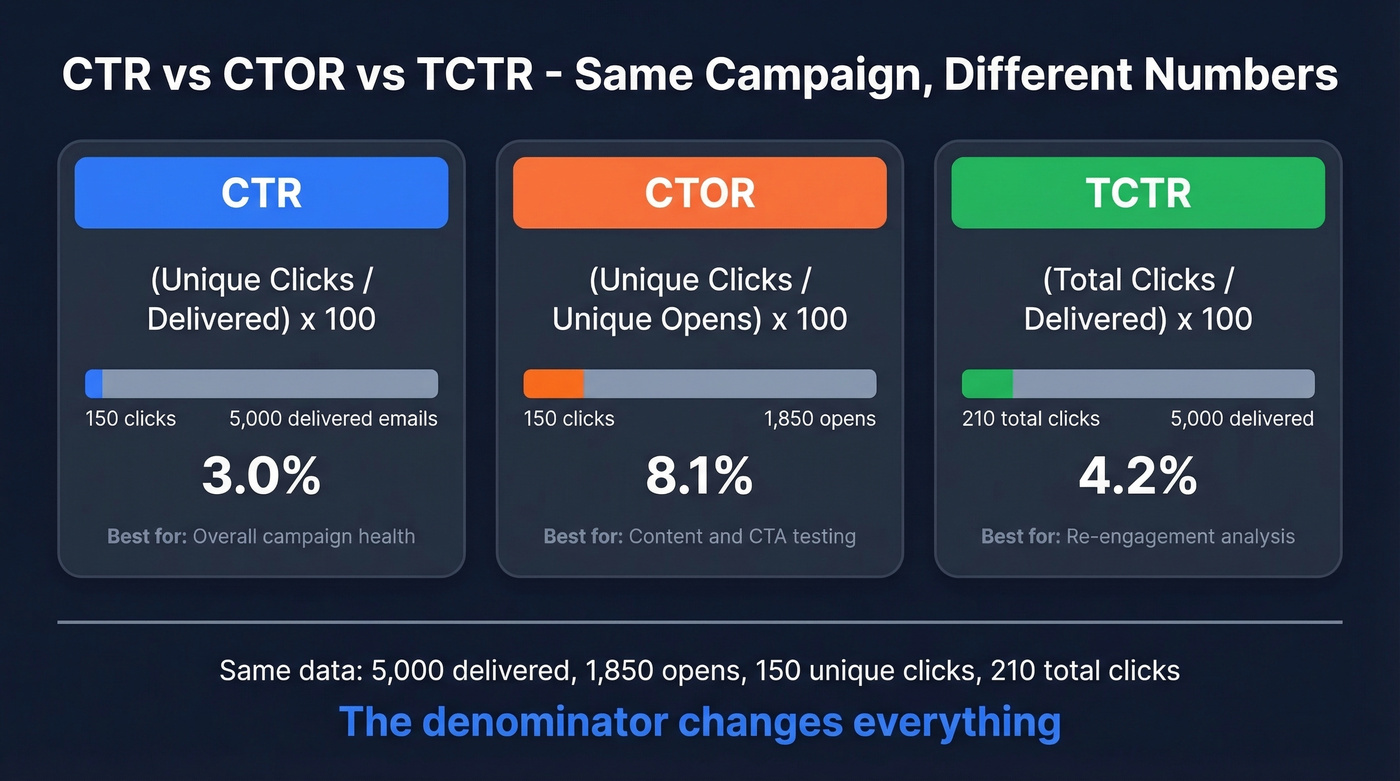
Same campaign: 5,000 delivered, 1,850 unique opens, 150 unique clicks, 210 total clicks.
| Metric | Formula | Result | When to use |
|---|---|---|---|
| CTR | Unique clicks / Delivered x 100 | 3.0% | Overall campaign health |
| CTOR | Unique clicks / Unique opens x 100 | 8.1% | Content and CTA effectiveness |
| TCTR | Total clicks / Delivered x 100 | 4.2% | Re-engagement analysis |
CTR tells you how your entire send performed. CTOR tells you how well your content converted people who actually opened. TCTR captures repeat engagement - useful if you're measuring link interest across multiple CTAs.
The gap between CTR and CTOR is real and significant. HubSpot reports an all-industries average CTR of 2.3% versus a CTOR of 5.3%. Same campaigns, same data - the denominator changes everything. Klipfolio's own worked example dramatizes this perfectly: the same campaign produces 0.334% with a traditional denominator and 25.2% with an opens-based denominator. That's not a rounding error. It's a 75x difference.
Which metric matters for A/B tests? If you're testing subject lines, compare CTR - you need to see the impact on the full funnel from inbox to click. If you're testing CTA copy or button placement, compare CTOR - everyone in the comparison group already opened, so you're isolating content performance. For more ideas on what to test, pull from these subject lines and email copywriting patterns.
Why the Internet Gets This Wrong
Even the platforms defining these metrics can't keep their own definitions straight.
Mailchimp has a page titled "Click Rate vs Click-Through Rate" that opens by saying the two are "technically the same metric." It then describes click rate in a way that conflates actions and muddies the difference between CTR and CTOR. On a separate page about CTOR, the formula reads: "divide the number of emails opened by the number of successful email clicks and multiply by 100." That's backwards. CTOR is clicks divided by opens, not opens divided by clicks. If you followed that published formula, you'd get a number that means nothing.
Klipfolio published a piece arguing that traditional CTR is "wrong" because it includes non-openers in the denominator. What they call "true CTR" is just CTOR by another name.
Here's the thing: when billion-dollar platforms publish reversed formulas, it's no wonder your team can't agree on what CTR means. The email CTR calculation itself is simple. The chaos comes from inconsistent definitions.
Bad data doesn't just kill deliverability - it wrecks every metric downstream, including CTR. When 35% of your emails bounce, your denominator is a lie. Prospeo's 98% email accuracy and under-4% bounce rates mean your click through rate formula finally measures real engagement, not noise.
Stop calculating CTR on emails that never arrived.
What Your ESP Actually Measures
Your ESP probably already made this decision for you.
| ESP | Default metric label | Denominator | Unique or total? |
|---|---|---|---|
| Klaviyo | Click rate | Delivered | Unique |
| ActiveCampaign | CTR | Delivered | Varies by report |
| Mailchimp | Click rate | Delivered | Varies by report |
| HubSpot | CTR | Delivered | Varies by report |
[Klaviyo's documentation] explicitly confirms that campaign dashboard numbers are based on unique people, not total events. Most ESPs follow the same general pattern. The practical rule: if your dashboard says "click rate" or "CTR" without further qualification, it's usually clicks divided by delivered. If it says "CTOR" or "click-to-open rate," it's clicks divided by opens.
If you're seeing weird gaps between sent and delivered, start with email bounce rate and then work through a full email deliverability guide.
Industry Benchmarks for 2026
Numbers mean nothing without context. Here's where the industry sits, drawn from the two largest published datasets. The average email click rate has shifted over the past few years - 2020 averages hovered around 2.6% across industries, and 2022 data showed similar ranges before Apple MPP muddied open-rate comparisons.
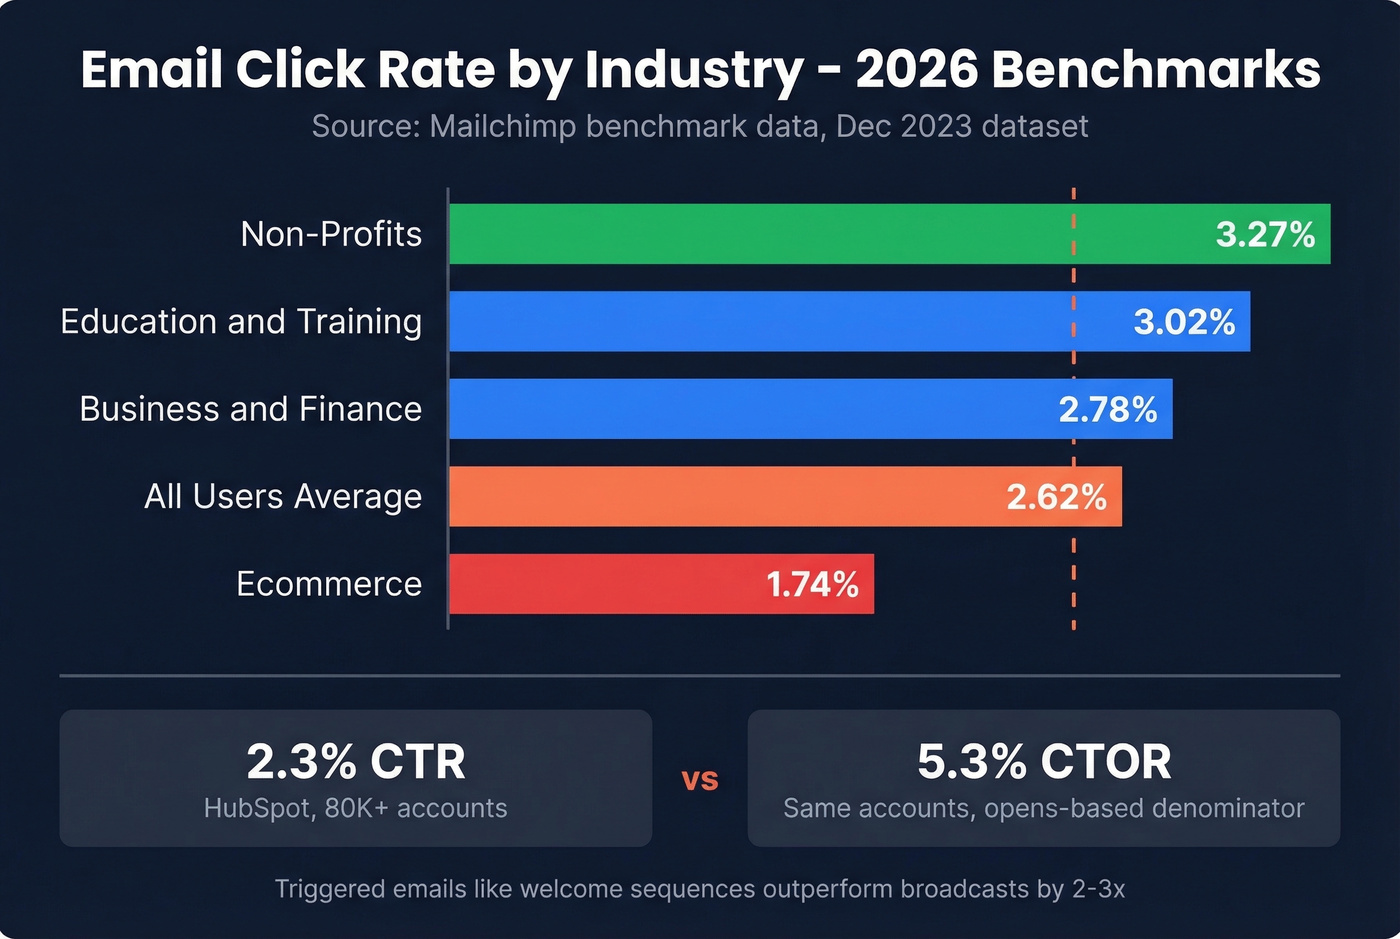
Source: Mailchimp benchmark data, Dec 2023 - the most recent published dataset. Directionally reliable, though expect slight shifts year over year.
| Industry | Click Rate |
|---|---|
| All Users | 2.62% |
| Ecommerce | 1.74% |
| Business + Finance | 2.78% |
| Education + Training | 3.02% |
| Non-Profits | 3.27% |
| All Industries (HubSpot, 80K+ accounts) | 2.3% CTR / 5.3% CTOR |
Both datasets are directionally reliable, though triggered emails like welcome sequences and cart abandonment flows consistently outperform broadcasts by 2-3x. If you're comparing your triggered sequence CTR against these broadcast-heavy benchmarks, you're comparing apples to oranges.
Hot take: If your CTR is above 4% on a broadcast campaign, don't celebrate - investigate. In our experience, numbers that good on cold or broad sends almost always mean bot clicks are padding your metrics, not that your copy is exceptional. If you're doing outbound, align your expectations with cold email marketing benchmarks.
Why Your CTR Might Be Wrong
Even with the right formula, your number can still be off. Three common culprits.
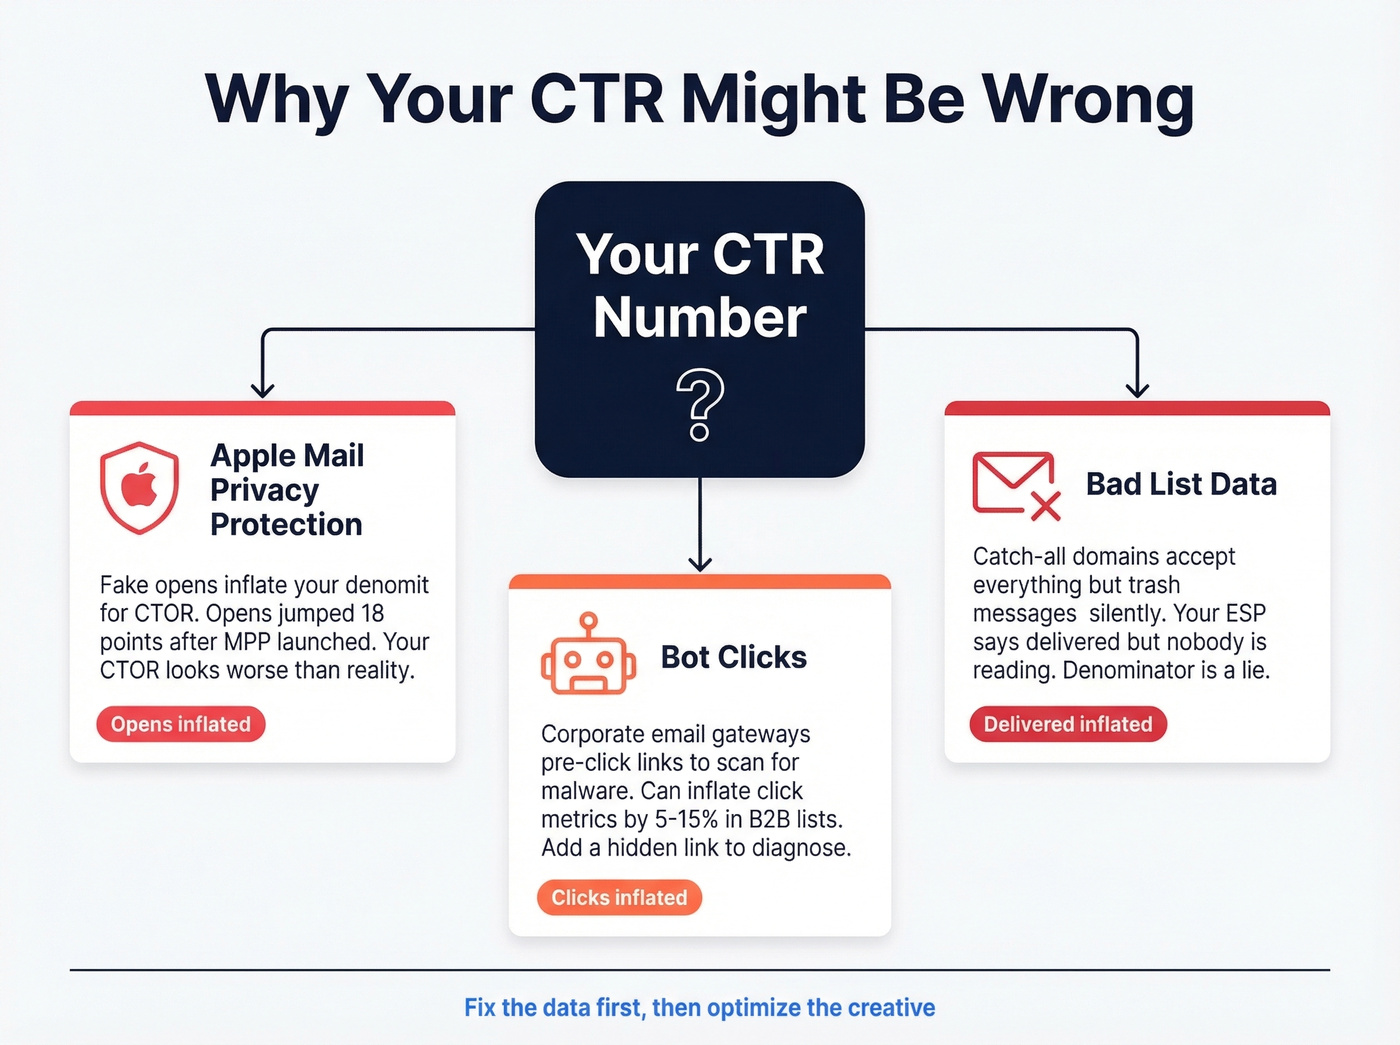
Apple Mail Privacy Protection is inflating your opens
Open rates jumped 18 points after Apple MPP launched across a study of 80,000+ accounts. Since CTOR uses opens as the denominator, inflated opens make your CTOR look worse than reality. If a large chunk of your audience uses Apple Mail, lean on CTR instead.
Bot clicks are inflating your CTR
In B2B environments, corporate email gateways pre-click links to scan for malware. We've seen this inflate click metrics by 5-15% in enterprise-heavy lists. If your CTR looks suspiciously high for a cold campaign, bots are the likely culprit. One quick diagnostic: add a hidden link that no human would click. If it gets clicks, you've got bots.
Bad list data is inflating your denominator
If a meaningful share of your "delivered" emails land in abandoned inboxes or catch-all domains that silently trash messages, your denominator is inflated and your real CTR is higher than your dashboard shows. Catch-all domains are the worst offenders - they accept everything at the server level but never route to an actual inbox. Your ESP marks them as "delivered" because the server didn't bounce, but nobody's reading. Prospeo's catch-all verification flags these domains before you send, keeping your denominator honest and your sender reputation intact. If you want a deeper technical checklist, see how to check if an email exists and how to check if email will bounce.
How to Improve Your Email CTR
Knowing the click through rate email formula is only useful if you're actively working to move the number.
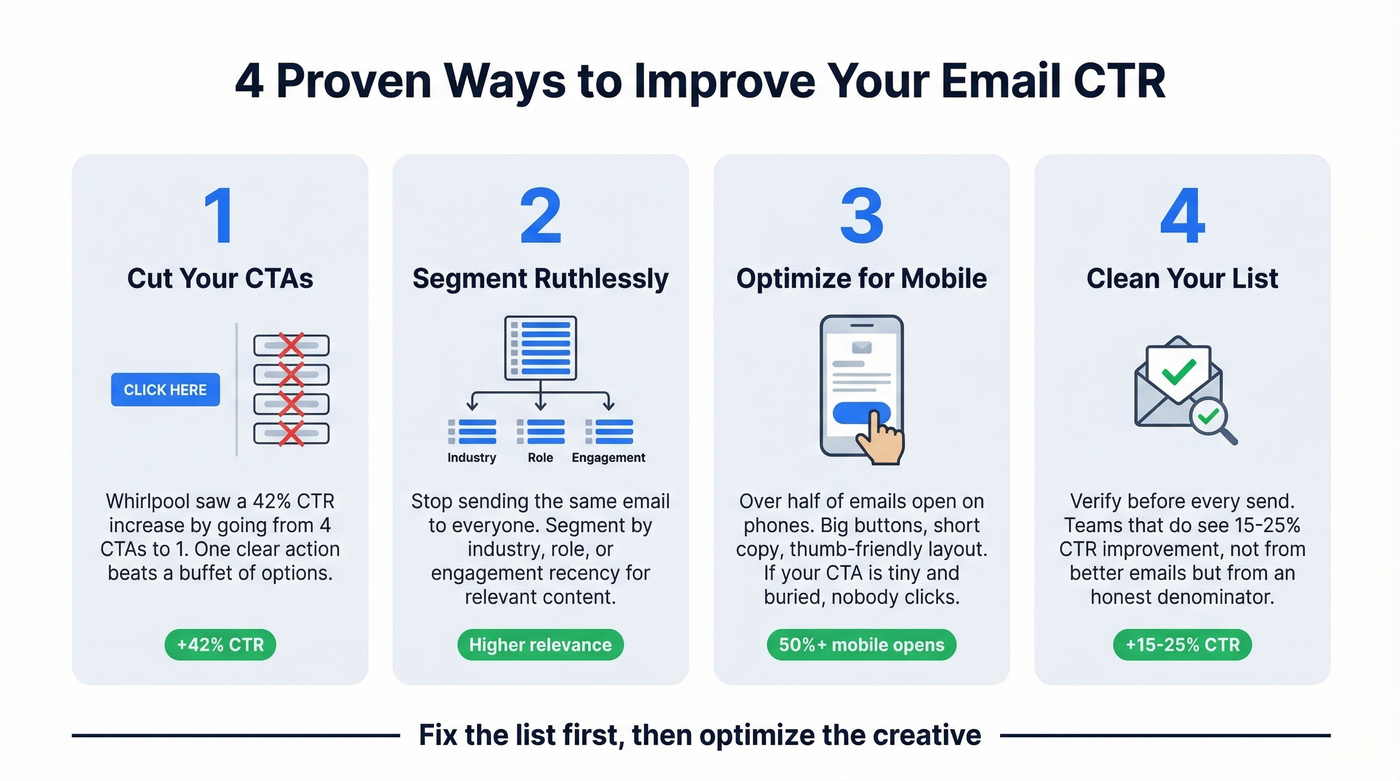
Cut your CTAs. Whirlpool increased their email CTR by 42% by reducing CTAs from four to one. Decision fatigue is real. One clear action beats a buffet of options every time. If you need patterns, borrow from proven email call to action examples.
Segment ruthlessly. Sending the same email to your entire list is the fastest way to tank CTR. Even basic segmentation - by industry, role, or engagement recency - lifts click rates because the content is actually relevant to the person reading it. For B2B teams, intent based segmentation is often the fastest win.
Optimize for mobile. Over half of emails open on phones. If your CTA button is 40px wide and buried below three paragraphs, mobile users won't click. Big buttons, short copy, thumb-friendly layout.
Clean your list before every send. This is the foundation everything else sits on. Teams that verify their list before every send see CTR improvements of 15-25% - not because the emails get better, but because the denominator finally tells the truth. Prospeo's 5-step verification process catches invalid addresses, spam traps, and honeypots before they pollute your metrics. If you're building lists at scale, pair that with a workflow for how to generate an email list.

Your CTR formula is only as good as the data feeding it. If you're sending to dead addresses, your "delivered" count is a lie and every metric downstream is wrong. Fix the list first, then optimize the creative.
You just learned that the denominator changes everything. The fastest way to fix your CTR? Shrink the gap between sent and delivered to near zero. Prospeo's 5-step verification and 7-day data refresh keep bounce rates under 4% - so your delivered count stays honest and your metrics stay clean.
Clean data in, accurate CTR out - starting at $0.01 per email.
FAQ
Is CTR the same as CTOR?
No. CTR divides unique clicks by delivered emails, measuring overall campaign engagement. CTOR divides unique clicks by unique opens, isolating content effectiveness among people who actually opened. They produce different numbers from the same campaign - often by a factor of 2-3x. Use CTR for full-funnel reporting and CTOR for A/B testing email body content.
Should I use sent or delivered in the denominator?
Always use delivered. "Sent" includes bounced emails that never reached anyone, which artificially deflates your rate. Delivered gives you an accurate denominator reflecting real recipients. Every major ESP defaults to delivered for this reason.
What's a good email CTR for B2B?
Most B2B industries average 2-3% CTR, with Business + Finance benchmarked at 2.78%. Triggered emails outperform broadcasts by 2-3x, and bot clicks can inflate B2B numbers by 5-15%. Benchmark against your own historical data first, then compare to industry averages.
How do I calculate email CTR manually?
Take unique clicks, divide by delivered emails, multiply by 100. For example: 150 unique clicks / 5,000 delivered x 100 = 3.0% CTR. Export campaign data into a spreadsheet to compare CTR, CTOR, and TCTR side by side without relying on whatever default your platform chose.
Can bad data skew my click through rate?
Yes - significantly. Catch-all domains and abandoned inboxes inflate your "delivered" count without adding real recipients, dragging down CTR artificially. Verifying your list before each send keeps the denominator honest so your metrics reflect actual engagement.