Close Rates: The Definitive 2026 Guide to Benchmarks, Measurement & Improvement
Your VP of Sales walks into the QBR and says close rates are at 12%. The board frowns. But half the denominator was unqualified junk that never should've been in the pipeline. Strip those out, and the real rate on qualified opportunities is 28%. That's a completely different story - and a completely different forecast.
Every "close rate benchmarks" article gives you the same unsourced "20-30%" range with zero context about ACV, lead source, or company size. That's not a benchmark. It's a guess. Let's fix that.
The Quick Version
The formula: Closed-won deals / total opportunities x 100.
What's "good"? It depends entirely on your ACV, industry, and how you define "opportunity." Software/SaaS opportunity-to-close ranges typically land around 15-22%. Proposal-stage win rates average 47% across 472 sellers surveyed by RAIN Group. Quoting a single number without that context is meaningless.
The three levers that actually move the number: Qualification rigor - tighten the denominator. Deal velocity - opportunities closed within 50 days win at more than double the rate of those that drag past it. And data quality - 70% of contact data goes stale annually, inflating your pipeline with ghosts.
What Is a Close Rate?
This metric measures the percentage of opportunities that convert to closed-won deals. Sometimes called the closure rate or closing ratio, it's the foundation of pipeline forecasting:
Close Rate = (Closed-Won Deals / Total Opportunities) x 100
If your team worked 50 opportunities last quarter and won 12, that's 24%. Simple math, but the complexity hides in what you count as an "opportunity."
Salesforce defines sales conversion rate as the percentage of potential customers who take a desired action - which overlaps with what many teams call their closing rate. The terminology is messy across CRMs and orgs. What matters isn't the label. It's that your entire team agrees on the denominator.
Close Rate vs. Win Rate
Most teams use these interchangeably. That's how bad forecasts happen.
The cleanest way to separate them:
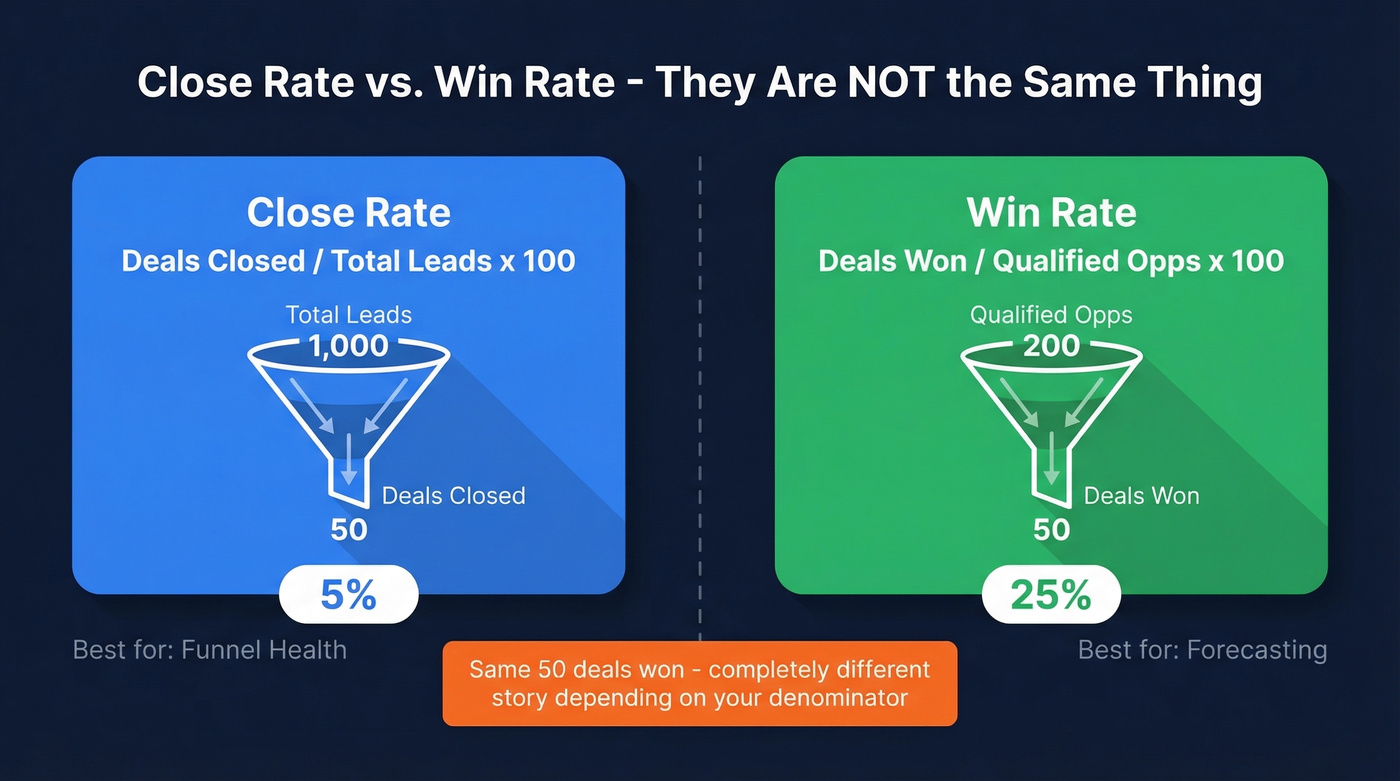
- Close rate: deals closed / total leads x 100
- Win rate: deals won / qualified opportunities x 100
Same numerator family, wildly different denominators. Your team closes 50 deals. If you started with 1,000 leads, that's a 5% closing rate. If only 200 of those leads became qualified opportunities, your win rate is 25%. Both numbers are "correct." They just measure different things.
| Metric | Numerator | Denominator | Best for |
|---|---|---|---|
| Close rate | Deals closed | Total leads | Funnel health |
| Win rate | Deals won | Qualified opps only | Forecasting |
The qualification framework you use shapes the denominator directly. BANT acts as a pipeline entry filter - it determines what becomes an opportunity in the first place. MEDDIC operates throughout the cycle, keeping qualification honest as deals progress. Teams using MEDDIC tend to report higher win rates not because they close better, but because they disqualify faster.
Here's the thing: the "No Decision" bucket distorts both metrics. If a prospect goes dark and you mark them closed-lost, you've artificially depressed your win rate. Leave them open indefinitely, and your pipeline looks healthier than it is. The fix is a separate "No Decision" or "Stalled" stage with a time-based auto-close rule - we've seen teams improve forecast accuracy meaningfully just by cleaning up this one stage.
2026 Sales Benchmarks by Industry
This is the section most articles get wrong. They give you one number and call it a benchmark. Real benchmarks require segmentation.
A note on methodology: the industry, company-size, lead-source, and ACV tables below use opportunity-count-based opportunity-to-close rates. The RAIN Group table later is proposal/quote-stage win rate, which is a different denominator. For revenue forecasting, a dollar-weighted close rate - won revenue divided by total pipeline value - is often more useful, since it prevents a cluster of small deals from masking a weak enterprise pipeline.
By Industry
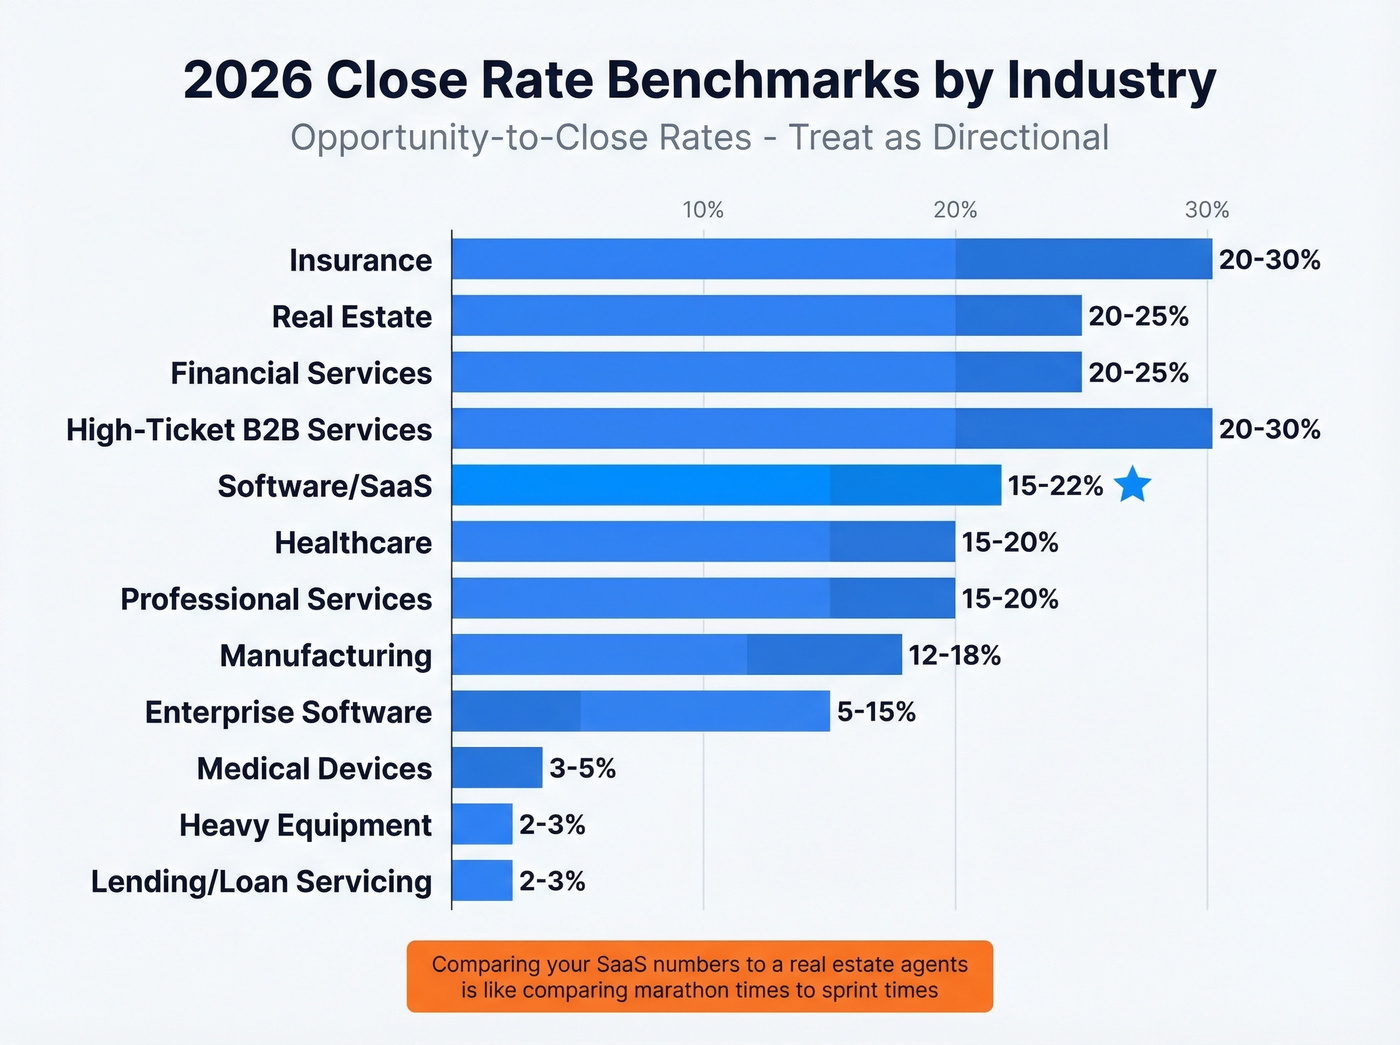
These ranges represent opportunity-to-close rates. Definitions vary by source, so treat them as directional rather than absolute.
| Industry | Close Rate Range |
|---|---|
| Insurance | 20-30% |
| Real estate | 20-25% |
| Financial services | 20-25% |
| High-ticket B2B services | 20-30% |
| Software/SaaS | 15-22% |
| Healthcare | 15-20% |
| Professional services | 15-20% |
| Manufacturing | 12-18% |
| Enterprise software | 5-15% |
| Medical devices | 3-5% |
| Heavy equipment | 2-3% |
| Lending/loan servicing | 2-3% |
The spread is enormous - and it makes sense. A heavy equipment sale involves multi-year procurement cycles, RFPs, and committee decisions. An insurance policy can close in a single call. Comparing your SaaS deal performance to a real estate agent's is like comparing marathon times to sprint times.
By Company Size
Smaller companies close faster and at higher rates. Fewer stakeholders, shorter procurement cycles, less legal review.
| Segment | Opp-to-Close Rate | Avg Cycle Length |
|---|---|---|
| SMB / Mid-market | 39% | 38-95 days |
| Enterprise | 31% | 135-185 days |
The cycle length gap is dramatic. Deals at companies with 1-10 employees average 38 days. At companies with 10,001+ employees, that stretches to 185 days. Every additional week in the cycle erodes win probability.
By Lead Source
Not all pipeline is created equal.
| Lead Source | Opp-to-Close Rate |
|---|---|
| Events | 40% |
| SEO | 38% |
| PPC | 35% |
| Webinars | 33% |
| 32% |
Events win because they involve face-to-face interaction and self-selection - the prospect walked up to your booth. SEO leads are high-intent by nature; they searched for a solution. PPC and email cast wider nets, which means more unqualified volume in the denominator. If your team relies heavily on outbound email, data quality becomes the bottleneck - you can't close someone you can't reach.
By ACV Band
This is where the contrarian take lives. A 15% closing rate on $200k enterprise deals generates far more revenue than a 40% rate on $5k SMB deals. Context matters more than the number.
| ACV Band | Expected Close Rate |
|---|---|
| $100k+ | 15-20% |
| $50k-$100k | 20-25% |
| Warm / relationship-led | 30-40% |
Cycle lengths scale with ACV too - $100k-$250k deals average 170 days, while $500k+ deals stretch to 270 days.
One stat that reinforces the "warm pipeline" advantage: deals involving a known contact close at 37% versus 19% for cold outreach, per Champify's 2025 Impact Report. If your team isn't systematically tracking job changes and past-customer movements, you're leaving the easiest pipeline on the table.
By Performance Tier
RAIN Group surveyed 472 sellers and sales executives and found the average win rate at proposal stage is 47%. But the distribution is what matters.
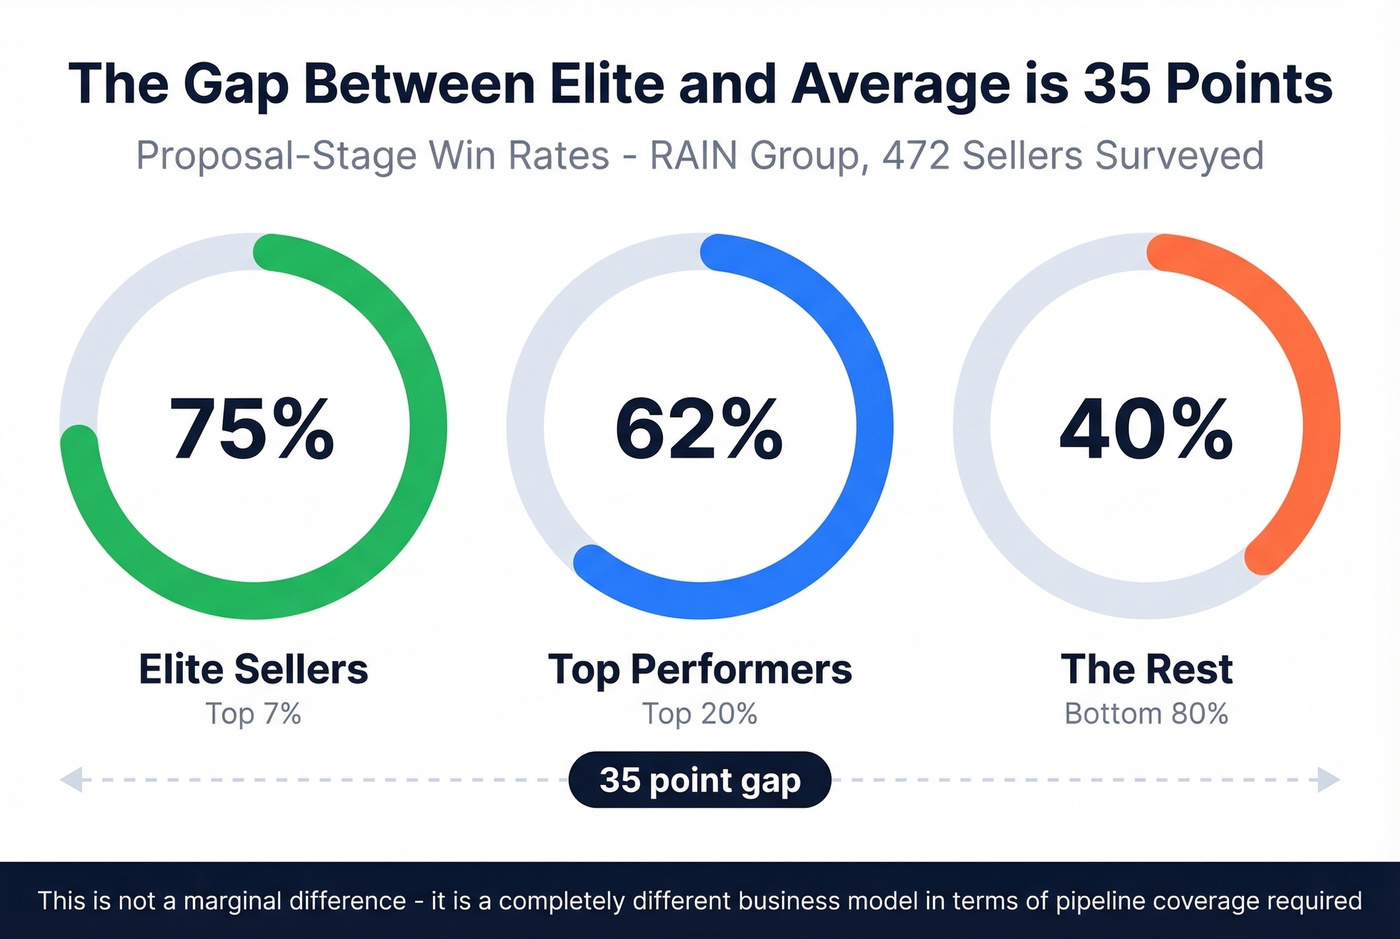
| Performance Tier | Win Rate |
|---|---|
| Elite (top 7%) | ~75% |
| Top performers (top 20%) | 62% |
| The rest (bottom 80%) | 40% |
These are proposal-stage rates - meaning the prospect already received a quote or proposal. This isn't lead-to-close. The gap between elite and average is 35 percentage points. That's not a marginal difference; it's a completely different business model in terms of pipeline coverage required.
Your close rate denominator is only as good as your data. 70% of contact data decays annually - inflating pipelines with ghosts that drag down your numbers. Prospeo's 98% email accuracy and 7-day refresh cycle mean every opportunity in your CRM connects to a real, reachable buyer.
Stop forecasting on dead data. Start closing on verified contacts.
What Actually Drives Closing Performance
Four variables explain most of the variance across teams.
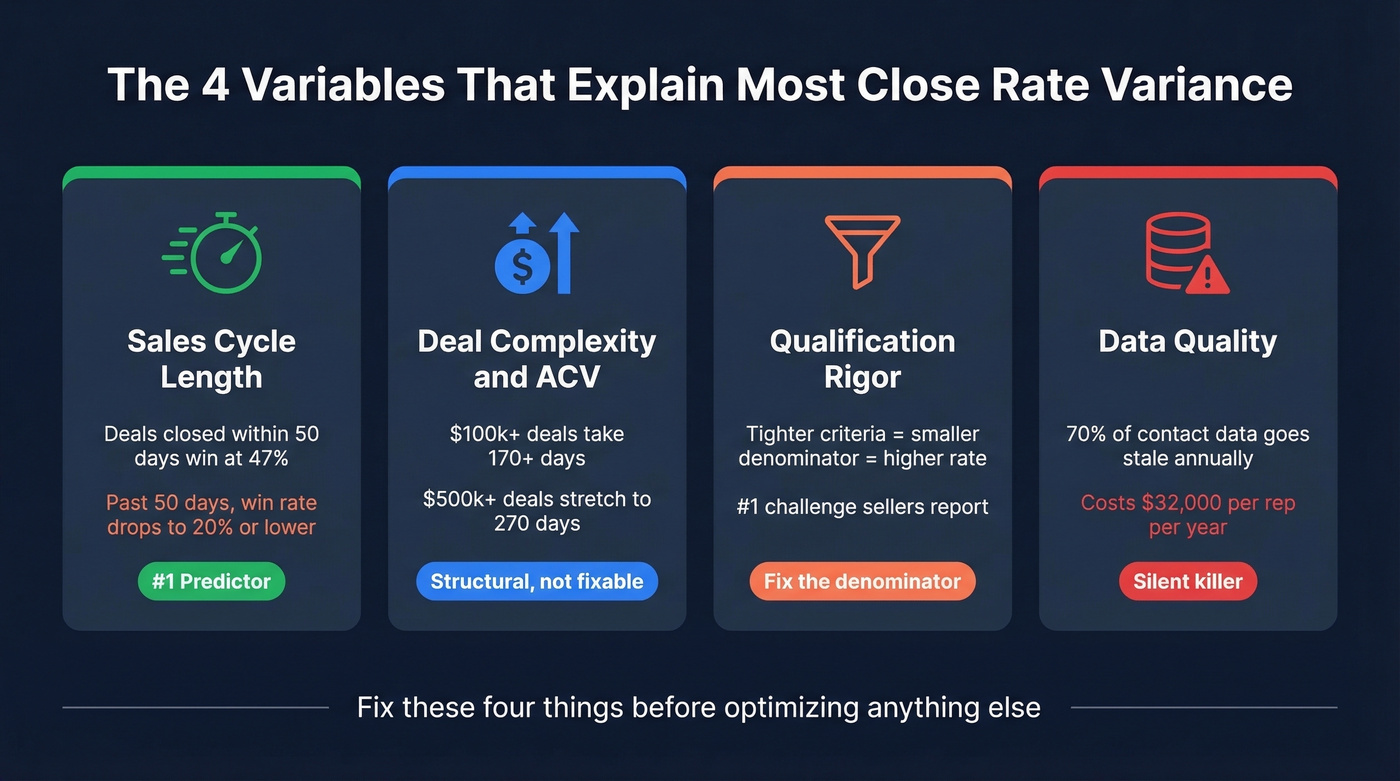
1. Sales cycle length. Outreach's 2025 platform data shows opportunities closed within 50 days have a 47% win rate. Past that threshold, win rates drop to 20% or lower. Speed isn't a nice-to-have - it's the single strongest predictor of whether a deal closes.
2. Deal complexity and ACV. Higher-value deals involve more stakeholders, longer legal reviews, and more competitive bake-offs. Enterprise cycles can stretch 12-18 months. The inverse relationship between ACV and closing performance is structural, not fixable.
3. Qualification rigor. Tighter qualification criteria shrink the denominator, which mathematically raises your sales closing rate. But more importantly, they focus rep time on winnable deals. Lead qualification is now the #1 challenge sellers report, per Outreach's survey data. Teams that switch from a loose "any meeting booked" definition to a truly qualified pipeline definition see improvement fast because bad opportunities stop polluting the denominator.
4. Data quality. This is the variable most teams overlook. 70% of contact data goes stale annually. Bad data costs an estimated $32,000 per sales rep per year in wasted effort - chasing wrong numbers, bounced emails, and contacts who left the company six months ago. Every dead contact sitting in your pipeline inflates the denominator with unreachable "opportunities."

In our experience, data decay is the silent close-rate killer. We've watched teams "improve" their closing rate by 8-10 points just by purging stale records and verifying contact data before launching sequences. Prospeo's 7-day refresh cycle and 98% email accuracy exist specifically for this problem - when your pipeline data is live, your metrics reflect actual deal performance rather than data rot.
How to Improve Close Rates
Fix the foundation first (tactics 1-3), then optimize execution (4-7).
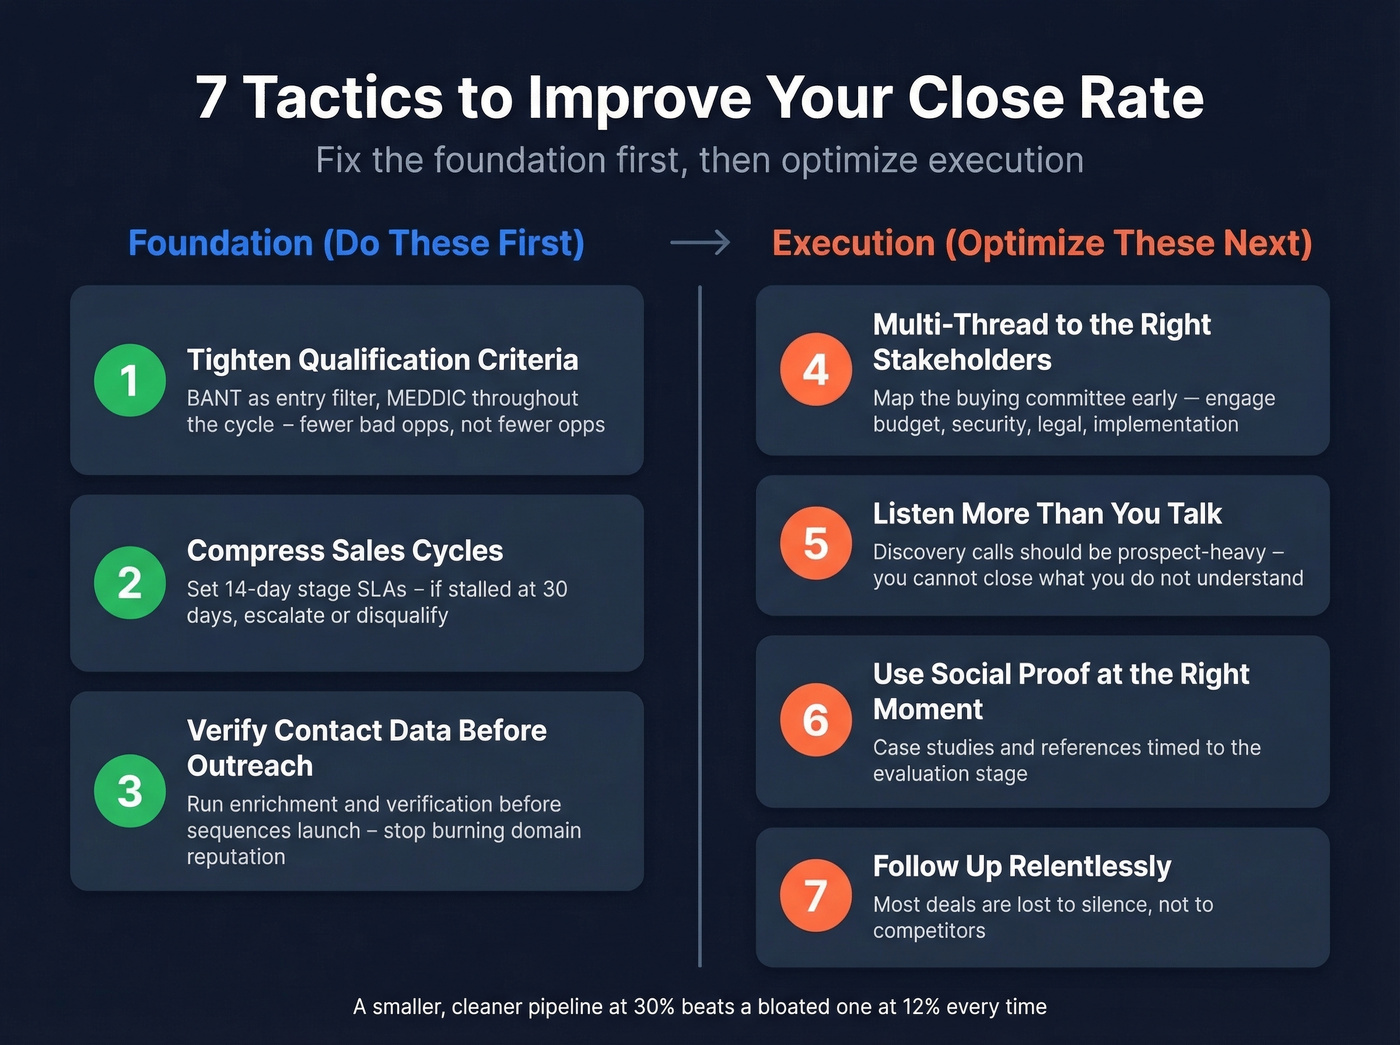
1. Tighten qualification criteria. Implement BANT as a minimum pipeline entry filter. Better yet, layer MEDDIC throughout the cycle. The goal isn't fewer opportunities - it's fewer bad opportunities. A smaller, cleaner pipeline with a 30% win rate beats a bloated one at 12% every time.
2. Compress sales cycles. That 50-day velocity threshold isn't arbitrary. Set internal SLAs for stage progression. If a deal hasn't moved stages in 14 days, it gets a mandatory review. If it stalls at 30 days, escalate or disqualify. Deals don't age like wine.
3. Verify contact data before outreach. If 70% of your CRM data decays annually, a meaningful chunk of your "pipeline" is unreachable. Run enrichment and verification before sequences launch - bulk verification tools handle this in minutes. Upload a CSV, get verified results back, and stop burning domain reputation on bounced emails. (If you’re evaluating vendors, start with data enrichment and email verification alternatives.)
4. Multi-thread to the right stakeholders. One of the most common mistakes is speaking to the wrong stakeholders entirely. If you're single-threaded to a champion who can't sign, you're building a house on sand. Map the buying committee early and engage the people who influence budget, security, legal, and implementation.
5. Listen more than you talk. The talk-to-listen ratio is a real metric, and most reps get it backwards. Discovery calls should be prospect-heavy. You can't close a deal you don't understand, and you can't understand a deal you're narrating over. Record your next five calls and measure the ratio - the number will probably surprise you. Use a tighter discovery questions bank to keep calls buyer-led.
6. Prepare for objections before they surface. Don't wait for "it's too expensive" to figure out your pricing defense. Build an objection matrix for your top 5 objections and rehearse responses until they're reflexive. The best closers handle objections before the prospect raises them - weaving answers into the demo narrative so the objection never gets voiced. If objections are a recurring pattern, run a focused sales process optimization sprint.
7. Use social selling. Reps with a strong professional presence report ~45% more sales opportunities, and 78% of salespeople say social selling is critical per LinkedIn's State of Sales Report. This isn't about posting thought leadership for vanity metrics - it's about warming up prospects before the first call so you're not starting cold. Pair it with account-based selling to keep outreach targeted.
Mistakes That Kill Closing Performance
Counting disqualified leads as closed-lost. In a recent r/sales thread, a B2C team with a 5% rate discovered their number was tanked because disqualified leads were counted as closed-lost. If a lead was never qualified, marking it closed-lost artificially destroys your metric and makes forecasting useless. Create a separate "Disqualified" disposition. Only leads that entered qualified pipeline should count in your denominator.
Using a single unsegmented number for forecasting. Your enterprise closing rate and your SMB closing rate are different numbers. Your inbound rate and your outbound rate are different numbers. Blending them into one metric is like averaging the temperature in Phoenix and Anchorage and calling it "the weather." Segment by ACV band, lead source, and sales motion. Forecast each segment independently using pipeline health checks.
Ignoring CRM hygiene. 44% of companies lose more than 10% of annual revenue due to inaccurate CRM data. Duplicate records, outdated contacts, and missing fields don't just annoy RevOps - they corrupt every metric downstream. Schedule quarterly CRM audits. Automate enrichment on record creation. Enforce required fields at stage transitions. If you need a baseline, start with contact management software.
Measuring without defining the denominator across the team. If one AE counts from first meeting and another counts from proposal sent, you're comparing apples to aircraft carriers. Document the denominator definition in your sales playbook. Review it during onboarding. Audit it quarterly. This is also where sales operations metrics help keep definitions consistent.
What Should You Model?
For financial modeling and capacity planning, use these ranges as starting points:
| Segment | Model Close Rate |
|---|---|
| Enterprise ($100k+ ACV) | 15-20% |
| Mid-market ($50k-$100k) | 20-25% |
| SMB / warm pipeline | 30-40% |
Your closing rate directly determines your pipeline coverage requirement. At 20%, you need 5x pipeline to hit quota. At 33%, you need 3x. If your team is building 4x coverage and closing at 15%, the math doesn't work - and no amount of coaching fixes a coverage gap. This is the number your CFO actually cares about. (If you’re tightening the model, compare against sales pipeline benchmarks and your sales conversion rate.)
The macro environment adds pressure. 84% of reps missed quota last year. Buyers now spend just 17% of their buying time meeting suppliers. 80% of B2B sales interactions happen through digital channels, and buyers use roughly 10 interaction channels on average, up from 5 in 2016. The buying process is more fragmented, more self-directed, and harder to influence than it's ever been.
Let's be honest about something most sales leaders won't say out loud: stop obsessing over close rates as a single number. A 15% rate on $200k enterprise deals with a 170-day cycle generates more revenue per rep than a 40% rate on $5k deals closing in 25 days. If your average deal size sits below $10k, you probably don't need a sophisticated optimization program - you need more at-bats. The number only means something in context: your ACV, your cycle length, your lead source mix, and your qualification bar. Model accordingly, and benchmark against yourself quarter over quarter rather than against generic industry averages.
Deals with known contacts close at 37% vs 19% for cold outreach. Prospeo tracks job changes across 300M+ profiles so you can re-engage past champions the moment they land at new companies - turning your warmest pipeline into your highest-converting pipeline.
Your best close rates come from contacts you already know. Find where they went.
FAQ
What is a good close rate?
For Software/SaaS, opportunity-to-close benchmarks sit around 15-22%. Proposal-stage win rates average 47% across 472 sellers surveyed by RAIN Group, and enterprise deals over $100k typically close at 15-20%. Segment your data by ACV, lead source, and sales motion before benchmarking - a single blended number is almost always misleading.
How do you calculate close rate?
Divide closed-won deals by total opportunities, then multiply by 100. The critical decision is what counts as an "opportunity" - all leads, MQLs, or sales-qualified pipeline only. That denominator choice changes the resulting number dramatically, so define it clearly and enforce it consistently across your team.
What's the difference between close rate and win rate?
Close rate typically measures deals closed divided by total leads, while win rate uses only qualified opportunities as the denominator. A team might show a 5% close rate from 1,000 leads but a 25% win rate from 200 qualified opportunities - same wins, completely different story depending on which metric you report.
Why is my close rate so low?
The three most common causes are an inflated denominator (counting unqualified leads as opportunities), long sales cycles (deals past 50 days close at half the rate), and stale data forcing reps to chase contacts who've changed jobs. Fix qualification first - it has the fastest impact. Then verify your contact data so reps reach real people instead of ghosts.
How does data quality affect closing performance?
Stale contact data wastes rep time and inflates your pipeline with unreachable prospects - companies lose an estimated $32k per rep per year to bad data. Verifying emails and refreshing databases weekly ensures reps work live contacts instead of chasing bounced emails and outdated phone numbers, so your metrics reflect actual selling performance rather than data decay.