Closing Ratio: 2026 Benchmarks, Formula & How to Improve
Only 16% of reps hit quota last year. Buying committees have ballooned to 25 stakeholders - up from 16 in 2017 - and the average sales cycle now drags on for 6.5 months. Your closing ratio is the clearest signal of whether your sales motion is working or bleeding out. Most teams measure it wrong, benchmark against the wrong numbers, and then wonder why nothing improves.
The Short Version
- The average close rate across industries is ~20%. Yours might be higher or lower - that's fine, as long as you know why.
- Your number is meaningless without defining the denominator. Leads? Qualified opportunities? Proposals sent? Pick one and stick with it.
- The single highest-leverage improvement: multi-thread every deal over $50K. Analysis of 1.8M opportunities shows a 130% lift in win rates.
- Stop tracking one blended number. Segment by lead source, deal size, and funnel stage.
What Is a Closing Ratio?
A closing ratio measures how many of your opportunities turn into closed-won deals. It's the simplest diagnostic in sales - and the one most teams overcomplicate. Whether you call it a close rate or a sales conversion metric, the concept is the same: it quantifies your team's ability to convert pipeline into revenue.
The formula:
Closing Ratio = (Closed Deals / Total Opportunities) x 100
If your team worked 40 opportunities last quarter and closed 8, your rate is 20%. The tricky part is deciding what counts as an "opportunity" in that denominator. A raw inbound form fill? A qualified opportunity? A proposal recipient? The answer changes your number dramatically.
Close Rate vs. Win Rate vs. Conversion Rate
These three get used interchangeably, and that's where teams get into trouble.
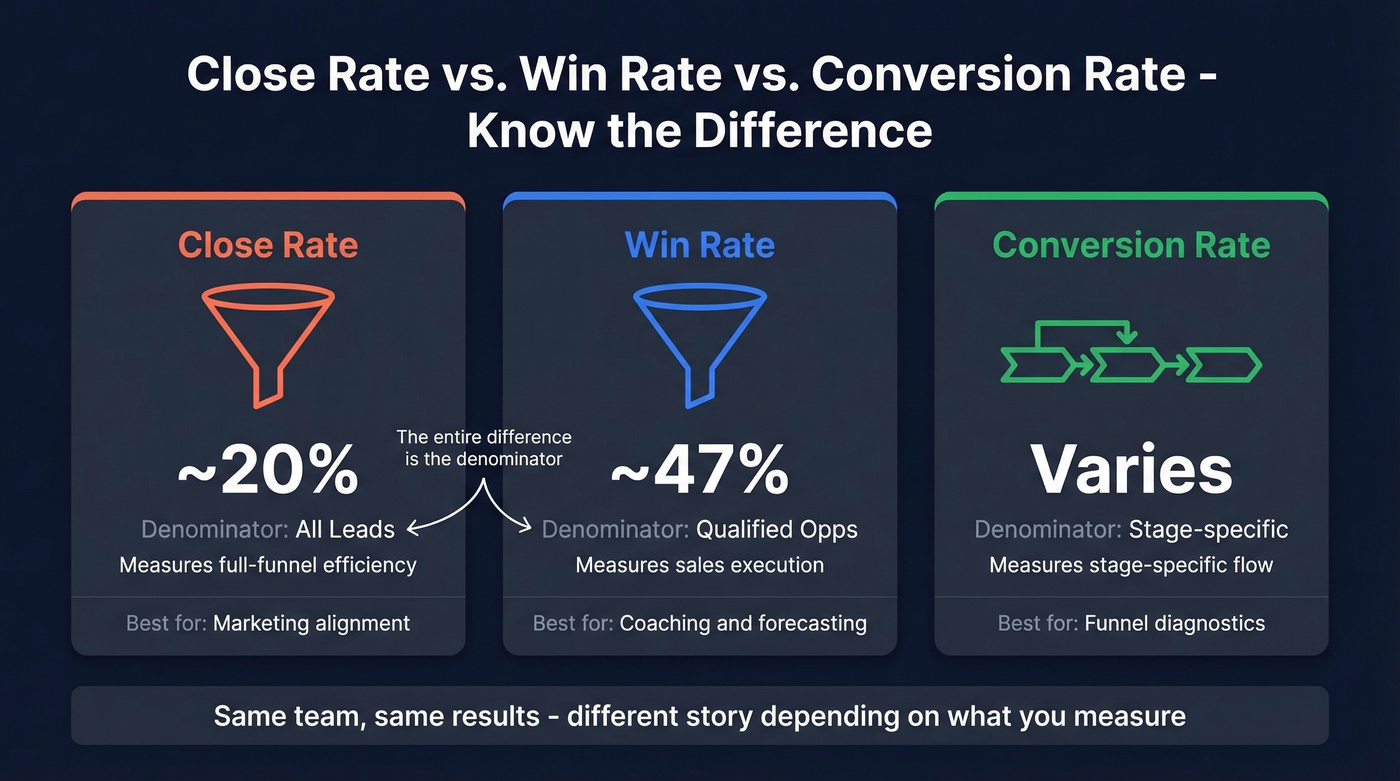
| Metric | Denominator | What It Measures | Typical Range | When to Use |
|---|---|---|---|---|
| Close rate | All leads | Full-funnel efficiency | 15-25% | Marketing alignment |
| Win rate | Qualified opps | Sales execution | ~40-60% | Coaching, forecasting |
| Conversion rate | Varies by stage | Stage-specific flow | Varies | Funnel diagnostics |
The RAIN Group benchmark puts average win rate at 47% across 472 sellers - more than double the ~20% average close rate. The entire difference is the denominator. Win rate excludes all the unqualified leads that never had a real shot. For enterprise SaaS specifically, expect conversion ratios of 20-30% and win ratios of 30-40%.
Ask any sales leader what their close rate is, and you'll get a different denominator every time. That's the real problem. A value-weighted conversion ratio - total revenue closed divided by total pipeline value - often tells a better story. If you're closing 30% of deals but they represent only 15% of pipeline value, your big deals are leaking.
2026 Industry Benchmarks
By Industry
The HubSpot survey of 1,000+ sales professionals remains the most widely cited benchmark set, with Dialpad publishing a similar set of industry-level data:
| Industry | Typical Close Rate |
|---|---|
| Biotech | 15% |
| Finance | 19% |
| Software | 22% |
| Computers & Electronics | 23% |
| Business & Industrial | 27% |
The overall average sits around 20%. Of the sales pros surveyed, 53% said their close rates were stagnant year-over-year. If yours is flat, you're in the majority - but that doesn't mean you should accept it.
By Lead Source and Deal Size
In our experience, teams that segment by lead source see the problem immediately. One widely cited benchmark set puts inbound lead conversion around 14.6%, while outbound sits closer to 1.7%. That's roughly a 9x gap, and it's why blending them into one number is useless.
If you want a clean way to operationalize this, start with an ideal customer profile and a consistent lead scoring model so "inbound" and "outbound" are comparable cohorts.
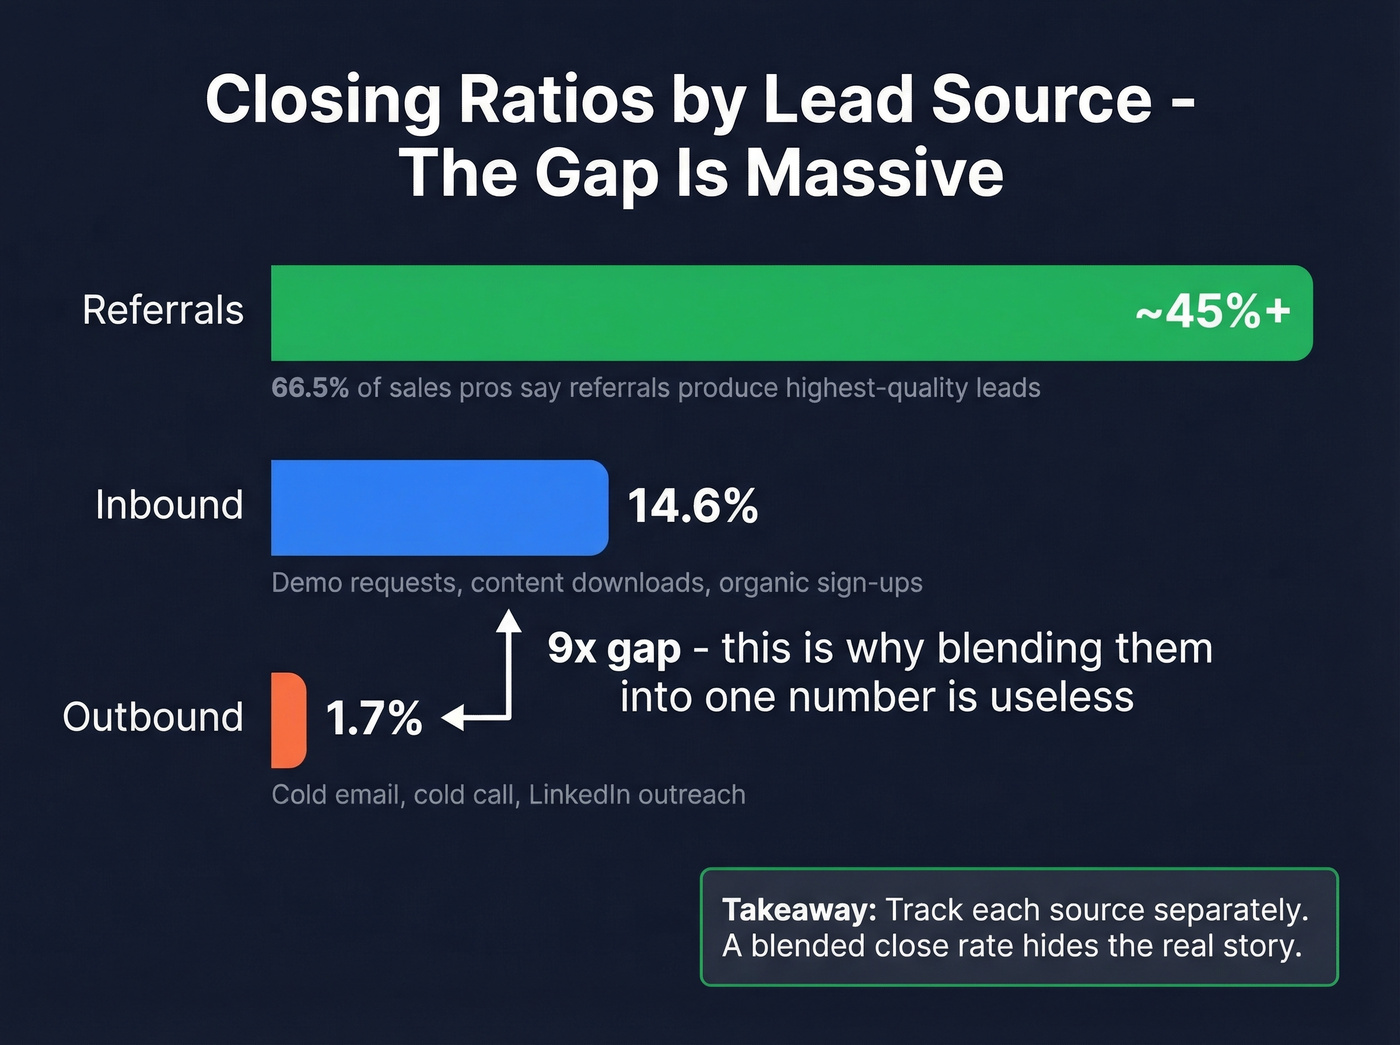
Referrals blow both out of the water. 66.5% of sales professionals say referrals produce their highest-quality leads, and the conversion rates reflect it.
Deal size matters too. SMB deals under $10K close at higher rates - shorter cycles, fewer stakeholders, faster decisions. Once you cross the $50K threshold, close rates drop but contract values climb. Enterprise deals above $100K can dip into single-digit percentages, but a single win justifies the pipeline investment.
Multi-threading boosts win rates 130%, but only if you can actually reach the buying committee. Prospeo gives you verified emails and direct dials for every stakeholder - 300M+ profiles, 125M+ mobiles, 98% email accuracy. Stop single-threading because you can't find the CFO's contact info.
Map the full buying committee in minutes, not weeks.
How to Calculate Yours Correctly
The formula itself is straightforward - closed deals divided by total opportunities, times 100. The hard part is defining what goes in the denominator.
Here's a common trap: a team engages 50 prospective clients, 10 drop out before discovery, and 20 eventually close. Calculate against all 50 and your rate is 40%. Quietly exclude those 10 early dropouts and suddenly it's 50%. Same team, same results, different story. Define your denominator once, document it, and never let anyone cherry-pick it for a board deck.
Stage-by-Stage Funnel Analysis
A single blended number hides where the real problem is (and why funnel metrics matter):
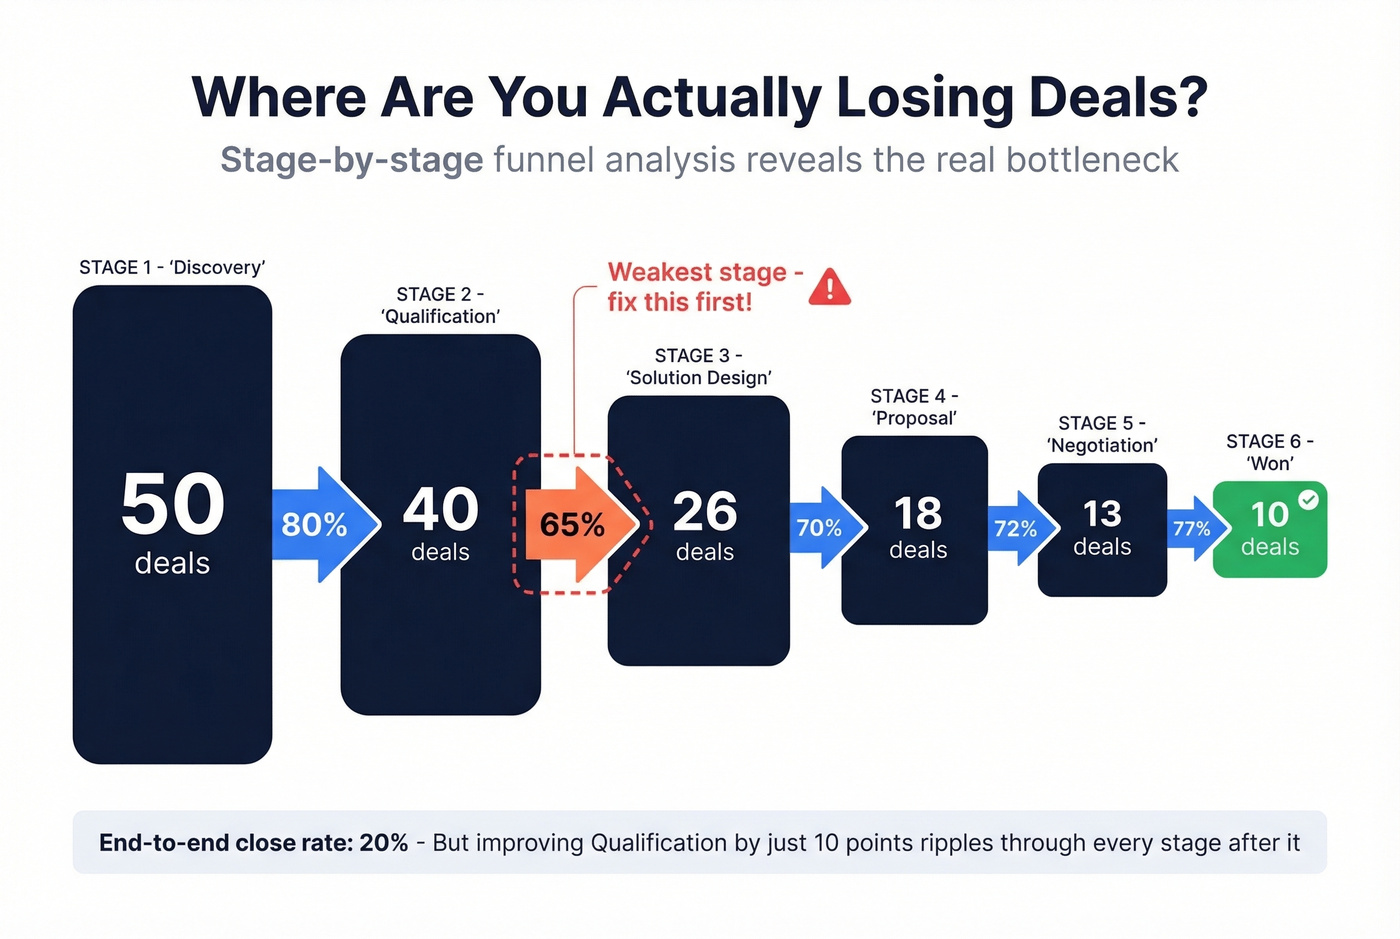
| Stage | Deals Entering | Conversion % | Deals Advancing |
|---|---|---|---|
| Discovery | 50 | 80% | 40 |
| Qualification | 40 | 65% | 26 |
| Solution Design | 26 | 70% | 18 |
| Proposal | 18 | 72% | 13 |
| Negotiation | 13 | 77% | 10 |
| Won | 10 | - | 10 |
Your end-to-end close rate here is 20%. But the real insight is that Qualification is your weakest stage at 65%. Improving that single stage by 10 points would push 4 more deals into Solution Design and ripple through every subsequent stage. That's 10x more actionable than staring at a blended number.
How to Improve Your Closing Ratio
Multi-Thread Every Deal
Map the buying committee in week one. Not week three.
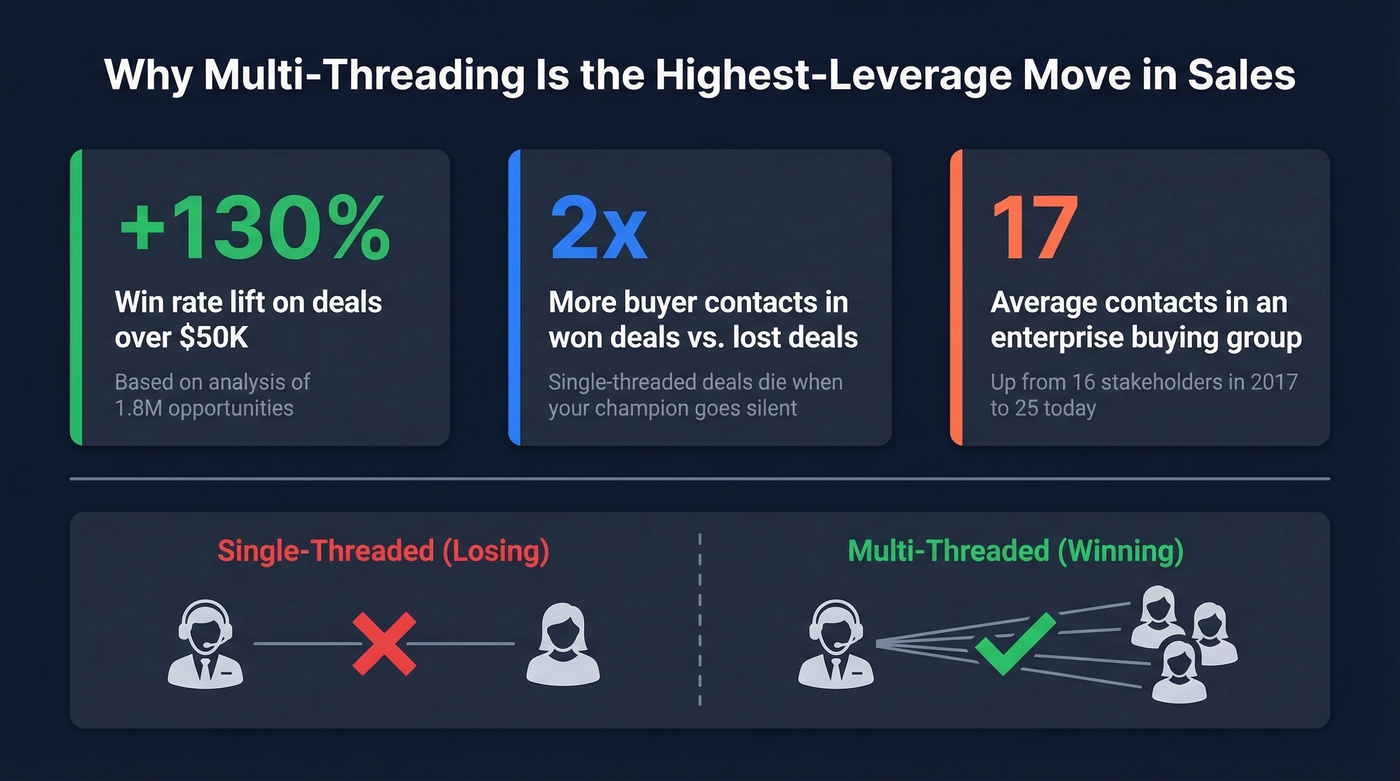
Analysis of 1.8M opportunities shows that multi-threading boosts win rates by 130% on deals over $50K. Won deals have roughly 2x more buyer contacts than lost deals, and strategic enterprise deals average 17 contacts in the buying group. If your reps are single-threaded on a large deal - talking to one champion and hoping for the best - they're leaving money on the table.
If you're selling six-figure deals, this is core enterprise B2B sales hygiene.
Bring in Sales Engineers Earlier
We've seen this pattern repeatedly: teams hold back their SEs until the "technical evaluation" stage, and by then the deal is already shaped by whatever the champion understood - or misunderstood - about the product. The data backs this up: bringing in a sales engineer on enterprise deals increases win rates up to 30%. Closed-won selling teams are 67% larger than closed-lost teams. Selling isn't a solo sport at the enterprise level.
Fix Top-of-Funnel Outreach
Here's the thing: most teams obsess over closing techniques when the real problem is what happens before the first meeting.
After analyzing 300M cold calls, researchers found that top-quartile callers book 3x more meetings than average peers. Even without a live connect, cold calling nearly doubles email reply rates - 3.44% vs. 1.81%. Leaving voicemails pushes email reply rates from 2.73% to 5.87%. Multi-channel outreach compounds in ways a standalone email sequence never will.
If you need a system (not random activity), start with these sales prospecting techniques and tighten your sales communication.
Reps already spend only 28-30% of their time actually selling. Wasting that time on phantom contacts makes it worse.
Clean Your Data First
If 20% of your emails bounce, those aren't real opportunities - they're noise in the denominator. Every invalid contact that enters your CRM inflates your pipeline count and drags your close rate down. You're not bad at closing. You're measuring against ghosts.
We've tested this with outbound teams, and the pipeline quality difference is night and day. One customer, Meritt, went from a 35% bounce rate to under 4% after implementing email verification with Prospeo, and their pipeline tripled from $100K to $300K per week.
If you want to quantify the damage, track your email bounce rate alongside pipeline creation.
Build a Referral Engine
If you're spending $40K/year on a data platform and $0 on a referral program, your priorities are backwards. Referrals convert at dramatically higher rates than any other source, yet most teams treat them as something that happens organically. Here's the playbook: ask every closed-won customer for two introductions within 30 days of signing. Track referral-sourced pipeline separately. You'll see the difference immediately.
Use AI as a Force Multiplier
Analysis of 7.1M opportunities found that sellers who frequently use AI generate 77% more revenue. Whether it's AI-assisted call prep, automated follow-up drafting, or real-time coaching during calls, AI-assisted selling is a legitimate lever in 2026. The consensus on r/sales is that AI won't replace reps, but reps who use AI will replace those who don't. If your team isn't experimenting here, you're falling behind.
A practical starting point is automating follow-ups with AI sales follow-up workflows.
Closing Ratio Examples
To make these benchmarks concrete, here are three scenarios showing how the same formula plays out differently depending on context:
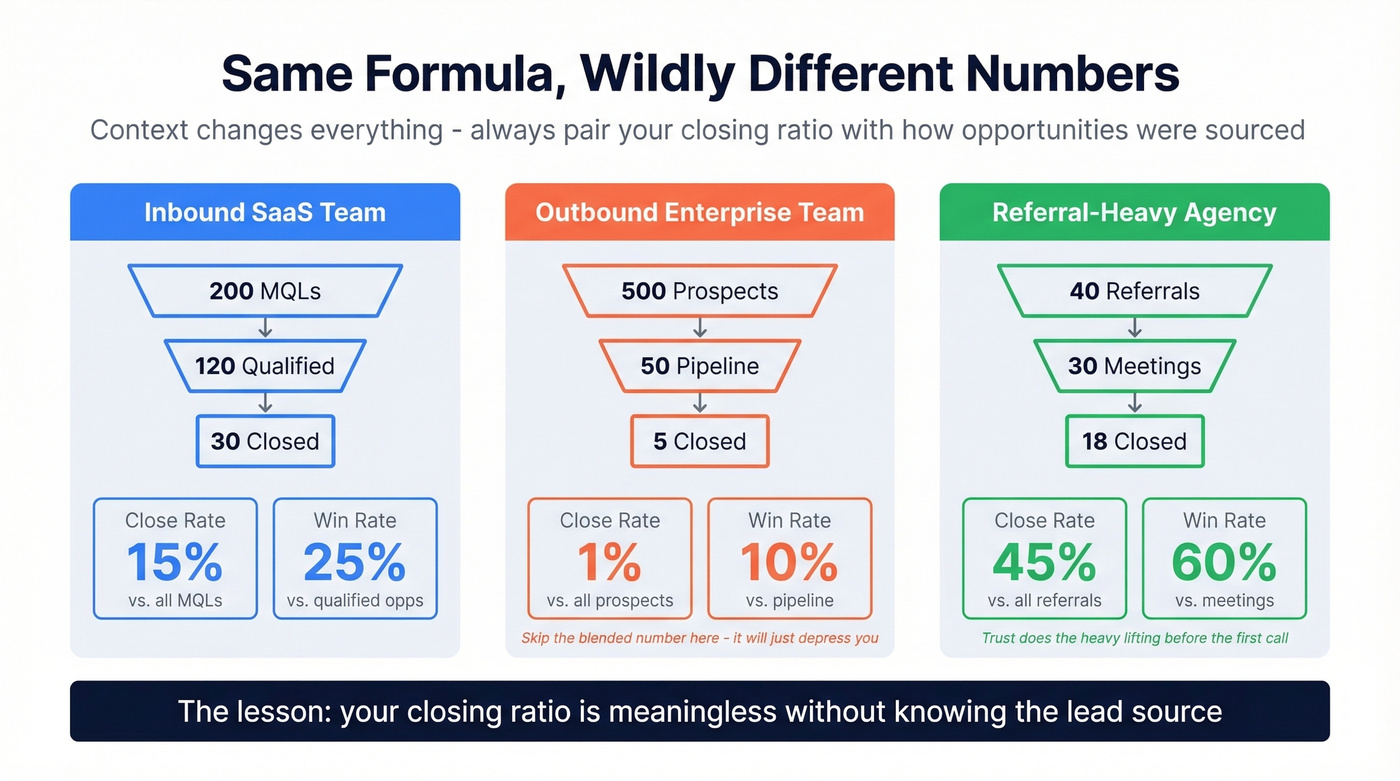
Inbound SaaS team: 200 MQLs enter the pipeline, 120 qualify, 30 close. The closing ratio against all MQLs is 15%; the win rate against qualified opps is 25%.
Outbound enterprise team: 500 prospects contacted, 50 enter pipeline, 5 close. The rate against all prospects is 1%; against pipeline it's 10%. Skip the blended number entirely here - it'll just depress you.
Referral-heavy agency: 40 referral leads, 30 take a meeting, 18 close. The closing ratio is 45%, reflecting the trust that referrals carry into the conversation.
Same formula, wildly different numbers. The lesson: always pair your number with the context of how those opportunities were sourced.
Tools That Help
Prospeo - The data quality layer that feeds clean contacts into everything else. With 98% verified email accuracy, 125M+ verified mobile numbers, and a 7-day refresh cycle, it ensures every opportunity in your pipeline is a real person. Credit-based pricing starts at ~$0.01/email with a free tier that includes 75 emails and 100 Chrome extension credits per month. No contracts. Pair it with any CRM to eliminate the phantom contacts that silently destroy your close rate.
If you're evaluating vendors, compare options in our guide to data enrichment services.
HubSpot CRM - The free tier handles basic pipeline tracking for small teams. Sales Hub paid plans start around $20-$30/user/month billed annually and add forecasting plus deal-stage analytics for funnel analysis.
Salesforce - Plans start around $25/user/month and scale up by edition. It's the enterprise standard for pipeline analytics. For teams running stage-by-stage conversion tracking across multiple territories, this is where most orgs land.
Gong - Revenue intelligence that's typically enterprise-priced at $100+/user/month. The conversation analytics and win-rate insights power many of the data points in this article. If you want to understand why deals close or die, Gong gives you the tape.
FAQ
What's a Good Closing Ratio?
The average across industries is ~20%, but "good" depends on lead source, deal size, and sales motion. Inbound converts around 15%, outbound closer to 2%, and referrals significantly higher. Compare against your own historical trend rather than a universal number.
How Often Should I Measure It?
Monthly for trend analysis, quarterly for strategic decisions. Avoid weekly measurement - small sample sizes create misleading swings. Use a consistent denominator definition across every report to keep comparisons meaningful.
Close Rate vs. Win Rate: What's the Difference?
Close rate measures deals closed against total leads, including unqualified ones. Win rate measures deals won against qualified opportunities only. Average win rate is 47% - much higher than the ~20% close rate - because the denominator excludes leads that never had a real shot.
How Can Bad Data Hurt My Close Rate?
Invalid emails and outdated contacts inflate your pipeline denominator without adding real opportunities. One team saw bounce rates drop from 35% to under 4% after cleaning their data, tripling weekly pipeline in the process. It's the fastest fix most teams overlook.
You just saw that bad data pollutes your denominator and kills your closing ratio. Bounced emails aren't opportunities - they're noise. Prospeo's 5-step verification and 7-day data refresh keep your pipeline clean so every metric you track reflects reality, not phantom contacts.
Clean pipeline data starts at $0.01 per verified email.