Co-Dynamic Lead Scoring: The Framework, the Math, and How to Ship One in 30 Days
65% of marketers say generating leads is their biggest challenge. Most of those leads get scored with broken models - cumulative systems that reward an intern who downloaded six whitepapers over two years the same as a VP who hit your pricing page yesterday. Co-dynamic lead scoring fixes this by splitting every lead into two axes: fit (A-D) and engagement (1-4). Sixteen classifications instead of one meaningless number.
Breadcrumbs coined and popularized the term, and the fact that one of the most-cited references is a PDF hosted on Salesforce AppExchange tells you how poorly this framework has been documented elsewhere. Let's fix that.
What Is Co-Dynamic Lead Scoring?
The letter (A-D) captures how closely a lead matches your ICP - role, seniority, company size, revenue, tech stack. The number (1-4) captures engagement intensity, with recency and frequency doing most of the heavy lifting.
A lead at a 5-person agency shouldn't score the same as one at a 500-person SaaS company just because both carry the "VP" title. A one-dimensional score can't tell the difference. Two axes can.
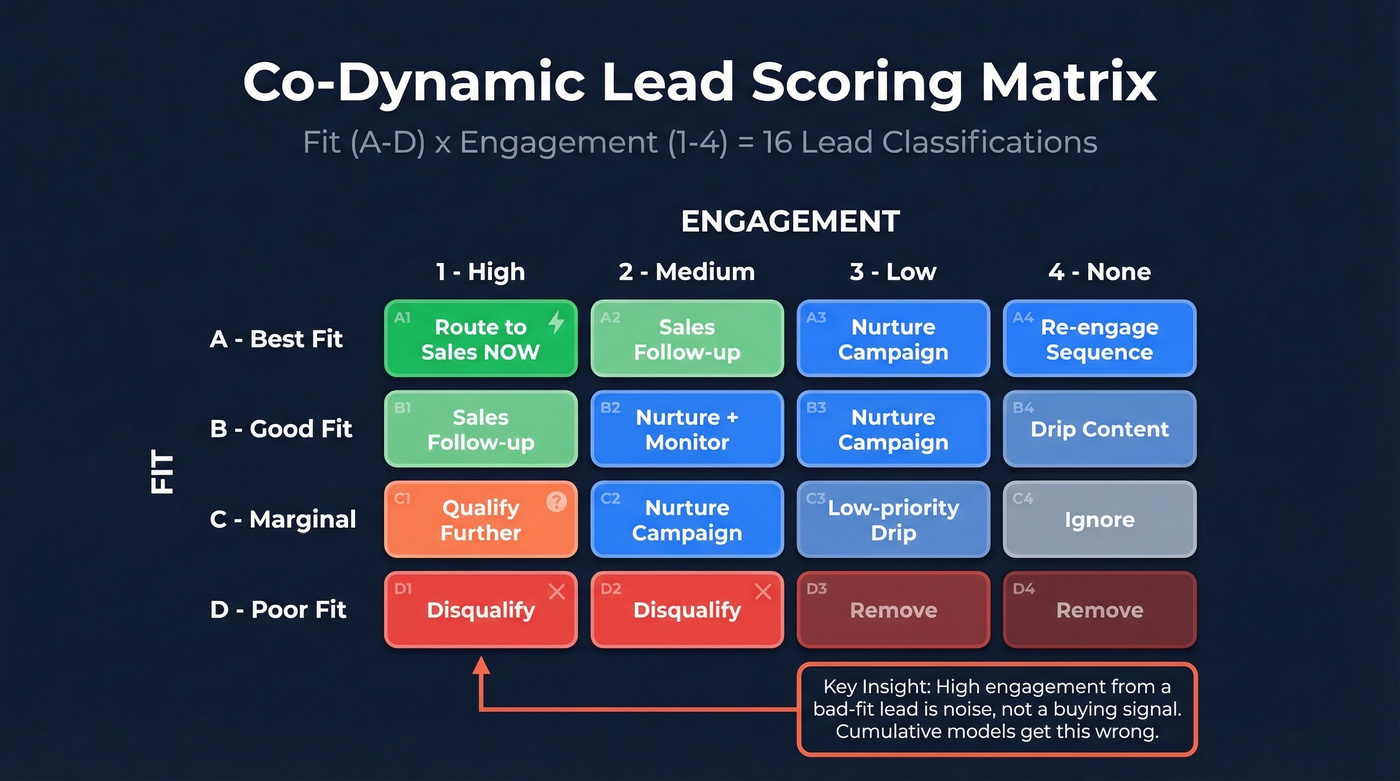
| 1 (High) | 2 (Medium) | 3 (Low) | 4 (None) | |
|---|---|---|---|---|
| A (Best fit) | Route to sales now | Sales follow-up | Nurture campaign | Re-engage sequence |
| B (Good fit) | Sales follow-up | Nurture + monitor | Nurture campaign | Drip content |
| C (Marginal) | Qualify further | Nurture campaign | Low-priority drip | Ignore |
| D (Poor fit) | Disqualify | Disqualify | Remove | Remove |
That D1 cell is the key insight. High engagement from a bad-fit lead isn't a buying signal - it's noise. Cumulative models treat it as gold. The dual-axis approach treats it as what it is: a student researching a term paper, a competitor poking around, or a freelancer who'll never have budget. Oracle Eloqua uses this exact profile (A-D) + engagement (1-4) matrix natively, so this framework is production-proven across enterprise teams, not theoretical. Teams that implement dual-axis scoring with proper routing typically see a 10-30% lift in lead-to-opportunity conversion.
Co-Dynamic vs. Predictive vs. Rule-Based
| Co-Dynamic | Predictive (AI) | Rule-Based Static | |
|---|---|---|---|
| Score updates | Real-time, dual-axis | Model-dependent (batch or continuous) | Manual threshold edits |
| Behavioral signals | Core (the number axis) | Varies by vendor | Often ignored |
| Explainability | High - letter + number | Low - black box | High but rigid |
| Data required | Moderate | Large historical dataset | Minimal |
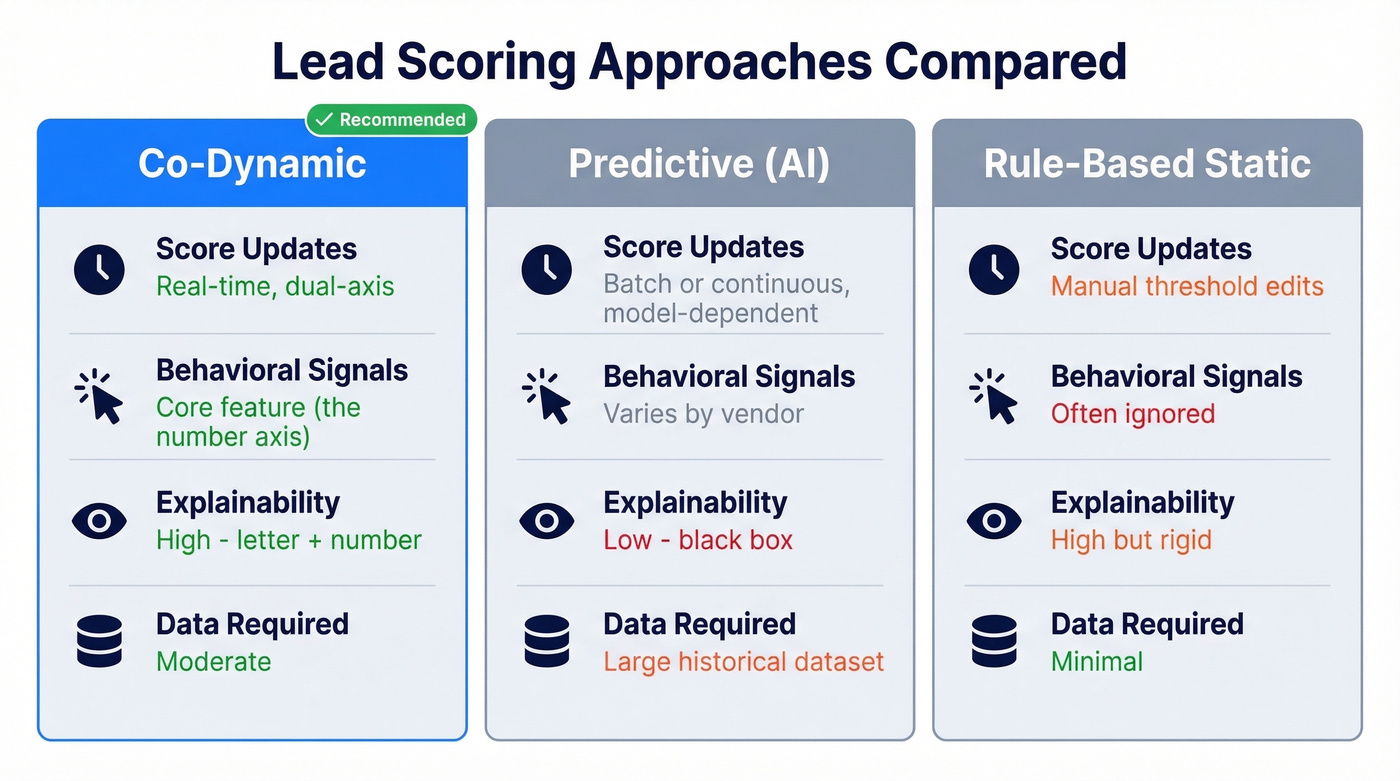
Here's the thing: if your "predictive" scoring tool ignores behavior, it isn't predictive in any meaningful sense. Microsoft Dynamics 365's predictive lead scoring has no behavioral component - by design. A Microsoft employee confirmed this in the Dynamics community forum. That means it can't tell you when a lead is heating up, only whether the firmographic profile looks right.
How the Dual-Axis Model Works
Three temporal signals drive the engagement axis: recency, frequency, and velocity. A lead who visited your pricing page three times this week is fundamentally different from one who visited once six months ago, even if the cumulative point total is identical.
Fit signals feed the letter grade: role, seniority, company size, revenue, tech stack, industry, geography. Negative scoring matters here too. Subtract points for out-of-ICP industries, personal email domains, companies below your revenue threshold, and out-of-geo locations. If you need a starting point, use an ICP rubric you can actually score against.
Engagement signals feed the number. Weight them like this:
| Action | Points |
|---|---|
| Demo request | 25 |
| Pricing page visit | 20 |
| Case study download | 12 |
| Content download | 10 |
| Webinar attendance | 8 |
| Email opens/clicks | 0 |
Zero for email opens and clicks. Bot and spam-filter automation inflates these signals to uselessness. We've tested this across multiple client datasets and the correlation between email opens and closed-won deals is essentially zero. Don't score them. If you're still tracking opens for reporting, treat them as a separate email metric, not a scoring input.
Decay is non-negotiable. Drop engagement scores after 30 days of inactivity. Remove leads entirely after 365 days of zero activity. Accelerating engagement - three visits this week vs. one per month - should boost scores faster than a steady drip. Time-decay is the core feature that separates dynamic scoring from static point accumulation.
Your fit axis depends on accurate firmographic data. Your engagement axis depends on emails that actually reach inboxes. Prospeo enriches every contact with 50+ data points - job title, seniority, company size, tech stack, revenue - at 98% email accuracy on a 7-day refresh cycle. No stale titles. No dead emails. No fictional A1 grades.
Stop scoring leads built on garbage data. Start with inputs you can trust.
Ship It in 30 Days
You don't need six months. Analysis paralysis kills more scoring programs than bad point values - the consensus on r/b2bmarketing backs this up.
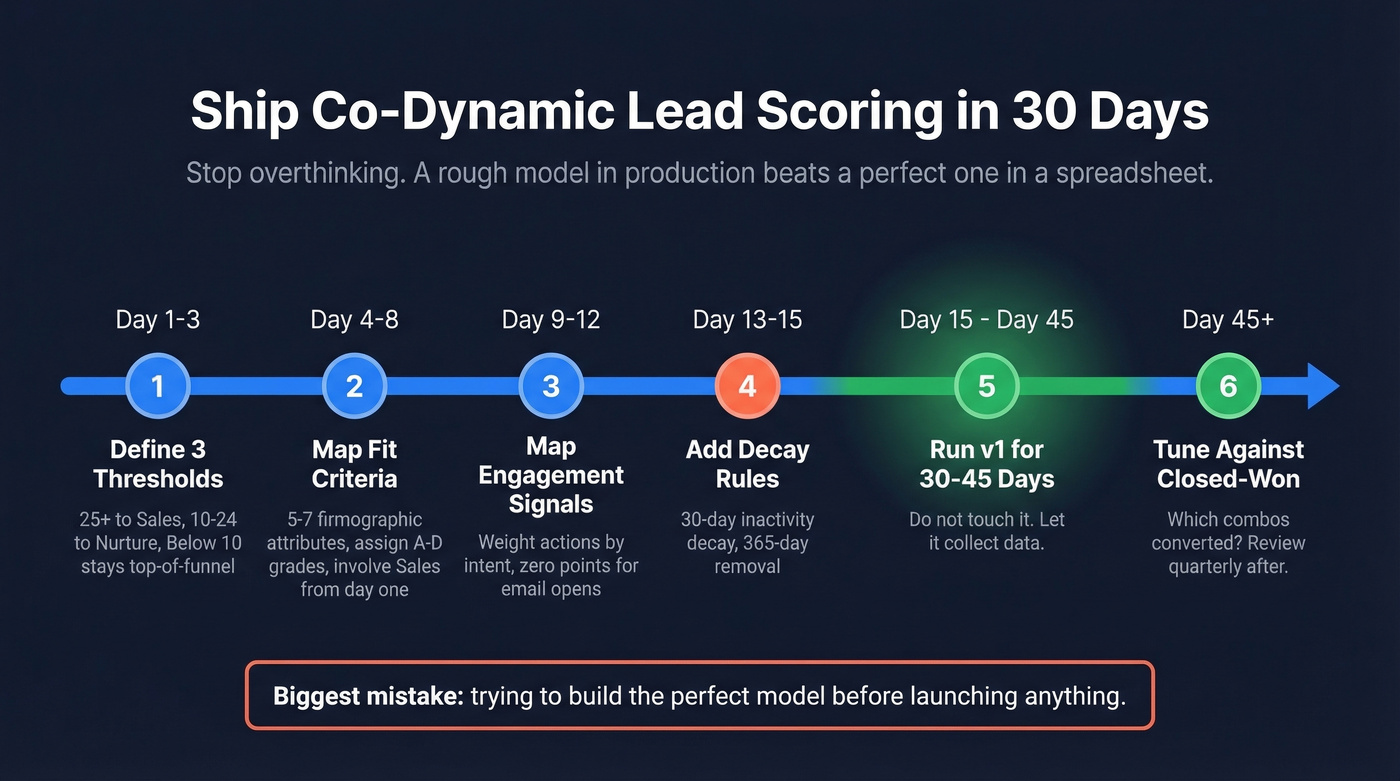
- Define three thresholds. 25+ routes to sales. 10-24 enters nurture. Below 10 stays top-of-funnel.
- Map fit criteria. Pick 5-7 firmographic attributes. Assign A-D grades. Involve Sales from day one - if you skip this, you'll rebuild the model within a quarter.
- Map engagement signals. Use the table above. Adjust for your funnel.
- Add decay. 30-day inactivity decay, 365-day removal.
- Run v1 for 30-45 days. Don't touch it.
- Tune against closed-won data. Which combos converted? If B2s convert at the same rate as A1s, your fit axis needs recalibration. Review quarterly after that.
The biggest mistake we see teams make is trying to build the perfect model before launching anything. Ship a rough version, let it collect data, then refine. A mediocre model running in production beats a perfect model stuck in a spreadsheet every single time. If you want a broader baseline before you start, use a modern lead scoring checklist.
Mistakes That Break Your Model
Scoring email opens/clicks. Bots make these meaningless. Remove them entirely.
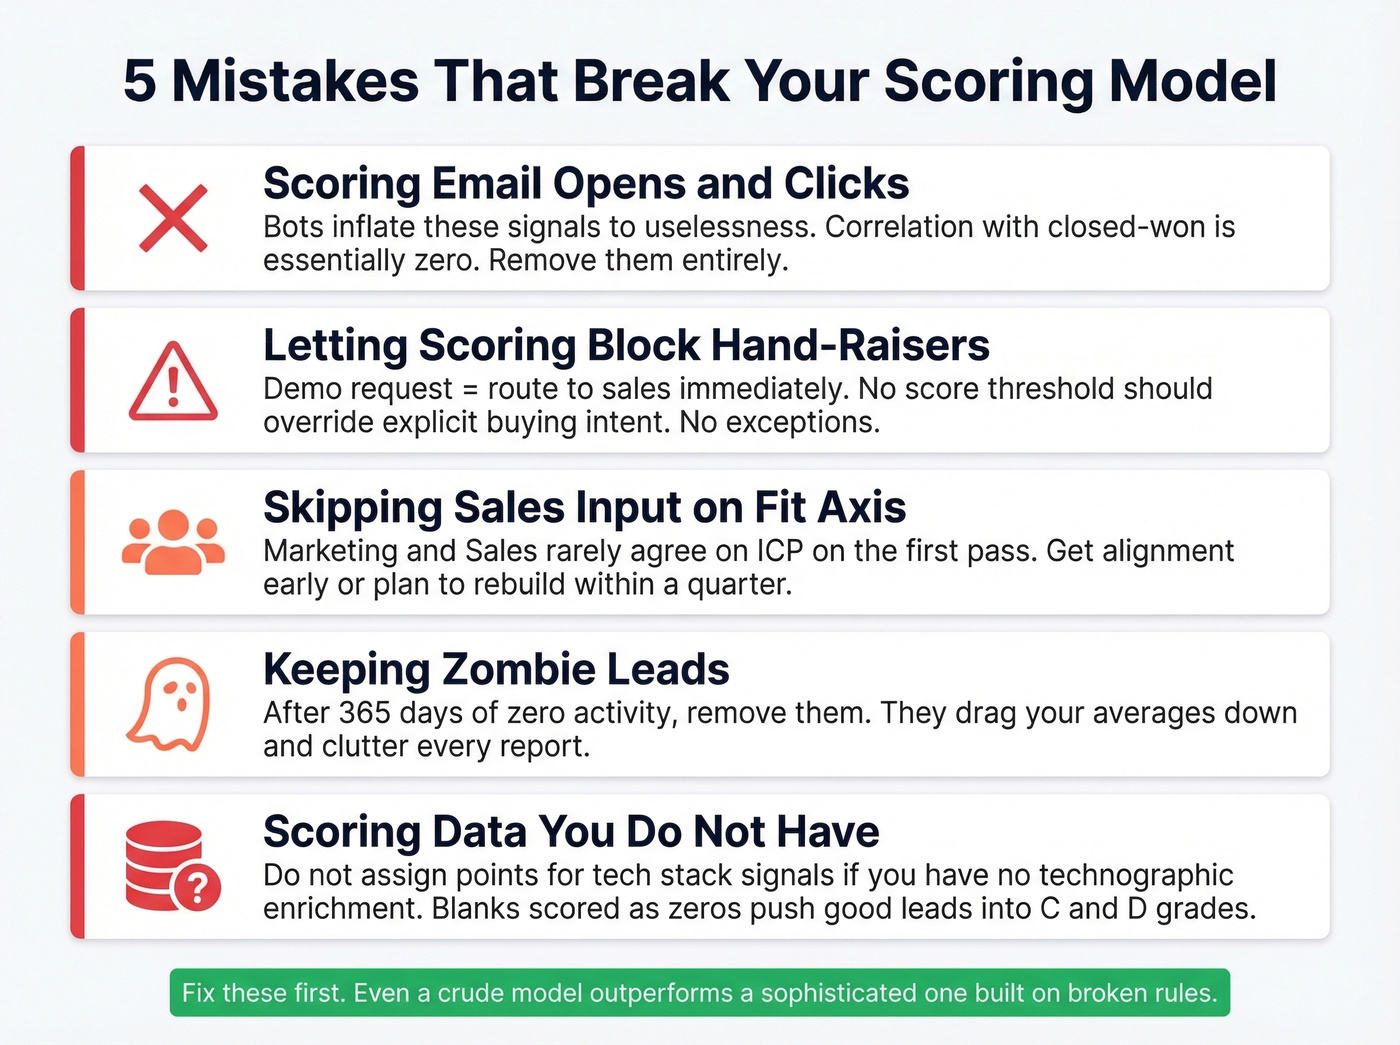
Letting scoring block hand-raisers. Someone requests a demo? Route to sales immediately, regardless of their score. No exceptions. Your sales follow-up motion should be ready for these leads.
Skipping Sales input on the fit axis. Marketing's idea of an ideal customer and Sales' idea rarely match on the first pass. Get alignment early or plan to rebuild. This is also where RevOps usually earns its keep.
Keeping zombie leads. After 365 days of zero activity, remove them. They're dragging your averages down and cluttering every report you run. If your pipeline reporting is messy, start with funnel metrics that don’t get distorted by dead records.
Scoring data you don't have. Don't build rules around technographic signals if you aren't capturing tech stack data. It sounds obvious, but we've seen teams assign points for "uses Salesforce" when they had no technographic enrichment in place. The result was a fit axis full of blanks scored as zeros, which pushed genuinely good leads into C and D grades. If you do want to score on stack, you need reliable firmographic and technographic data first.
The Data Quality Prerequisite
Your scoring model is only as accurate as the data underneath it. We've seen models where 40% of "A1" leads had bounced emails - the fit axis was pure fiction because the underlying records were stale. If you’re seeing this, start by fixing your email bounce rate problem at the source.
Look, most teams that "fail" at lead scoring don't have a scoring problem. They have a data problem. Stale titles mean your letter grades are wrong. Dead emails mean your engagement routing fails before the first touchpoint. Fix the inputs and even a crude model outperforms a sophisticated one built on garbage.
This is where data enrichment earns its keep. Prospeo's CRM enrichment returns 50+ data points per contact on a 7-day refresh cycle with 98% email accuracy. When every record reflects reality - current title, verified email, accurate company data - the A-D axis actually means something. Compare that to the industry-average 6-week refresh cycle, where a quarter of your "A-grade" contacts may have already changed roles. If you’re evaluating vendors, start with a shortlist of data enrichment services.
You read it above: teams where 40% of 'A1' leads had bounced emails were scoring fiction. Prospeo's 5-step verification and weekly data refresh eliminate the stale records that break dual-axis models. Accurate titles for your letter grades. Verified emails for your engagement routing. 83% enrichment match rate across your entire CRM.
Ship your scoring model in 30 days - on data that's never more than 7 days old.
FAQ
Is co-dynamic the same as dynamic lead scoring?
No. Dynamic scoring updates in real time but is usually single-dimensional - one number goes up or down. Co-dynamic lead scoring combines two independent axes (fit as A-D, engagement as 1-4) into a 16-cell matrix, producing classifications like A1 or D3 instead of one ambiguous number. The dual-axis structure lets you disqualify high-engagement poor-fit leads automatically, which a single score can't do without manual overrides.
What tools support this framework natively?
Breadcrumbs built its platform around this model. Oracle Eloqua supports the A-D / 1-4 matrix out of the box. HubSpot and Salesforce can replicate it with custom properties and automation rules, but they require manual configuration. Whichever tool you use, accurate contact data is the prerequisite - if your CRM records are stale, the fit axis is fiction no matter how good the tool is.
How often should I recalibrate?
Run v1 for 30-45 days without changes, then tune based on closed-won conversion data. After initial calibration, review quarterly. If your A1-to-opportunity rate drops below 25%, recalibrate immediately - your fit criteria have likely drifted from what's actually converting.