How to Calculate SOM (Without Guessing a Percentage)
"We'll capture 2% of the market." That line shows up in roughly half the pitch decks we've reviewed, and it means almost nothing. Picking a round percentage of a large number isn't market sizing - it's wishful arithmetic. 42% of startups fail due to lack of market need, and a sloppy SOM is often the first sign a founder hasn't pressure-tested demand.
Let's fix that. Three methods, real formulas, worked examples - all grounded in numbers you can actually defend.
The Quick Version
SOM = SAM x expected market share %. That's the textbook formula, but it's only useful if the inputs are grounded in reality, not vibes. Bottom-up methods are the most credible for investor-facing sizing. Top-down is a directional sanity check at best.
The step most founders skip? Talking to 10-15 actual prospects to validate willingness-to-pay. We know a founder who discovered their "sweet spot" budget was 40% less than assumed. That single finding reshaped their entire SOM.
TAM and SAM in 60 Seconds
TAM is all the revenue available if you had 100% market share and zero constraints. It's a ceiling, not a target. SAM is the slice of TAM you can actually serve - filtered by geography, segment, product fit, and pricing.
Quick example: a UK payroll software company starts with 5.7M UK SMEs. Filter out the 4.3M with zero employees (they don't need payroll), and you're left with 1.4M businesses. At £1,200/year average spend, that's a £1.68B TAM. SAM narrows further by company size, tech stack, and willingness to switch. SOM is what you can realistically capture from that SAM - your obtainable market share - and that's where the real work begins.
If you want a deeper refresher on TAM and SAM definitions (and where founders usually mix them up), it’s worth a quick read.
Three Ways to Calculate Your Obtainable Market
The best method depends on whether you have revenue history, a sales team, or neither.
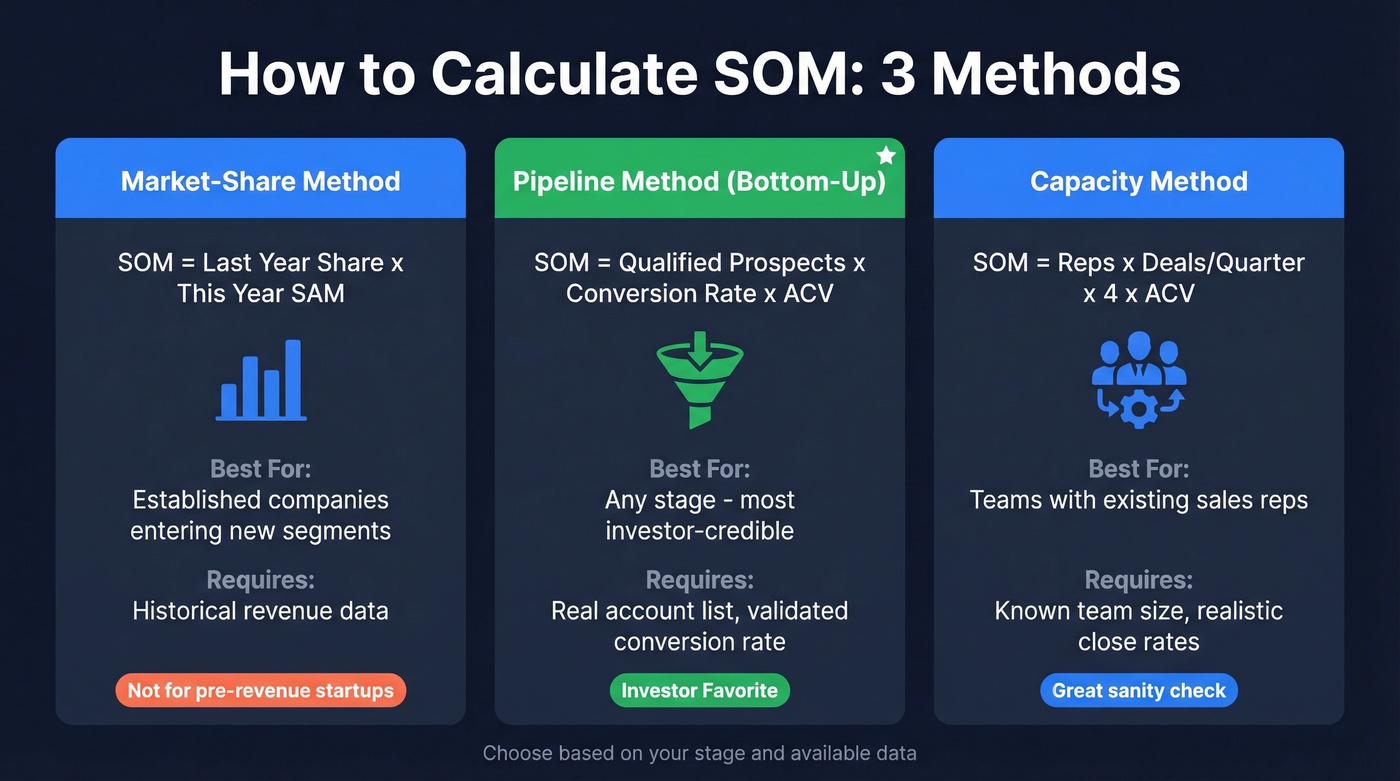
Market-Share Method
Formula: SOM = Last Year's Market Share x This Year's SAM
This only works if you're an established company entering a new segment or expanding geographically. You need historical share data to make it credible. Pre-revenue? Skip this entirely.
The trap: founders without revenue history grab an arbitrary percentage - "we'll capture 3% of SAM" - and call it a day. That's the single biggest credibility killer in pitch decks. As Antler's market sizing guide explains, you use last year's actual share as the baseline, then apply it to this year's SAM. No history, no baseline, no method.
Pipeline-Based Method (Bottom-Up)
Formula: SOM = Qualified Prospects x Conversion Rate x ACV
This is the most investor-credible approach for any SOM calculation. It starts with real accounts, applies an evidence-backed conversion rate, and produces a number grounded in your GTM reality.
Here's a worked example adapted from a practitioner thread on r/FounderFAQs: a medical device company identifies 347 distributors in their space with a total TAM of $1.04M. After geographic and firmographic filtering, SAM narrows to $125K. Within that SAM, they count the specific accounts they can realistically pursue. A common Year 1 planning assumption in B2B SaaS is converting 2-4% of qualified pipeline. Even a small SAM produces a grounded SOM at those rates.
The key input most people get wrong is the qualified prospect count. Don't estimate it from a report. Build the list. Count the accounts. Validate with prospect calls that these companies actually have the budget and the pain point.
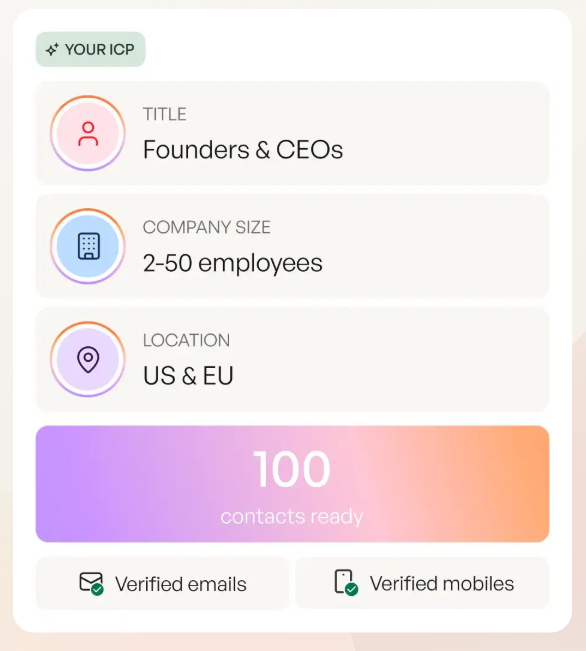
If you’re building that list from scratch, start with a tight Ideal Customer Profile and clear firmographic filters so your “qualified prospects” number is actually defensible.
Capacity-Based Method
Formula: SOM = Reps x Deals per Rep per Quarter x 4 x ACV
This method asks a blunt question: given your current team, how much can you actually close? Four salespeople can't close $200M in pipeline. If your SOM implies they can, something's broken.
Say you have 4 reps, each closing 3 deals per quarter at $25K ACV. That's 48 deals/year, or $1.2M in SOM. Not glamorous, but honest - and it maps directly to your hiring plan and budget.
One constraint worth flagging: your CAC has to make sense. LTV:CAC becomes meaningful only when you have a repeatable, scalable growth process, not founder-led sales closing friends-of-friends. And here's a detail people miss - bad contact data shrinks your reachable market fast. If 30% of your emails bounce, you lose roughly 30% of your reachable volume at the top of the funnel before a single rep picks up the phone.
If you want to benchmark assumptions like win rate and stage-to-stage movement, use sales pipeline benchmarks and sanity-check your sales conversion rate.
Worked Examples With Real Numbers
| Example | TAM | SAM | SOM | Method |
|---|---|---|---|---|
| Airbnb (bookings) | 1.9B global/yr | 532M (key mkts) | 10.6M bookings | Pipeline + beachhead |
| UK Payroll SaaS | £1.68B | ~£200M | £6-10M | Capacity-based |
| Medical Device | $1.04M | $125K | $50-100K | Pipeline (2-4%) |
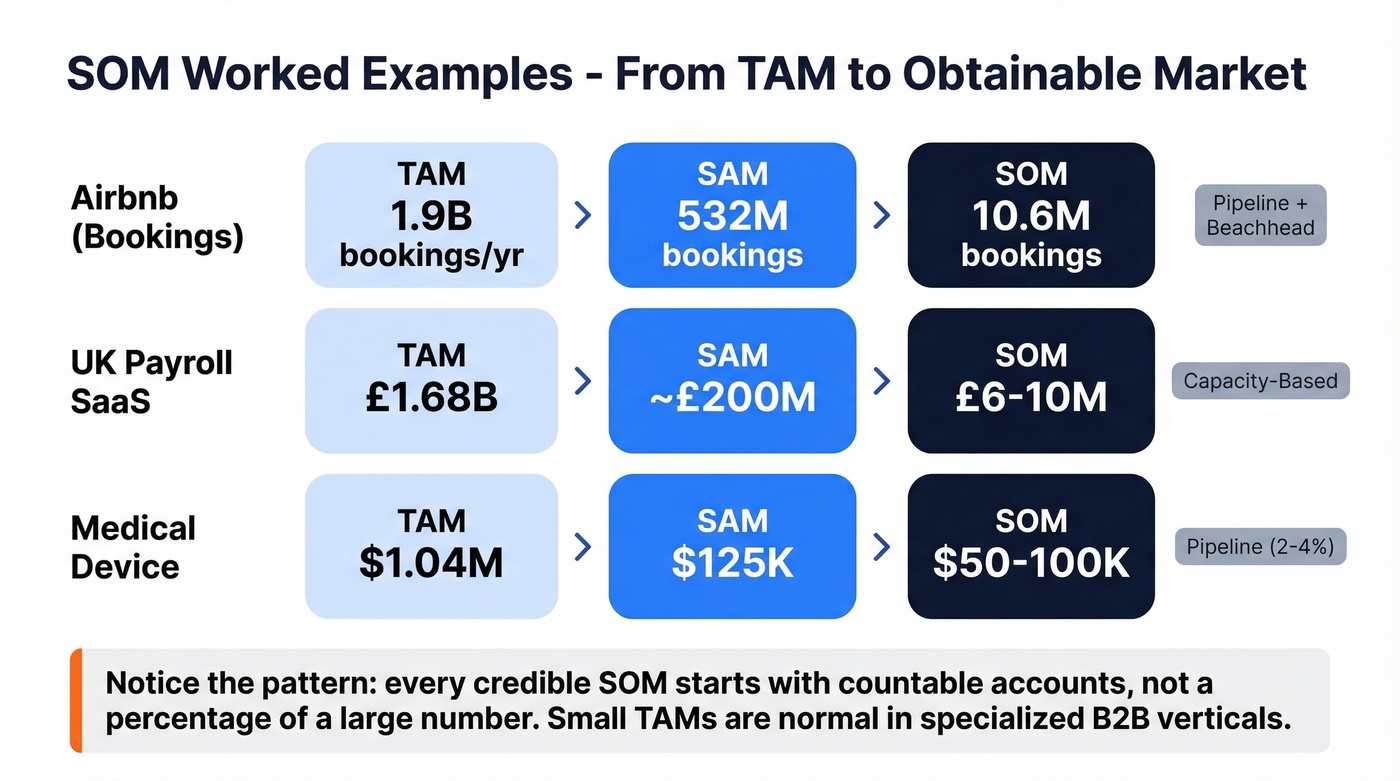
Small TAMs are common in specialized B2B verticals. The methodology is identical regardless of market size.
The Airbnb example is instructive. They didn't say "we'll capture 1% of global bookings." They identified specific markets, specific traveler segments, and specific booking behaviors to arrive at 10.6M bookings as a realistic initial target. That's bottom-up thinking applied at scale. Notice the pattern: every credible SOM starts with a countable number of accounts, not a percentage of a large number.
If you need a clean definition framework to keep your slides consistent, see our guide to the addressable market.
You read it above: the pipeline method needs a real account list, not estimates from a report. Prospeo's database gives you 300M+ profiles with 30+ filters - industry, headcount, funding, tech stack - so you can count your qualified prospects instead of guessing. At $0.01 per email with 98% accuracy, your SOM math stays honest.
Stop estimating your reachable market. Count it.
SOM Calculation Pre-Revenue
No revenue? You need a different playbook, but it's entirely doable.
Start with the beachhead strategy. Instead of sizing your entire market, identify the "earlyvangelists" - the segment feeling the most pain, with the highest willingness to pay and the shortest sales cycle. Your Year 1 SOM is this beachhead, not your full SAM.
Validate with 10-15 prospect calls. Not surveys. Not LinkedIn polls. Actual conversations where you ask about budget, current solutions, and switching triggers. One founder we spoke with discovered their assumed price point was 40% too high - that single finding cut their SOM by nearly half, but made it defensible.
For proxy data, use these sources to build your raw account numbers:
- Census Bureau records and BLS industry stats
- Companies House filings (UK)
- Crunchbase for company counts and funding data
- Trade association reports and industry directories
One cautionary tale: McKinsey once estimated 900,000 mobile phone users over 20 years. The actual number hit ~110M. Sizing disruptive markets by looking at incumbent behavior is like sizing the car industry by counting horses. If you're building something genuinely new, acknowledge the uncertainty - but still ground your SOM in countable early adopters.
For examples of how funded startups present their TAM/SAM/SOM slides, getalai.com curates 100+ real pitch decks from recent rounds - worth studying before your next investor meeting.
If you’re pre-revenue and planning outbound, it also helps to map your early outreach into a repeatable system using proven sales prospecting techniques and a simple B2B sales funnel template.
What Investors Actually Scrutinize
Investors use your TAM/SAM/SOM breakdown as a credibility signal. Weak market sizing makes the rest of your pitch deck wobble.
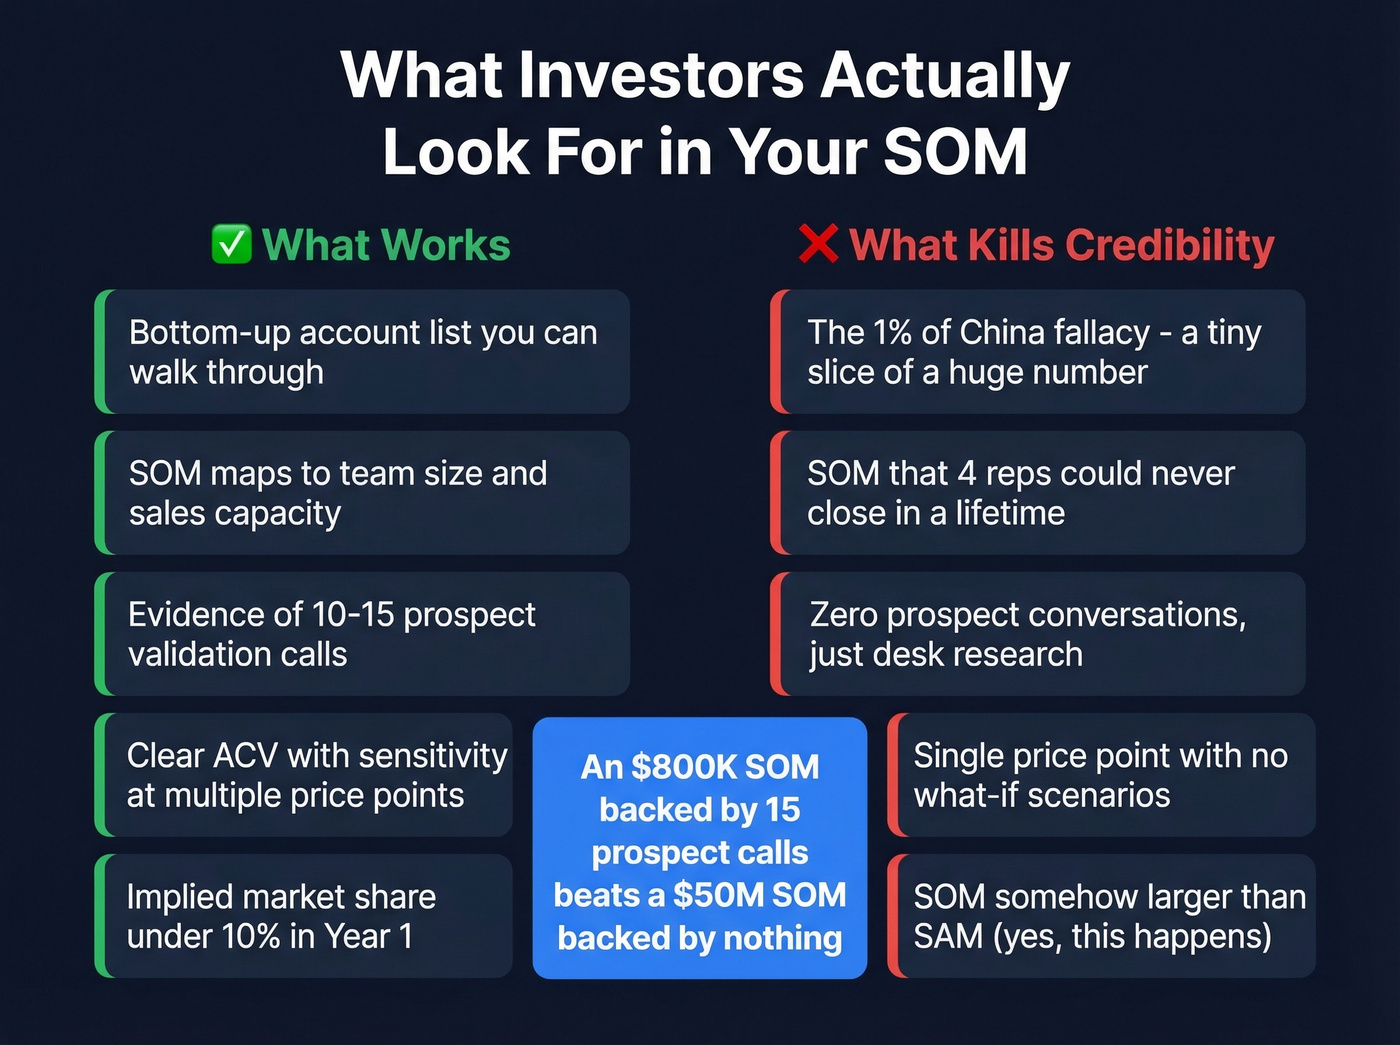
What works: TAM shows ambition. SAM shows you understand your segment. SOM shows execution clarity - grounded in tested CAC, existing pipeline, and known conversion rates. A clear presentation with a defined number of target accounts, a stated ACV, and a transparent breakdown goes a long way.
What kills credibility: The "1% of China" fallacy - claiming a tiny slice of a massive market without explaining how you'll acquire those customers. The consensus on r/sales and r/startups is that this is the fastest way to lose investor attention. A SOM that doesn't map to your team size, budget, or sales cycle is almost as bad. And if there's no evidence of prospect validation - calls, pilots, LOIs - investors will assume you haven't done the work.
Here's the thing: investors don't expect precision. They expect defensibility. An $800K SOM backed by 15 prospect calls and a clear capacity model beats a $50M SOM backed by nothing.
If you want to tie SOM to execution metrics investors recognize, align it with cost to acquire customer assumptions and basic funnel metrics.
Seven Mistakes That Kill Credibility
1. The "1% of China" fallacy. Claiming a small percentage of a huge market sounds conservative but proves nothing. Investors want to know how you'll acquire those customers.
2. Top-down-only analysis. An overly optimistic startup uses top-down sizing, ignores competitors, inflates TAM, then targets too broadly. Result: high acquisition costs and investor skepticism.
3. No prospect validation. If you haven't talked to 10-15 potential buyers, your SOM is a hypothesis, not a forecast.
4. Outdated data. Using a 2023 market report for a 2026 pitch deck. Update your inputs at least quarterly.
5. Confusing TAM, SAM, and SOM scopes. We've seen decks where the SOM is larger than the SAM because someone mixed up definitions mid-spreadsheet. Embarrassing, but it happens more than you'd think.
6. Ignoring competition. Your SOM can't include accounts where an entrenched competitor has 5-year contracts. Factor in realistic competitive dynamics.
7. Single price point, no sensitivity analysis. If your entire SOM hinges on a $50K ACV, what happens if the market will only pay $30K? Run your model at multiple price points.
Build Your SOM Spreadsheet
Most SOM calculators just multiply SAM by an assumed percentage. Here are the exact inputs your spreadsheet needs - one row per method.
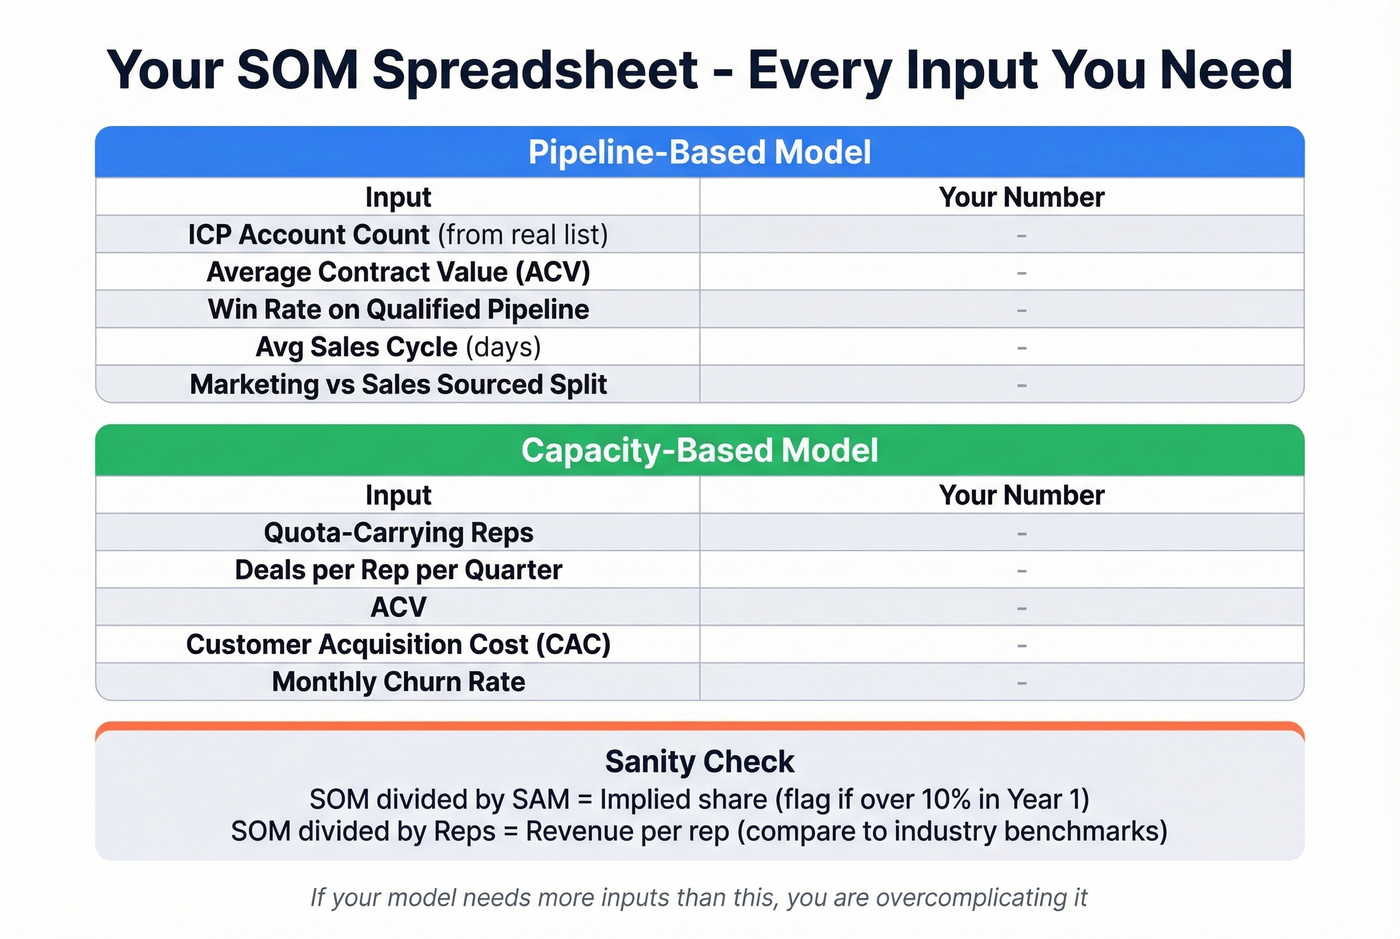
Pipeline-Based Model: ICP account count from your actual prospect list, average contract value, win rate on qualified pipeline, average sales cycle length in days, and marketing-sourced vs. sales-sourced split.
Capacity-Based Model: Number of quota-carrying reps, deals per rep per quarter (be conservative), ACV, customer acquisition cost, and monthly churn rate.
Sanity Check Row: SOM divided by SAM gives you implied market share - if it exceeds 10% in Year 1, pressure-test your assumptions hard. SOM divided by number of reps gives you revenue per rep, which you should compare against industry benchmarks for your ACV range.
Hot take: if your SOM math requires more than these inputs, you're overcomplicating it. The founders who raise money aren't the ones with the fanciest models - they're the ones who can walk an investor through 10 cells on a spreadsheet and defend every number.
If you’re operationalizing this in RevOps, a lightweight sales forecasting solutions stack can keep your assumptions updated as reality changes.
Turn Your SOM Into a Prospect List
Your SOM told you there are X qualified accounts in your beachhead. That's a number on a spreadsheet until you can actually reach decision-makers at those companies.
Remember that 30% bounce rate problem? Bad data shrinks your reachable market before outreach even starts. Prospeo's 98% email accuracy and 7-day data refresh cycle mean you go from "400 target accounts" to verified contact data for the right decision-makers in an afternoon. Use 30+ search filters - buyer intent, technographics, headcount growth, funding stage - to match your ICP criteria exactly.
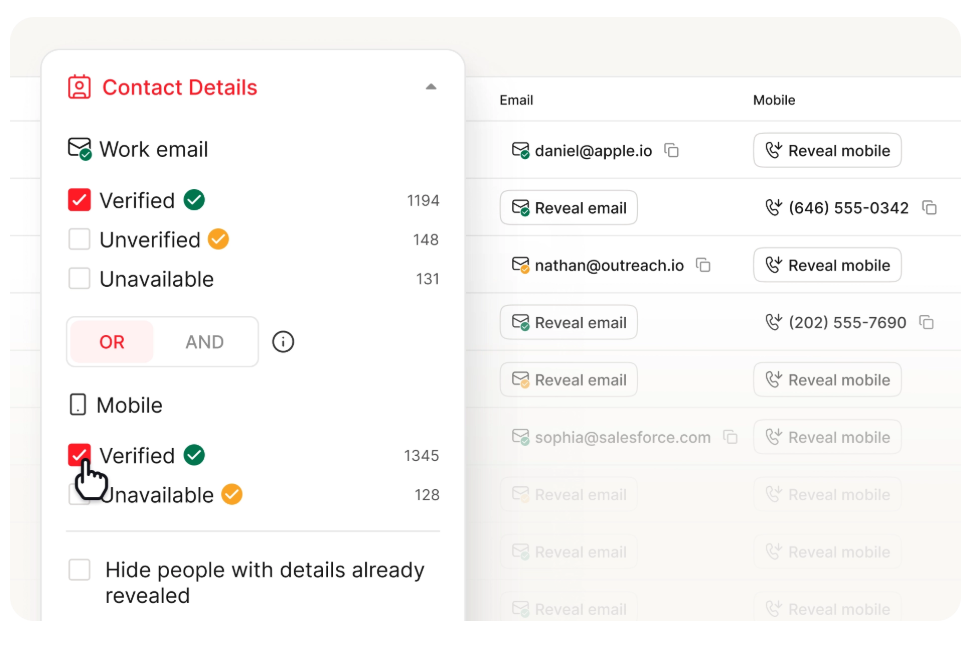
Bad contact data doesn't just kill deliverability - it shrinks your obtainable market before a single rep dials. If 30% of your emails bounce, your real SOM is 30% smaller than your spreadsheet says. Prospeo's 98% email accuracy and 7-day data refresh keep your reachable market intact.
Protect your SOM from bad data - verify every contact before you send.
FAQ
What's a realistic SOM percentage for a startup?
Most B2B SaaS companies convert 2-4% of qualified pipeline in Year 1, but there's no universal percentage - that's exactly why top-down SOM fails. Use pipeline-based or capacity-based methods instead of picking an arbitrary share. Your number depends on ACV, sales cycle length, and team size.
How often should you update your SOM?
Recalculate at least quarterly, or whenever you add sales reps, enter new segments, change pricing, or close enough deals to recalculate your actual conversion rate. A SOM from six months ago is already stale.
Can you calculate SOM without any revenue?
Yes. Use the pipeline-based method with 10-15 prospect call validations and proxy data from Census Bureau records, trade associations, or Crunchbase to estimate your qualified account count. Ground every input in real conversations, not assumptions.
What's the difference between SOM and SAM?
SAM is the segment of TAM you could theoretically serve given your product, geography, and pricing. SOM is the portion of SAM you can realistically capture given your team size, budget, competitive position, and sales capacity. SAM measures potential; SOM measures execution.
How do you build a prospect list from your SOM?
Once you've identified your target account count and ICP, use a B2B data platform to find verified emails and direct dials for decision-makers. Filter by role, seniority, department, company size, and buyer intent signals to match your SOM assumptions exactly.