How to Measure ABM Success in 2026 (With Benchmarks)
You're in the QBR. Marketing shows a dashboard full of impressions, clicks, and content downloads. The CFO asks one question: "How much pipeline did ABM actually create?" Nobody has a clean answer.
Gartner found that 36% of marketers struggle to measure ABM ROI, and the problem isn't effort - it's measuring the wrong things. Knowing how to measure ABM success starts with killing vanity metrics and replacing them with numbers that tie directly to revenue.
Here's the thing: stop reporting engagement metrics to leadership. They want account progression and pipeline. Track five metrics - target account coverage, account engagement progression, pipeline contribution, deal velocity, and revenue per account. Measure over quarters, not weeks. Fix your attribution by moving from lead-level to account-level tracking. Everything below explains how.
Five ABM Metrics That Matter
Target Account Coverage
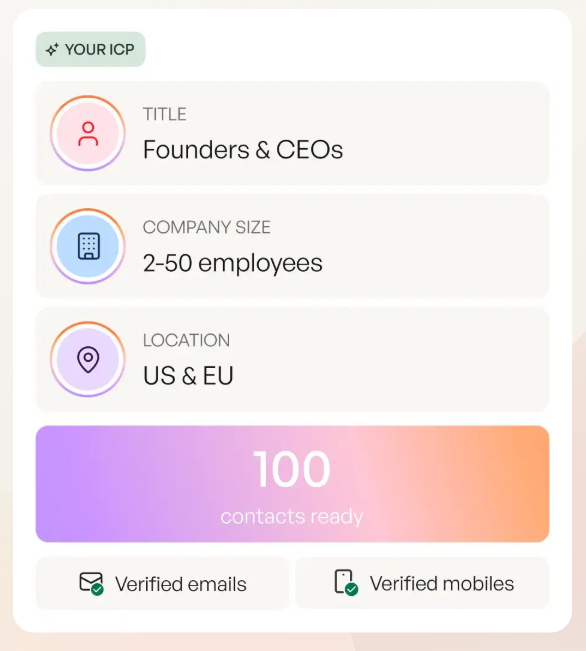
What percentage of your target accounts have you identified and can actually reach? This means verified contact data for the right buying committee members - not just company names on a list.
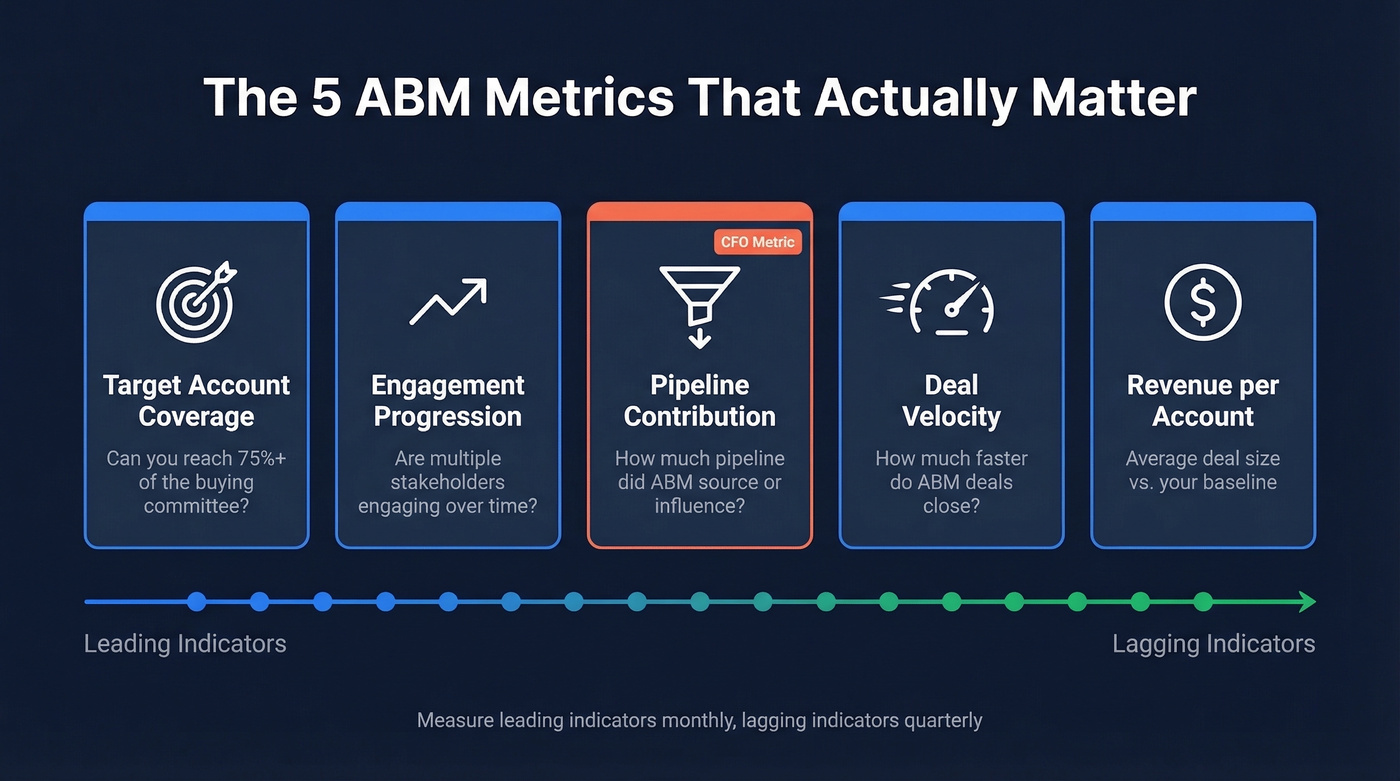
Aim for 75%+ buying-committee coverage across your Tier 1 accounts. Engaging 9 out of 12 people in a buying unit is 75%. Coverage is meaningless if your data is stale, so build in a verification step before you report this number. We've seen teams proudly claim 90% coverage only to discover a third of their emails bounce - which makes the real number closer to 60%. (If you're diagnosing bounce issues, start with bounce rate benchmarks and root causes.)
Account Engagement Progression
Shift from MQLs to MQAs (marketing-qualified accounts). Track whether the account is progressing - multiple stakeholders engaging across channels. A single champion downloading a whitepaper isn't progression. Three buying committee members attending a webinar is. (If you still need a lead-first baseline, map it to funnel metrics before you switch reporting.)
A Fortune 500 manufacturer hit a 42% account engagement rate using this multi-threaded approach. One practitioner on r/ABM improved ad view time from roughly 1 second to 3-4 seconds - a far better signal than raw impression count.
Pipeline Contribution
Pipeline sourced or influenced by ABM target accounts. This is the metric your CFO cares about.
Measure it as a percentage of total pipeline and as an absolute dollar figure. Teams who report both numbers get their budgets renewed faster, and it's the clearest way to demonstrate account-based program value to the board. If you can only track one ABM metric, make it this one. (To pressure-test your reporting, compare it against pipeline health indicators.)
Deal Velocity
How much faster do ABM-influenced deals close compared to non-ABM deals? BioCatch saw 41% faster deal velocity on ABM-sourced opportunities. Measure days from opportunity creation to closed-won, segmented by ABM vs. non-ABM. The delta between those two numbers is your strongest argument for expanding the program.
Revenue per Account
Average deal size and total revenue from ABM accounts vs. your baseline. Bonterra reported 2.5x deal value on ABM accounts. This is the ultimate proof point - the number that turns a pilot into a permanent budget line. (If you need to align this with finance, tie it back to cost to acquire customer and payback.)
ABM Benchmarks for 2026
| Company | Metric | Result |
|---|---|---|
| BioCatch | Accounts in pipeline | 6x increase |
| BioCatch | Deal velocity | 41% faster |
| Bonterra | Win rate | 2x |
| Bonterra | Deal value | 2.5x |
| CipherHealth | Revenue per $1 spent | $122.70 |
| StarTree | Conversion rate | 3.17x vs cold |
| Fortune 500 mfg. | Engagement / ROI / cycle time | 42% engagement, 300% ROI, 14 to 10 months |
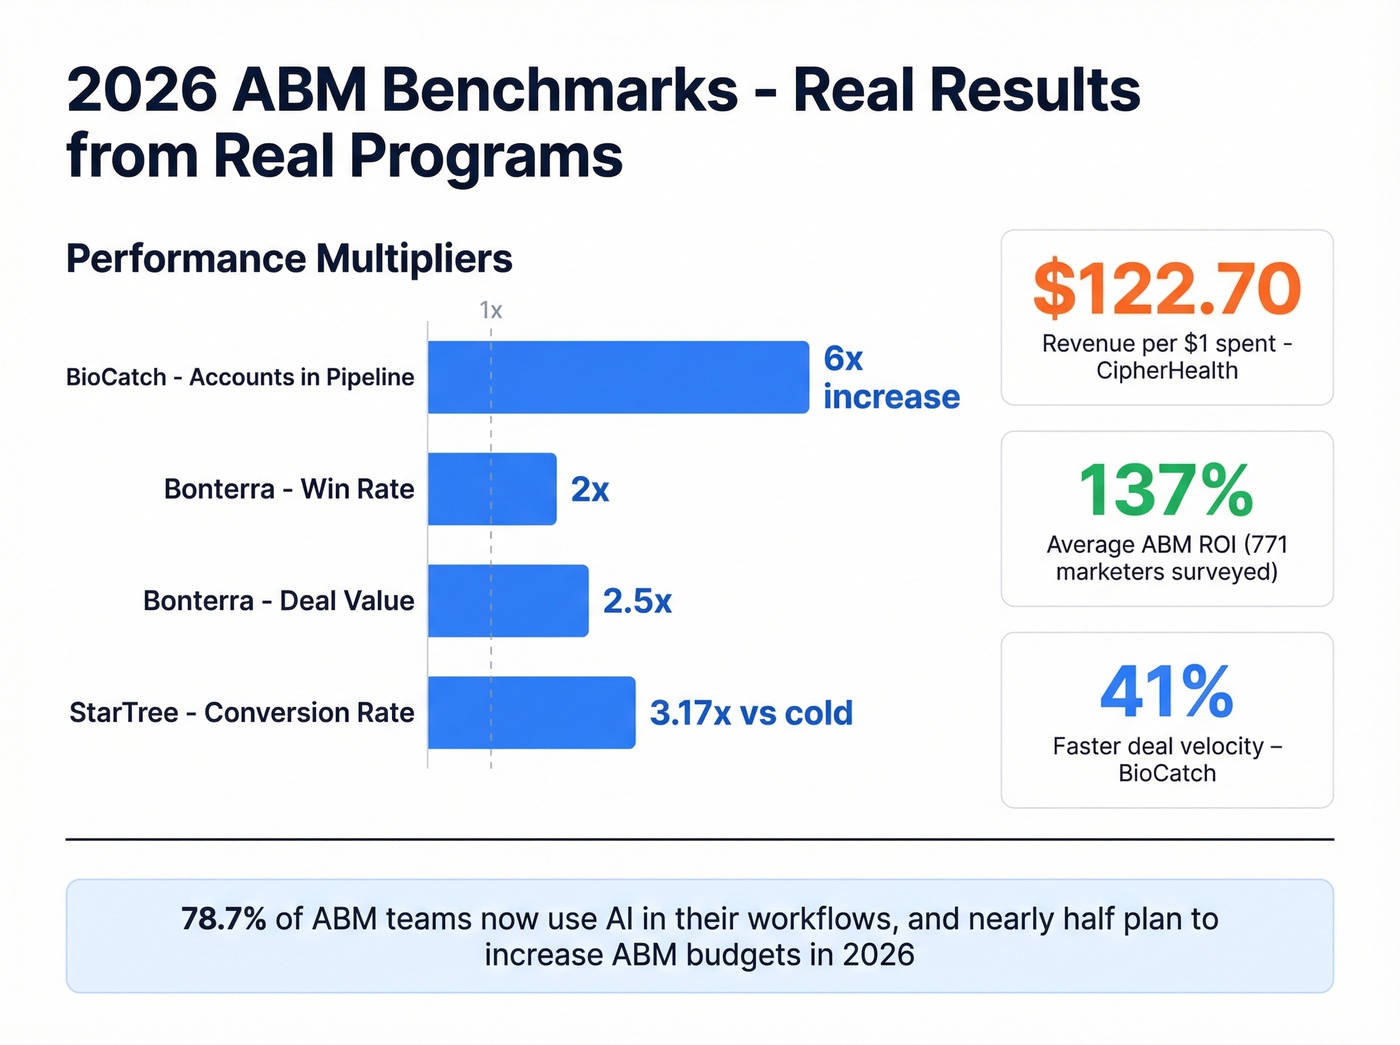
A late-2025 survey of 771 marketers found average ABM ROI of 137%, with 78.7% incorporating AI into their workflows. One practitioner shared $51M in pipeline generated from their ABM program, with 84% conversion from engagement into pipeline. Forrester data shows ABM programs deliver 21-50% higher ROI vs. non-ABM approaches.
Nearly half of respondents plan to increase ABM budgets in 2026. The signal is unmistakable: account-based marketing works when you track the right KPIs and give it time.
Let's be honest: most teams don't have an ABM problem - they have a patience problem. If your average contract value exceeds $30k and your sales cycle runs longer than 90 days, ABM will outperform demand gen. But you need three quarters of data before you'll see it. I've watched teams kill programs at 60 days and call ABM a failure. That's like planting a tree and pulling it up after a week to check the roots.
Target account coverage falls apart when a third of your emails bounce. Prospeo's 5-step verification delivers 98% email accuracy across 300M+ profiles - refreshed every 7 days, not six weeks. Build buying committee lists with 30+ filters including intent data, technographics, and headcount growth.
Stop reporting fake coverage numbers built on stale data.
Fixing ABM Attribution
Your CRM is built lead-first. ABM is account-first. That structural mismatch is why attribution breaks - campaign members are tied to people, not accounts or opportunities, and data lives in silos across intent platforms, ad tools, email, and events. (If you're rebuilding the plumbing, start with lead status and lifecycle definitions.)
The fix starts with a consistent account-level identifier. Use domain or CRM Account ID to join data across systems. Group contacts by email domain and you'll immediately surface hidden stakeholders who influence deals but never fill out forms. Getting this foundation right is the hardest part of measuring ABM success, but it's non-negotiable.
Prospeo's enrichment helps close that hidden-stakeholder gap by returning 50+ data points per contact, with a 92% API match rate. Its 7-day data refresh cycle means you're working with current org charts - not six-week-old snapshots that miss recent hires and role changes. (If you're evaluating vendors, compare approaches in data enrichment services.)
For offline touches like events and direct mail, track responses via QR codes or personalized URLs. Some teams also track engagement-minutes per account - total time stakeholders spend with your content - as an alternative to binary touch attribution. The dark funnel is real, but it doesn't have to be unmeasurable. (For offline plays, see direct mail for lead generation.)
Five ABM Measurement Mistakes
Treating ABM as a short-term campaign. Enterprise buying cycles run 6-12+ months. Measure over quarters, not weeks. If you're reporting ABM results after 30 days, you're reporting noise.
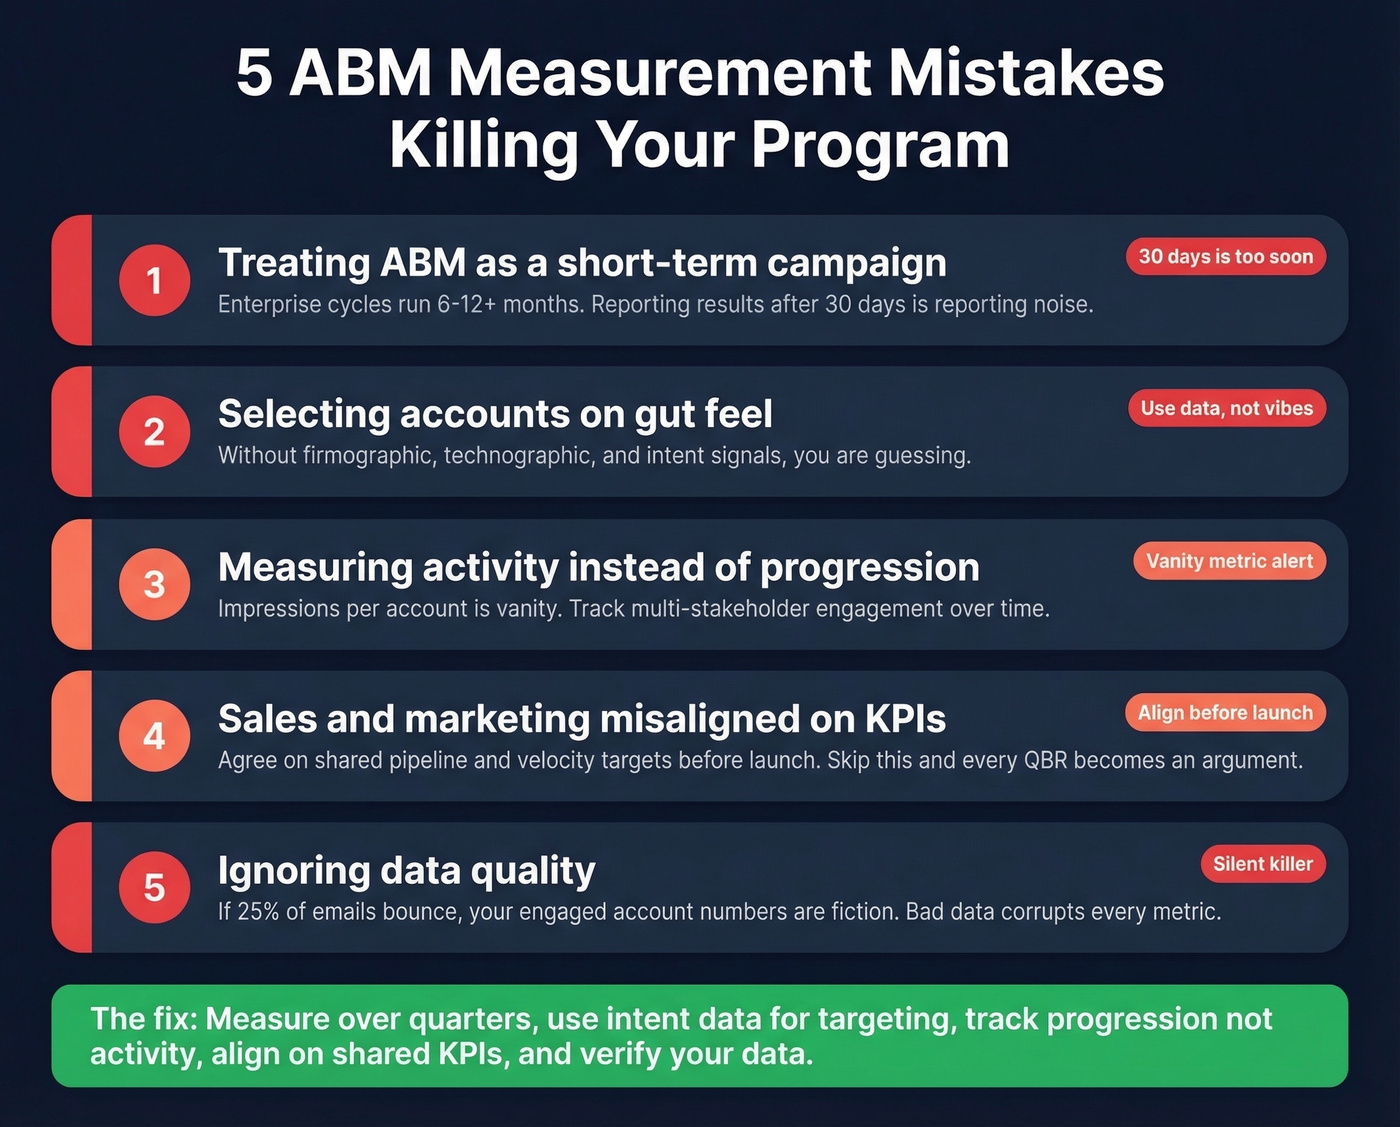
Selecting accounts on gut feel. Without firmographic, technographic, and intent signals driving your list, you're guessing. We've found that teams using intent data to build their target account lists see dramatically higher engagement rates than those relying on sales rep nominations alone. (If you need a framework, use intent based segmentation to score accounts.)
Measuring activity instead of progression. Impressions per account is a vanity metric. Track multi-stakeholder engagement instead - are more people from the buying committee interacting with your content over time?
Sales and marketing misaligned on KPIs. Agree on shared pipeline and velocity targets before launch. ABM measurement depends on both teams owning the same numbers. Skip this alignment step and you'll spend every QBR arguing about definitions instead of reviewing results. (This is also where marketing enablement prevents reporting chaos.)
Ignoring data quality. If 25% of your emails bounce, your "engaged account" numbers are fiction. Bad data doesn't just hurt deliverability - it corrupts every downstream metric you're trying to track. (If you’re fixing deliverability, start with an email deliverability guide.)
Building Your ABM Dashboard
Set up account lifecycle stages with clear triggers:
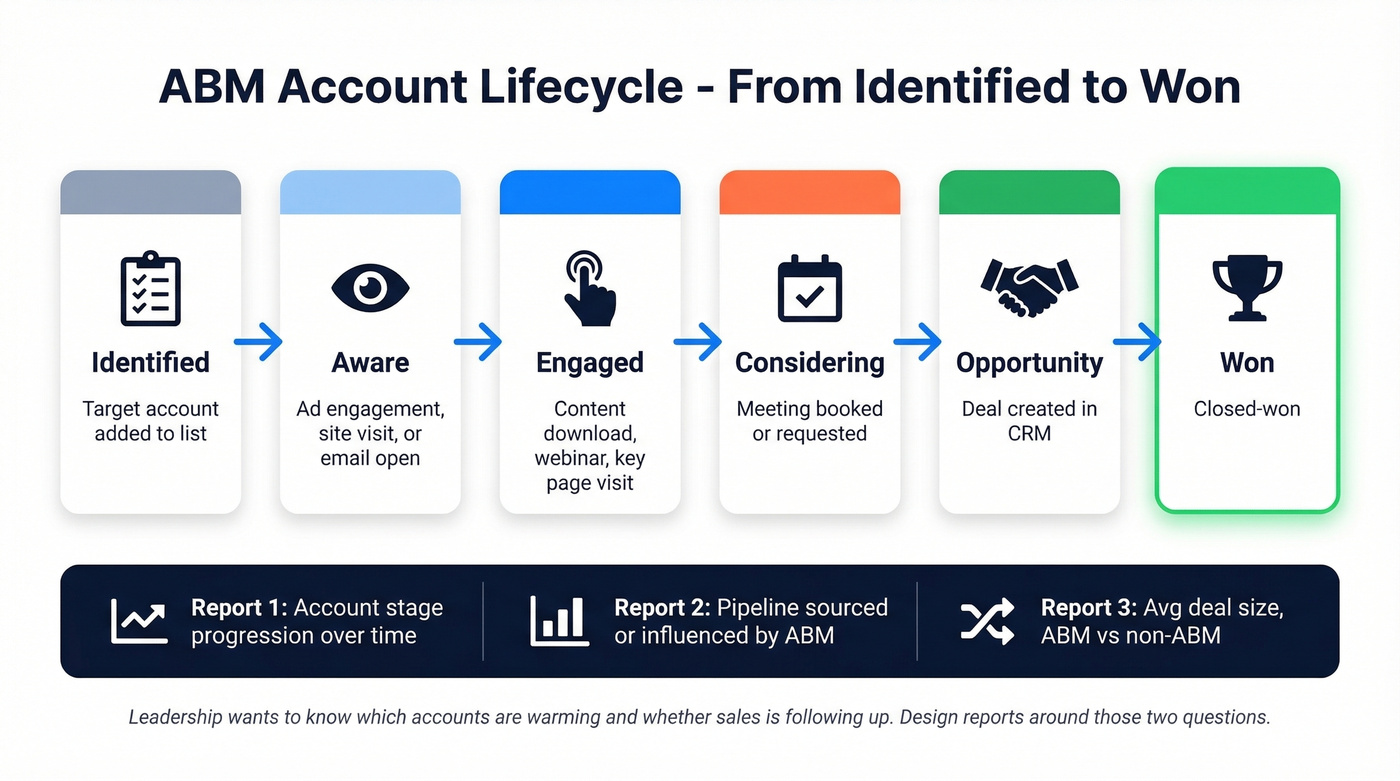
- Identified - target account added to list
- Aware - ad engagement, site visit, or email open
- Engaged - content download, webinar attendance, key page visit
- Considering - meeting booked or requested
- Opportunity - deal created in CRM
- Won - closed-won
In HubSpot, configure three properties: a Buying Role field with options like Decision Maker, Budget Holder, and Blocker; a Target Account checkbox; and an ICP Tier ranking of 1-3. Then build three starter reports - account stage progression over time, pipeline sourced or influenced by ABM, and average deal size for ABM vs. non-ABM accounts.
Leadership doesn't want a dashboard crammed with engagement metrics. They want to know which accounts are warming and whether sales is following up. Design your reports around those two questions and you'll survive every QBR.
ABM attribution breaks when hidden stakeholders never surface in your CRM. Prospeo's enrichment returns 50+ data points per contact at a 92% match rate - mapping full buying committees so your engagement and pipeline metrics reflect reality, not guesswork.
Uncover every stakeholder influencing the deal for $0.01 per email.
FAQ
How long before ABM shows measurable ROI?
Most programs need 2-4 quarters of consistent execution before revenue impact is clear. Track leading indicators like engagement progression and MQA volume monthly, while reporting pipeline contribution and deal velocity quarterly. Teams that commit to this timeframe consistently outperform those chasing 30-day wins.
What's the single most important ABM metric?
Pipeline contribution from target accounts - measured as both a percentage of total pipeline and an absolute dollar figure. It bridges marketing activity and revenue, and it's the number your CFO will ask about during every budget review.
Does bad contact data affect ABM measurement?
Absolutely. If emails bounce or reach the wrong stakeholders, your engagement and coverage metrics are fiction. Stale data is the silent killer of ABM programs because it corrupts metrics without anyone noticing until the QBR goes sideways. Tools like Prospeo verify emails at 98% accuracy on a 7-day refresh cycle, which means your dashboard reflects real engagement rather than phantom activity.
What's the difference between ABM and demand gen metrics?
Demand gen tracks individual leads through a funnel - MQLs, SQLs, conversion rates. ABM measurement tracks account-level progression: how many stakeholders are engaged, how fast the account moves through pipeline stages, and total revenue per account. The unit of analysis shifts from person to buying committee, and that shift changes everything about how you build reports and attribute revenue.