How to Measure Account-Based Marketing in 2026: The Practitioner's Playbook
Your CMO just asked for ABM ROI and you're staring at a spreadsheet of engagement scores that don't connect to a single closed deal. You're not alone - 47% of ABM practitioners can't prove ROI, and 43% say sales-marketing alignment is still broken. Every guide on how to measure account-based marketing is written by an ABM platform vendor and conveniently concludes you need their platform. This one won't.
We've watched too many teams drown in dashboards that measure activity instead of outcomes. If you're serious about proving ABM works, you need a framework rooted in revenue, not vanity metrics.
The Quick Version
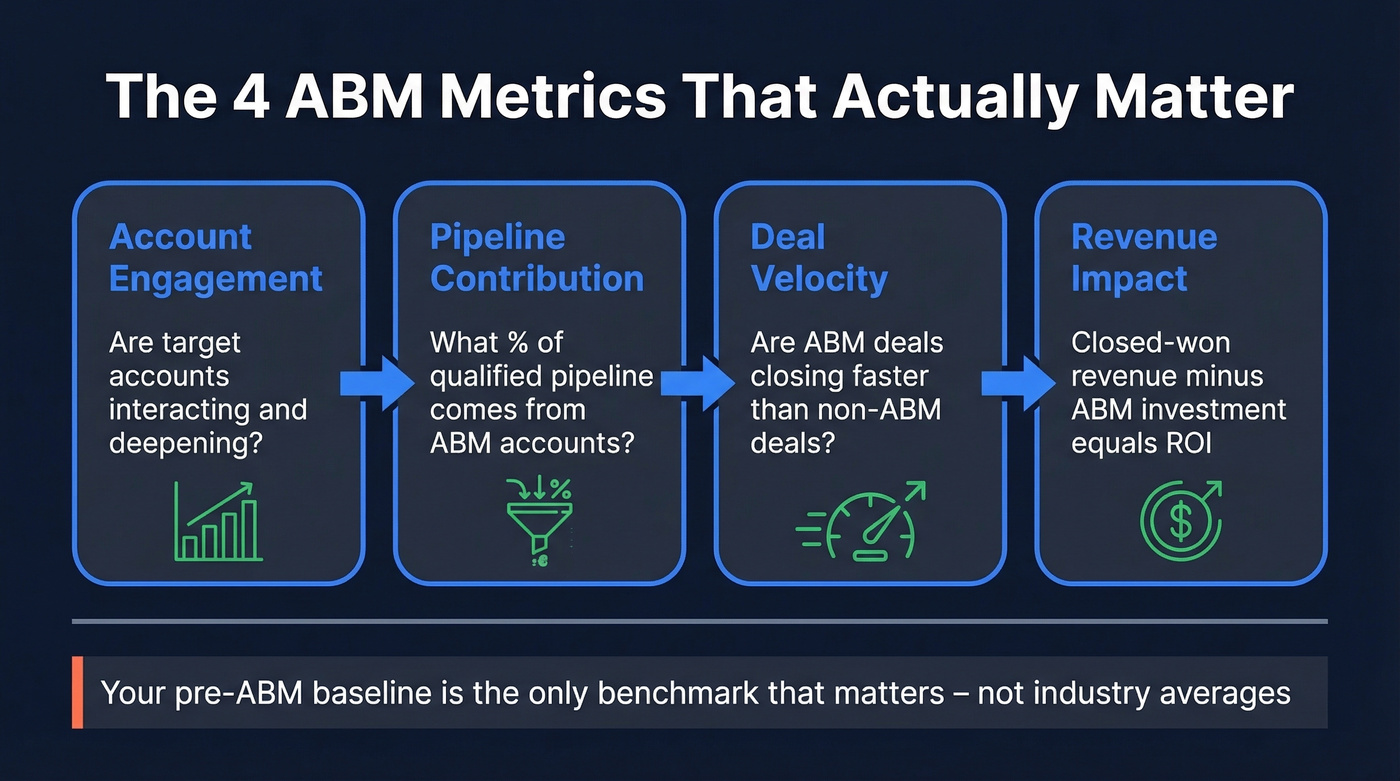
Four metrics matter. Everything else is a vanity layer:
- Account engagement - are target accounts interacting with you, and is that interaction deepening?
- Pipeline contribution - how much qualified pipeline did ABM accounts generate? One enterprise fintech team tracked $51M in pipeline with 84% conversion across 28 logos. That's what pipeline-first measurement looks like.
- Deal velocity - are ABM-sourced deals closing faster than non-ABM deals?
- Revenue impact - what's the actual closed-won revenue and ROI?
Here's the thing: stop looking for ABM benchmarks. Practitioners on r/b2bmarketing keep asking for "robust benchmarks" and getting silence back, because every ABM program targets different accounts with different deal sizes in different cycles. Your pre-ABM baseline is the only benchmark that matters.
The Four ABM Metrics That Matter
Account Engagement
Engagement is the leading indicator - whether target accounts are visiting your site, opening emails, attending webinars, requesting demos. The key shift from demand gen: you're scoring at the account level, not the contact level. An account with three people attending a webinar is more engaged than one with a single VP who opened an email.
Track engagement score trends over time, not snapshots. A flat score after 90 days of ABM activity means something's broken.
Market Reach gives you the denominator before pipeline even enters the picture:
Market Reach = (Reachable accounts / Addressable accounts) x 100
If you can reach 600 out of 1,000 addressable accounts, your market reach is 60%. Below 50%, you've got a coverage problem - and no amount of clever creative will fix a list that's too thin. (If you need to tighten your TAM math first, start with your addressable market.)
Pipeline Contribution
This is where ABM earns its budget. Measure what percentage of qualified pipeline comes from your target account list versus the rest of your funnel. If ABM accounts aren't generating disproportionate pipeline relative to their share of your total addressable market, the targeting isn't working. Full stop.
Deal Velocity
Pipeline velocity tells you whether ABM is accelerating deals or just generating more of them at the same sluggish pace.
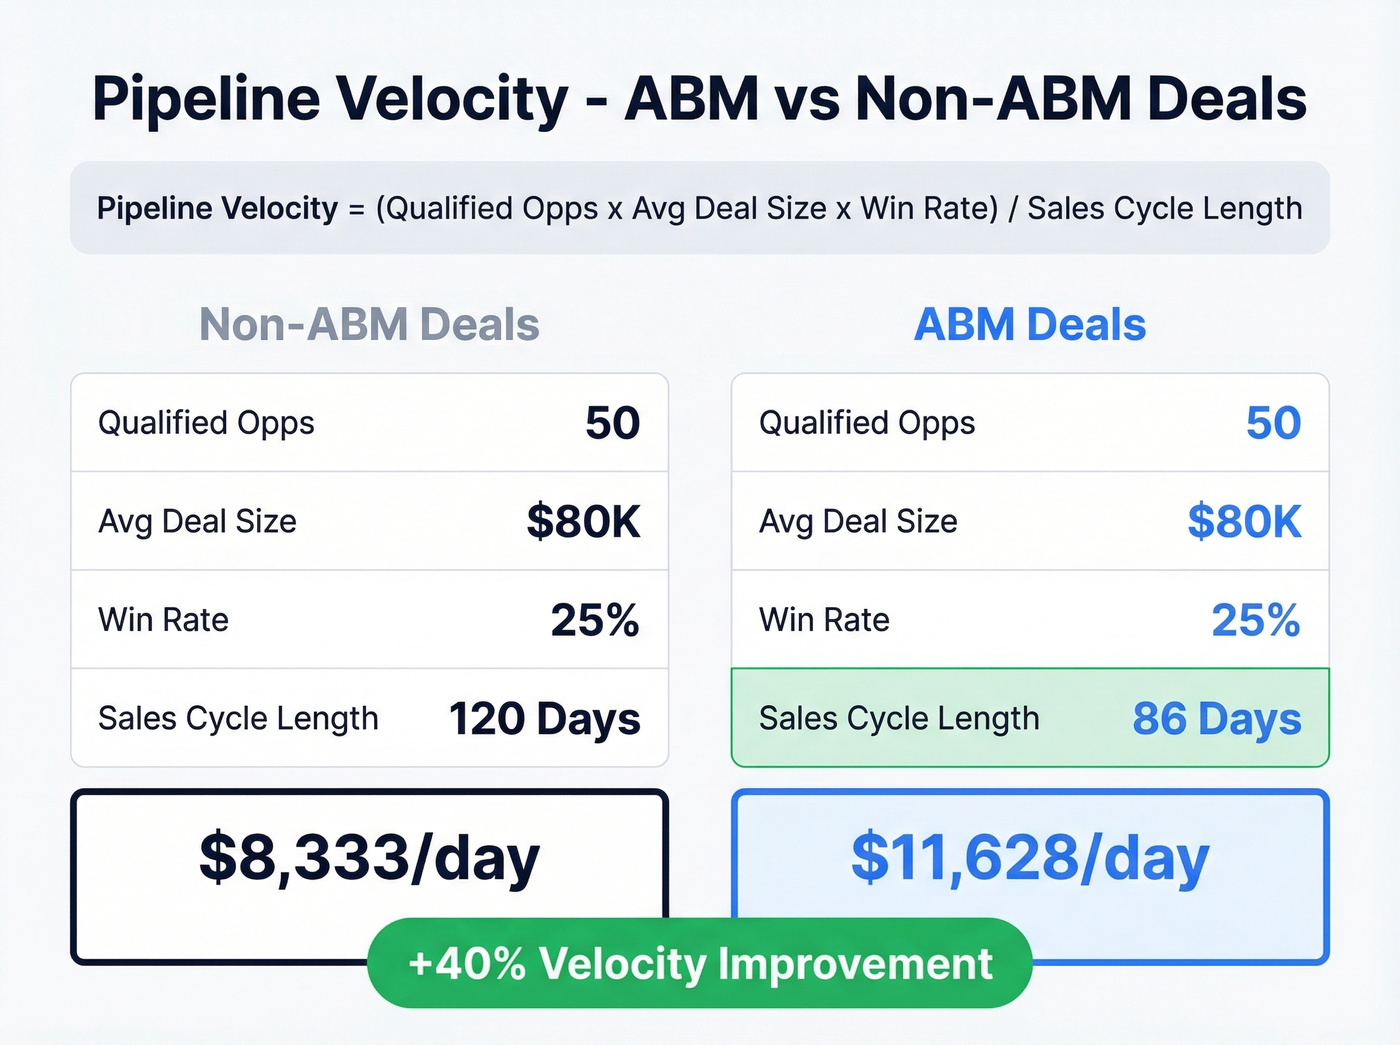
Pipeline Velocity = (Qualified opps x Avg deal size x Win rate) / Sales cycle length
Let's break this down with real numbers. Say you've got 50 qualified opportunities at $80K average, a 25% win rate, and a 120-day cycle - that's $8,333/day in pipeline throughput. If ABM compresses that cycle to 86 days, velocity jumps to $11,628/day, a 40% improvement. Run the same formula for non-ABM deals and compare. That delta is the whole story. (To pressure-test the rest of your funnel math, use a simple set of funnel metrics alongside velocity.)
Revenue Impact
Closed-won revenue from ABM accounts, minus total ABM investment, divided by total ABM investment, times 100. Some roundups cite 137% average ROI and 28% faster cycles for mature programs - treat those as directional, not gospel. Track improvement quarter over quarter against your own baseline.
Build Your Engagement Score
Here's a point system you can steal and adapt:
| Action | Points |
|---|---|
| Sales meeting booked | 50 |
| Webinar attended | 25 |
| Pricing page visit | 15 |
| Content download | 10 |
| Ad click-through | 5 |
| Email open | 2 |
Set your "engaged account" threshold at 50-75 points. Any account crossing that line gets flagged for sales follow-up.
Two details that matter. First, apply decay windows - a pricing page visit from 90 days ago isn't the same signal as one from last week. Use 30/60/90-day decay multipliers (100% / 50% / 25%) to keep scores current. In our experience, teams that skip decay end up chasing accounts that went cold months ago, wasting cycles their SDRs can't afford.
But scores are only as good as the underlying contacts. If 30% of your email list bounces, your engagement model is built on phantom activity. Prospeo verifies contacts on a 7-day refresh cycle with 98% email accuracy, so the people feeding your scoring model are real humans - not dead inboxes your MAP is happily marking as "engaged." (If bounce is a recurring issue, fix it at the source with an email bounce rate audit.)
Your engagement scoring model collapses when 30% of contacts bounce. Prospeo's 5-step verification and 7-day data refresh cycle ensure every account in your ABM program maps to real, reachable buyers - not dead inboxes inflating your scores.
Stop measuring phantom engagement. Start with 98% accurate contact data.
Measuring ABM by Program Type
You can't measure a net-new pipeline program the same way you measure a renewal campaign. Each ABM program type needs different metric sets:
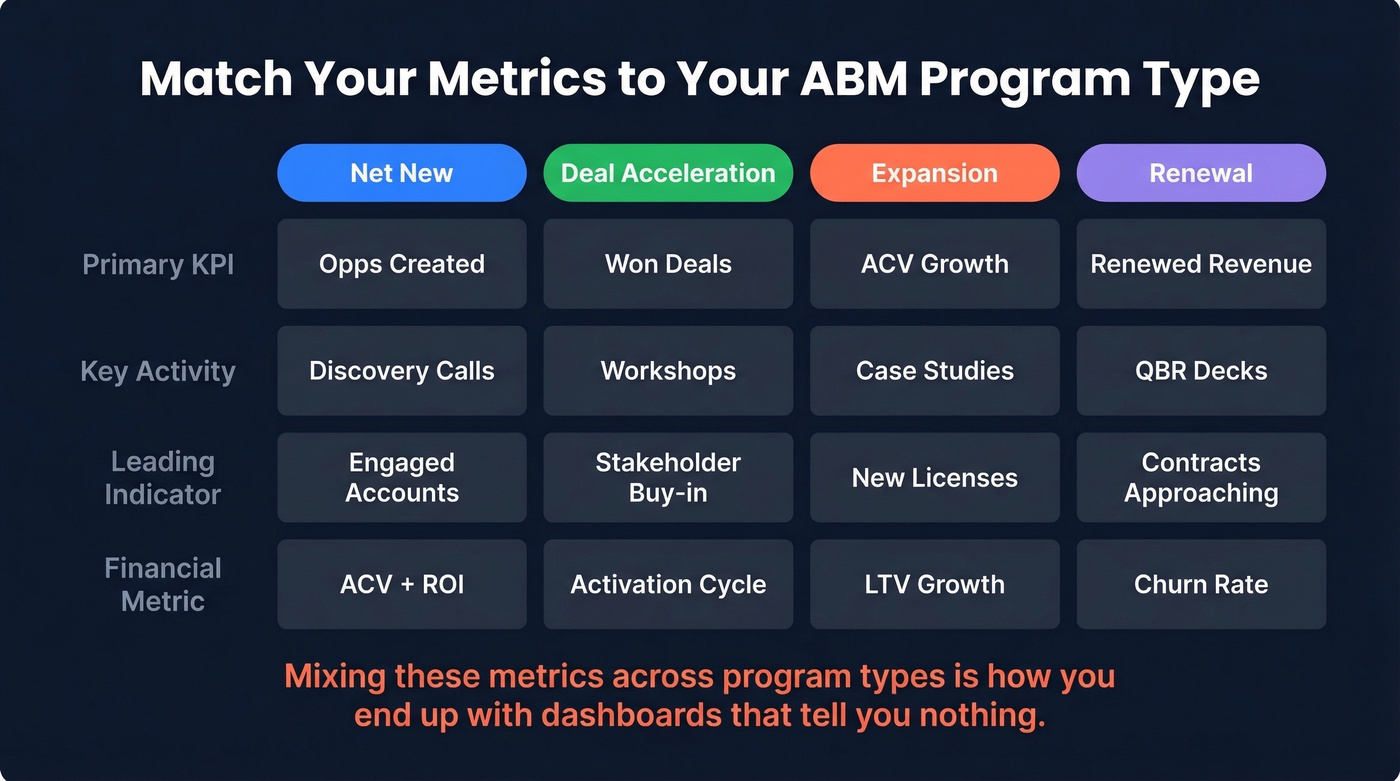
| Metric Category | Net New | Deal Accel. | Expansion | Renewal |
|---|---|---|---|---|
| Primary KPI | Opps created | Won deals | ACV growth | Renewed rev. |
| Key Activity | Discovery calls | Workshops | Case studies | QBR decks |
| Leading Indicator | Engaged accts | Stakeholder buy-in | New licenses | Contracts approaching |
| Financial | ACV + ROI | Activation cycle | LTV growth | Churn rate |
Net new programs live and die on pipeline creation. Deal acceleration should compress sales cycles. Expansion should grow ACV within existing accounts. Renewal should hold the line on churn. (If you’re measuring retention outcomes, align renewal reporting with a clean churn analysis.)
Mixing these metrics across program types is how you end up with dashboards that tell you nothing.
ABM Metrics vs. Demand Gen Metrics
This distinction trips up more teams than any technical challenge. Demand gen measures volume - MQLs, form fills, cost per lead. ABM measures depth - account penetration, buying committee coverage, deal acceleration. If your ABM dashboard still has an MQL target on it, you're running demand gen with a target account list taped on top. That's not ABM. It requires a fundamentally different lens, one focused on account progression rather than lead volume. (If you still need a scoring baseline, map ABM engagement to your existing lead scoring rules.)
Five Mistakes That Kill ABM Reporting
1. Using MQL goals for ABM programs. ABM goals should be percentage of target accounts moving through funnel stages - interested, considering, selecting, closed won. MQL volume creates misaligned incentives here.
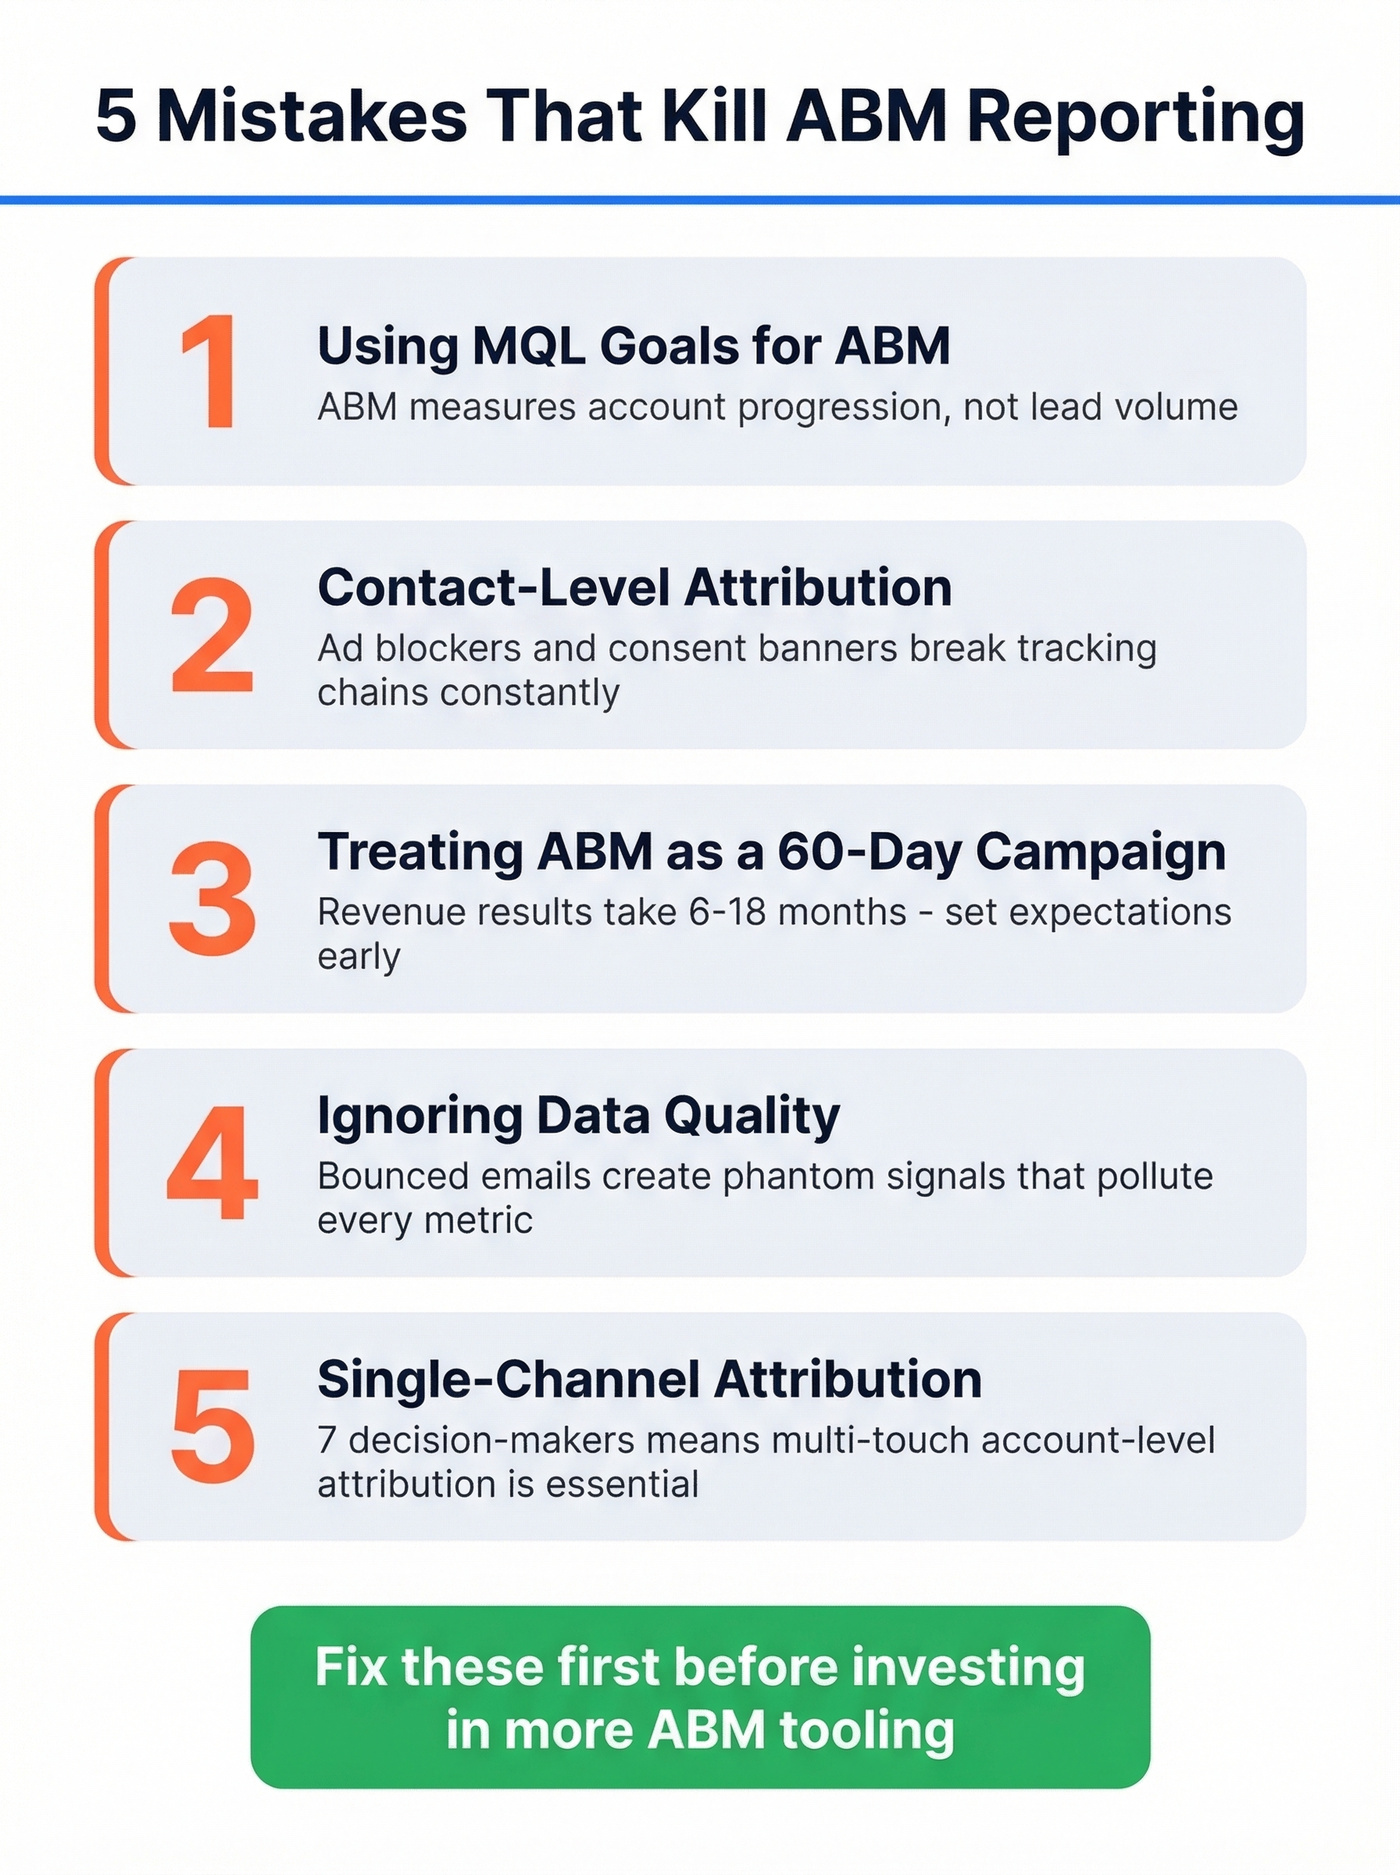
2. Contact-level attribution creating false negatives. HubSpot's attribution requires a tracking pixel + platform cookie + contact creation + marketing contact designation + deal association - all within a 90-day window. Ad blockers and consent banners break this chain constantly. You're systematically undercounting ABM influence, and it's making your program look worse than it is. (If you’re troubleshooting tracking, start with the mechanics of an email tracking pixel.)
3. Treating ABM as a 60-day campaign. ABM is a 6-18 month strategy. Set expectations with leadership early: engagement metrics in months 1-3, pipeline in months 3-9, revenue in months 6-18. Skip this conversation and you'll be defending a "failed" program that just needed more runway.
4. Ignoring data quality. Look, if your engagement scores are built on bounced emails, they're fiction. I've seen scores swing 30%+ just from cleaning up invalid contacts. Prospeo's 5-step verification - catch-all handling, spam-trap removal, honeypot filtering - ensures your scoring reflects real buying committee activity, not ghosts. (If you suspect list poisoning, run a dedicated spam trap removal process.)
5. Single-channel attribution in a multi-touch journey. B2B buying decisions involve about seven decision-makers. Attributing a deal to the last webinar one of them attended ignores every other touchpoint across the buying committee. Multi-touch, account-level attribution is the only model that reflects ABM reality. (For the sales side of ABM execution, align plays with account-based selling best practices.)
Pipeline velocity depends on reaching the right buying committee members fast. Prospeo gives you 300M+ verified profiles with 30+ filters - including intent data across 15,000 topics - so your ABM accounts convert to pipeline, not just dashboard noise.
Layer intent signals on verified contacts for $0.01 per email.
Your ABM Dashboard
Build your dashboard in three blocks with two review cadences.
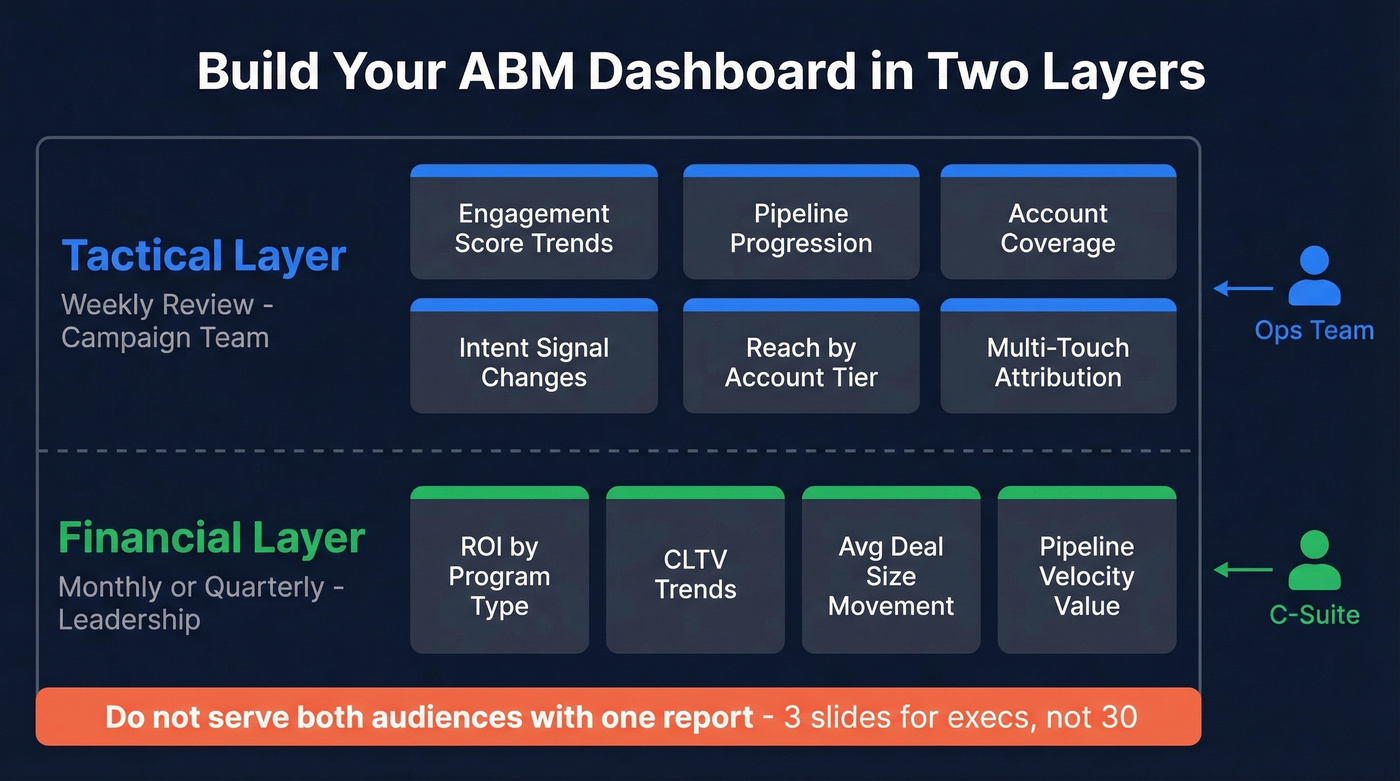
The tactical layer - engagement score trends, pipeline progression, account coverage, intent signal changes - gets a weekly review from the team running plays. Campaign performance sits alongside it: reach by account tier, conversion rates by channel, and multi-touch attribution impact. (To keep the exec view clean, roll this up into a single pipeline health snapshot.)
The financial layer rolls up monthly or quarterly for leadership: ROI by program type, CLTV trends, average deal size movement, and pipeline velocity value. Don't try to serve both audiences with one report. When presenting ABM results at the executive level, keep the story tight - pipeline sourced, deals accelerated, revenue closed. Three slides, not thirty.
FAQ
What's a good ABM ROI benchmark?
Some roundups cite roughly 137% average ROI for mature programs, but standardized benchmarks barely exist. Your baseline should be your own pre-ABM pipeline metrics. Track improvement over historical performance, not industry averages aggregating wildly different programs and deal sizes.
How do I calculate ABM ROI?
ROI = (Revenue from ABM accounts - Total ABM investment) / Total ABM investment x 100. Include direct costs like ad spend, platform fees, and content production, plus indirect costs like employee time and training. A $400K investment generating $800K in closed-won revenue equals 200% ROI.
How does contact data quality affect ABM measurement?
Every bounced email is a phantom signal polluting your metrics. Stale contacts inflate engagement scores and deflate coverage ratios. Tools like Prospeo catch dead emails before they corrupt your data - 98% accuracy, refreshed every 7 days - so your ABM metrics reflect actual buying committee activity, not noise.
Why is ABM harder to measure than demand gen?
ABM targets a finite set of accounts with long sales cycles and multiple stakeholders, so traditional funnel metrics like MQLs and cost per lead don't apply. You need account-level attribution across channels and buying committee members - a fundamentally different measurement architecture than demand gen's contact-level tracking.