12 Inside Sales Metrics Worth Tracking (With Benchmarks)
Your SDR team hit activity targets last quarter - 80+ calls a day, 40+ emails - but pipeline created dropped 20%. The dashboards were green. The revenue was red.
That disconnect is what happens when you track inside sales metrics that measure motion instead of progress. Reps spend 28% of their time actually selling, and only 7% of sales orgs achieve forecast accuracy above 90%. The gap between "busy" and "productive" has never been wider.
If you only track three KPIs daily, make them connect rate, meetings completed, and pipeline velocity. Everything else is context. The 12 metrics below are organized around what reps control, what the pipeline reveals, and what the business earns.
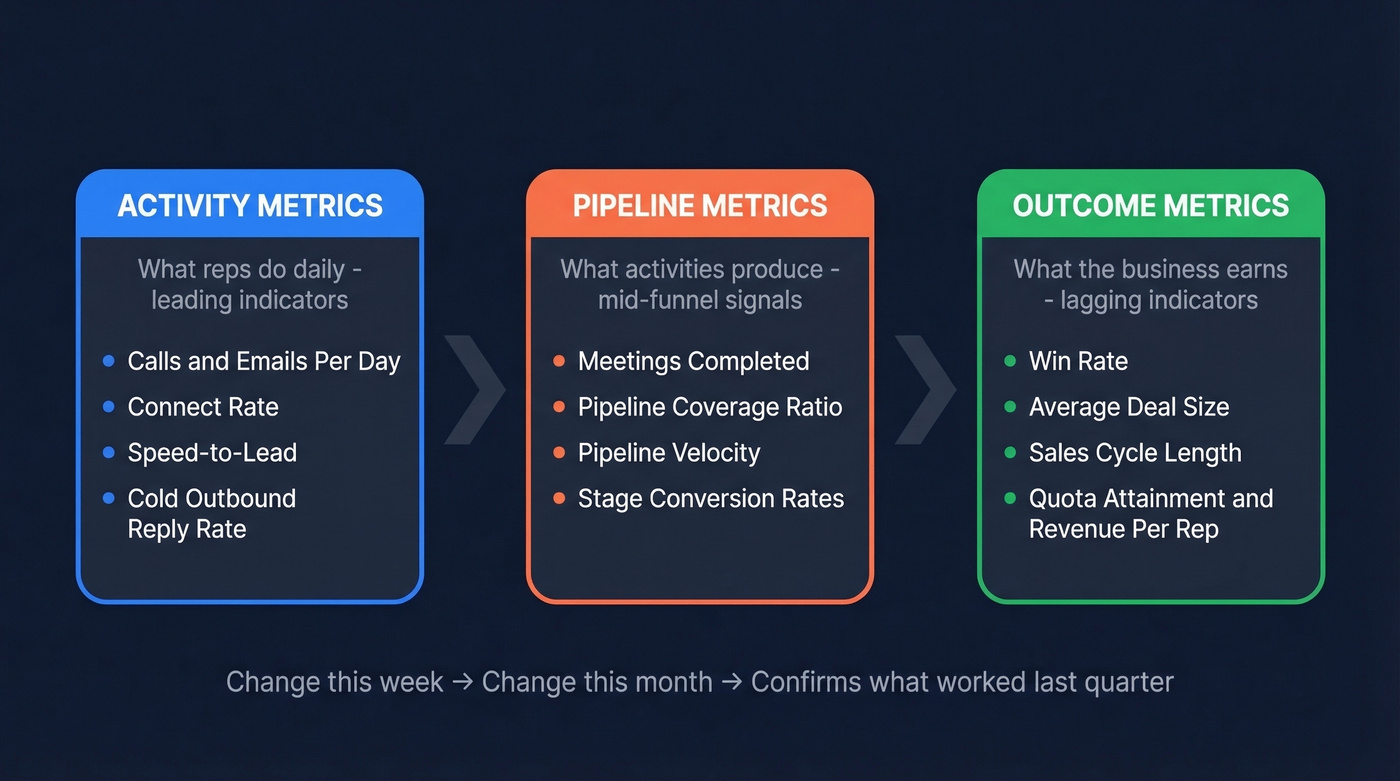
The Framework: Activity, Pipeline, Outcomes
Activity metrics measure what reps do daily - calls, emails, response times. These are leading indicators you can change this week. Pipeline metrics measure what those activities produce - meetings, coverage, velocity. Outcome metrics measure what the business earns - win rate, cycle length, quota attainment. They're lagging indicators that tell you whether the first two tiers are working.
Sales Activity Metrics
Calls and Emails Per Day
Formula: Total outreach touches / selling days
High-volume SMB teams should hit 80-100 calls per day. Named-account teams running deeper research per touch: 30-50. Email volume typically runs 30-50 per rep daily. Below these ranges with weak pipeline? Capacity problem. Above them with weak pipeline? Targeting problem.
Context matters. Bridge Group's SDR report shows the average SDR:AE ratio sits at 1:2.4, with ramp time averaging 3.0 months. A rep in month two shouldn't carry the same daily number as a tenured SDR, and setting identical targets across experience levels is one of the fastest ways to burn out new hires while learning nothing useful from the data.
Connect Rate
Formula: Conversations / total dials x 100
Most B2B teams land in the 15-22% range. Below 3% isn't a rep problem - it's a data problem. Your phone numbers are wrong, your contacts changed roles, or you're dialing switchboards instead of direct lines. Before coaching reps on openers, audit your contact data.
We've seen teams spend weeks reworking call scripts when the real issue was that 40% of their numbers were disconnected. Prospeo carries 125M+ verified mobile numbers with a 30% pickup rate, which gives connect rate benchmarks something real to stand on.
Speed-to-Lead
Formula: Timestamp of first contact - timestamp of lead creation
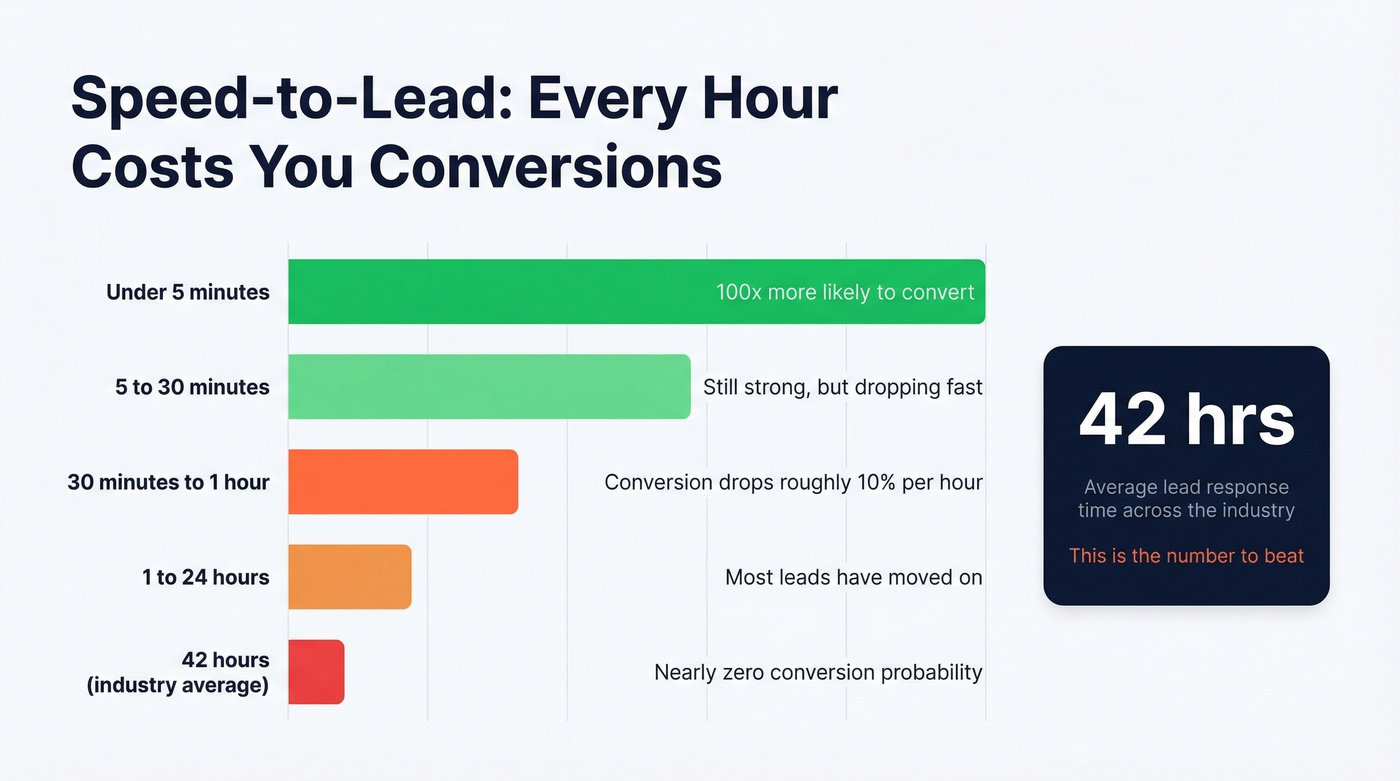
Every hour of delay cuts conversion rates by roughly 10%. Contacting a lead within 5 minutes can increase conversion up to 100x versus waiting 30 minutes. Average lead response time across the industry? A dismal 42 hours.
But speed-to-lead is only half the story. Speed-to-qualification - routing to the most relevant seller who can have a meaningful conversation - matters more than raw response time. A fast reply from the wrong person still wastes the buyer's momentum.
Cold Outbound Reply Rate
Formula: Unique replies / unique prospects contacted x 100
Top-tier outbound teams hit 8-12% reply rates. Below 3% means your messaging, targeting, or list quality needs serious work. A high activity count with a sub-3% reply rate is just expensive noise.
If you need a baseline for what “good” looks like, start with proven sales follow-up templates and iterate from there.
Pipeline Performance Metrics
Meetings Completed (Not Booked)
Track meetings completed, not meetings booked. The gap between the two is your show rate, and it's bigger than most managers realize. Industry average: 50-60%. Strong teams with good qualification and confirmation workflows hit 70-80%.
Here's a scenario we see constantly: a manager reports 20 meetings booked, celebrates in the team Slack, then discovers only 12 happened. That pipeline forecast was 40% inflated before the week even started. Track the number that actually matters.
Pipeline Coverage Ratio
Formula: Total pipeline value / quota
Standard target: 3-4x. Below 2x and you're in danger. Above 5x is also a red flag - it usually means reps are stuffing the pipe with unqualified opportunities to make the dashboard look healthy.
Let's be honest: teams celebrating 4x coverage without auditing time-in-stage are the ones most surprised at quarter-end. One pipeline audit found 75% of the pipeline was dead weight. That's not 4x coverage. That's 1x with a bunch of fiction.
Pipeline Velocity
Formula: (SQLs x avg deal size x win rate) / sales cycle length in days
This is the single best composite metric for any inside sales team. It synthesizes volume, value, conversion, and speed into one number, and a team with fewer deals but faster cycles and higher win rates will outperform a massive pipeline that moves slowly every time. Track velocity monthly - a declining trend with stable pipeline size means deals are stalling or win rates are dropping.
Most teams would improve faster by obsessing over pipeline velocity than by adding headcount. Velocity exposes the real bottleneck; hiring just spreads the same problems across more reps.
Stage Conversion Rates
Formula: Opportunities in next stage / opportunities in current stage x 100
The biggest bottleneck in most B2B funnels is MQL to SQL, which converts at just 15-21%. Lead-to-opportunity conversion for strong teams runs 13-15%. Below 8% means your qualification criteria or discovery process is broken. Track each stage transition separately - the bottleneck tells you exactly where to focus coaching.
If you want a clean way to define and measure each stage, align this with your B2B sales funnel definitions.
A sub-3% connect rate isn't a coaching problem - it's a data problem. Prospeo's 125M+ verified mobile numbers deliver a 30% pickup rate, and 98% email accuracy means your reps stop wasting dials on disconnected numbers and start having real conversations.
Fix your connect rate before you fix your call scripts.
Sales Outcome Metrics
Win Rate
Formula: Deals won / deals quoted x 100
Healthy win rates land between 20-30%, but the channel matters enormously. Referral-sourced deals close at 25.56%; cold-call-sourced deals close at 9.38%. If you're blending these into a single win rate, you're hiding the real story. Segment by source.
To improve win rate without gaming the funnel, tighten sales execution and stage exit criteria.
Average Deal Size
Formula: Total revenue won / number of deals won
Bridge Group data puts the median ACV for B2B SaaS at $47K. Track this monthly because it drifts - reps under quota pressure start discounting or chasing smaller deals. A declining average deal size with stable win rate is a pricing or positioning problem, not a sales execution problem.
Sales Cycle Length
Formula: Sum of days to close for all won deals / number of won deals
Inside sales cycles run 30-90 days, with mid-market SaaS landing in the 60-90 day range. If your cycle is stretching quarter over quarter, look at multi-threading and whether reps are engaging economic buyers early enough. Cycle creep is one of the quietest killers of quarterly numbers.
If cycle length is creeping up, revisit your discovery questions and qualification rigor.
Quota Attainment
Formula: Reps at or above quota / total reps x 100
Bridge Group's study of 172 B2B SaaS companies found only 51% of AEs hit quota - down from 66% in 2022. Q4 numbers were even worse: average attainment dropped to 43.14%. Separately, Lighter Capital's benchmarks show the S&M efficiency multiple has fallen from 6.08x to 3.19x. Every sales dollar goes half as far as it did two years ago. Quotas need to reflect that reality.
If you’re rebuilding targets, pair quota attainment with sales operations metrics so you can separate rep performance from system constraints.
Revenue Per Rep
Formula: Total revenue / number of quota-carrying reps
Top-quartile inside sales reps generate $750K-$1.2M per year. Bottom quartile sits at $300K-$400K. If you're below $400K per rep, the problem is structural - not motivational. Skip the pep talks and look at territory design, tool stack, and lead quality instead.
This is also where a better sales prospecting database can move the needle fast.
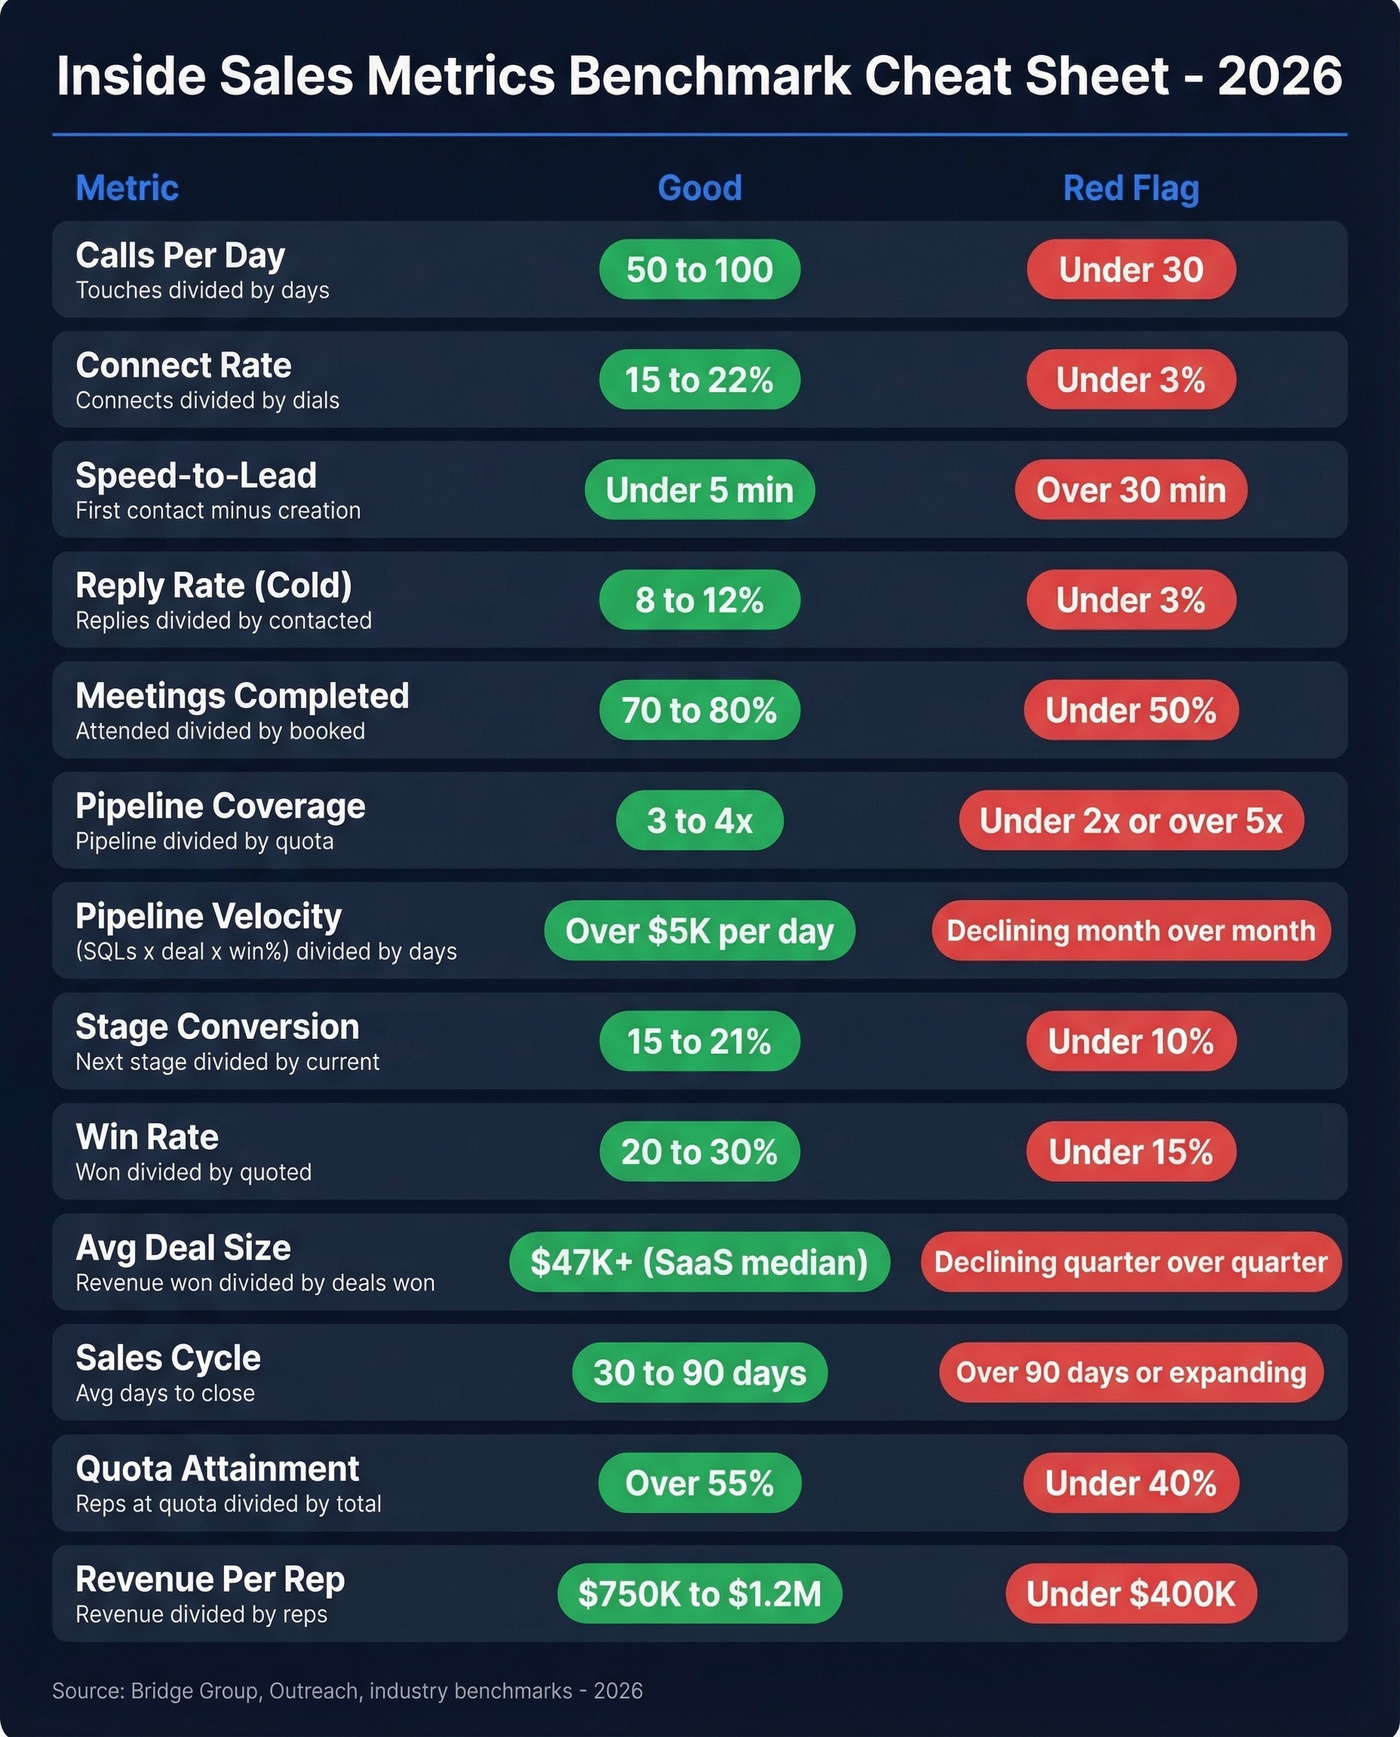
The Benchmark Cheat Sheet
| Metric | Formula | Good | Red Flag |
|---|---|---|---|
| Calls/day | Touches / days | 50-100 | <30 |
| Connect rate | Connects / dials | 15-22% | <3% |
| Speed-to-lead | First contact - creation | <5 min | >30 min |
| Reply rate (cold) | Replies / contacted | 8-12% | <3% |
| Meetings completed | Attended / booked | 70-80% | <50% |
| Pipeline coverage | Pipeline / quota | 3-4x | <2x or >5x |
| Pipeline velocity | (SQLs x deal x win%) / days | >$5K/day (mid-market) | Declining MoM |
| Stage conversion (MQL to SQL) | Next stage / current | 15-21% | <10% |
| Win rate | Won / quoted | 20-30% | <15% |
| Avg deal size | Revenue won / deals won | >=$47K (SaaS median) | Declining QoQ |
| Sales cycle | Avg days to close | 30-90 days | >90 days or expanding QoQ |
| Quota attainment | Reps at quota / total | >55% | <40% |
| Revenue per rep | Revenue / reps | $750K-$1.2M | <$400K |
KPIs That Mislead Sales Teams
A LinkedIn poll of sales practitioners asked which metric is most dangerous to obsess over. The results: 47% said CRM activity counts, 37% said pipeline size, 11% said meetings booked.
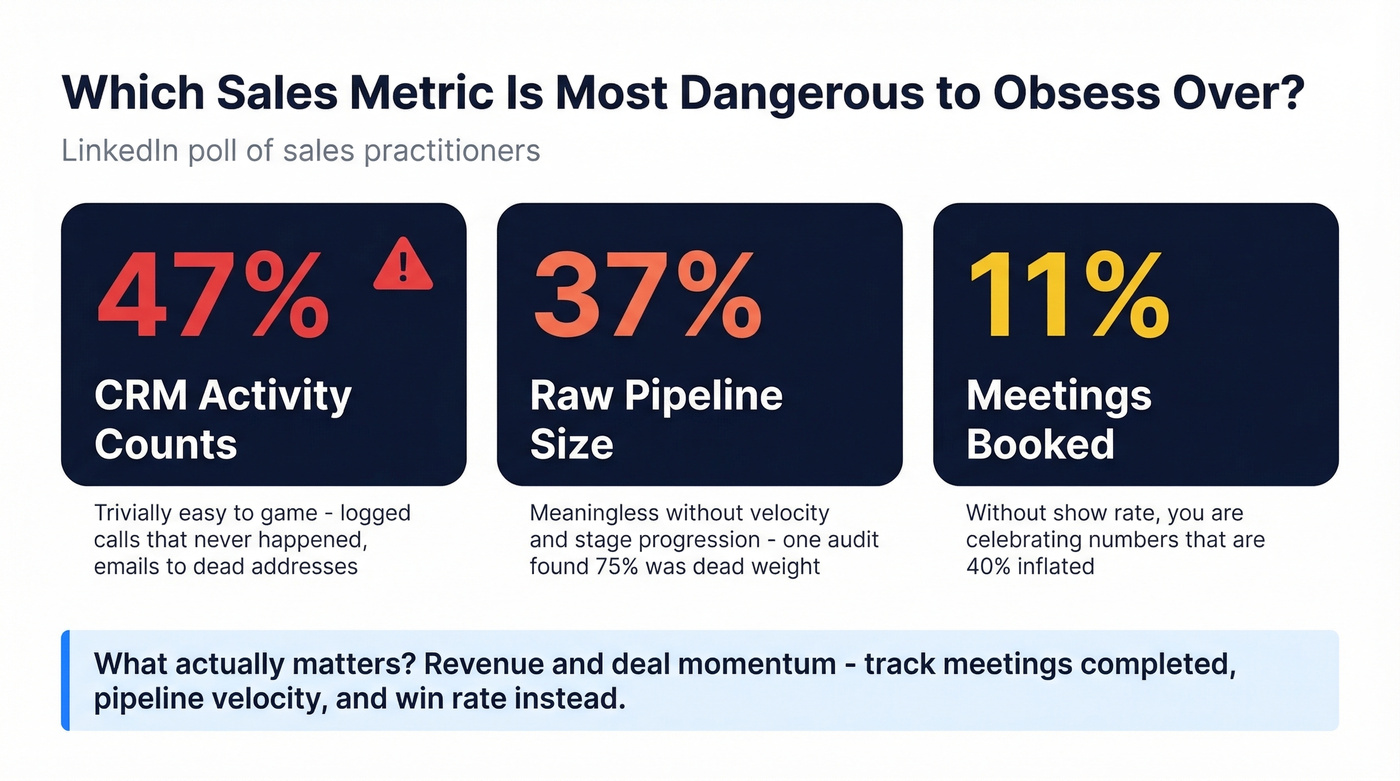
CRM activity counts are the worst offender. They're trivially easy to game - logged calls that never happened, emails sent to dead addresses. The consensus on r/sales is pretty clear: managing by activity counts creates a culture of box-checking, not selling. Practitioners consistently name revenue and deal momentum as the numbers that actually matter.
Raw pipeline size is meaningless without velocity and stage progression. Meetings booked without show rate is the same trap. Track meetings completed and meeting-to-opportunity conversion instead.
How to Actually Track This
The best dashboard is useless if the data feeding it is wrong. CRM dashboards correlate with a 29% increase in sales, but those numbers assume clean underlying data.
Here's the thing: if 35% of your emails bounce and half your phone numbers are disconnected, your connect rate, meeting rate, and pipeline metrics are all lying to you. We've seen teams diagnose a "messaging problem" when the actual root cause was rotten contact data - stale records from a provider that refreshes every six weeks.
If you’re cleaning this up, start with data enrichment and a repeatable lead generation workflow.
Prospeo runs a 7-day data refresh cycle against 300M+ professional profiles, compared to the industry average of 6 weeks. Snyk's 50-person AE team saw bounce rates drop from 35-40% to under 5% after switching, and AE-sourced pipeline jumped 180%. That's what happens when your inside sales metrics finally measure reality instead of stale records.
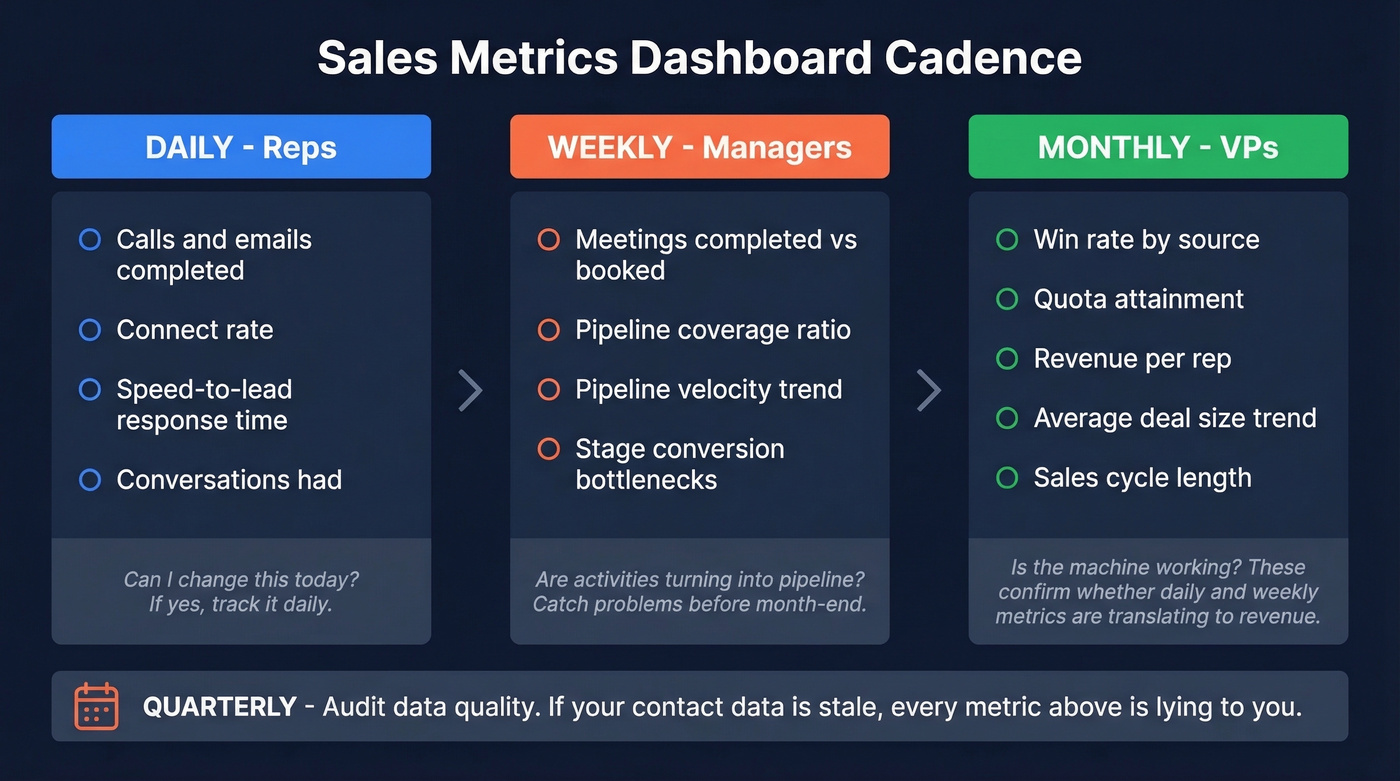
Set a dashboard cadence: daily for reps (activity and connect rate), weekly for managers (pipeline coverage and velocity), monthly for VPs (win rate, quota attainment, revenue per rep). Audit data quality quarterly - it's the foundation everything else sits on.
Pipeline velocity depends on every variable being clean - and bad contact data silently kills SQLs, inflates cycle length, and tanks win rates. Prospeo refreshes 300M+ profiles every 7 days, so your reps reach real buyers at $0.01 per email instead of chasing ghosts.
Stop forecasting on stale data. Start with contacts that connect.
FAQ
What's the difference between inside and outside sales metrics?
Inside sales metrics emphasize remote activity - calls, emails, connect rate, speed-to-lead. Outside sales metrics focus on face-to-face meetings, travel ROI, and territory coverage. The line is blurring fast: 40% of sales pros have closed $500K+ deals without meeting the buyer in person.
How many KPIs should a sales team track?
Ten to twelve maximum, organized by activity, pipeline, and outcome tiers. Pick three for daily rep dashboards - connect rate, meetings completed, and pipeline velocity. More than twelve creates dashboard fatigue and dilutes focus.
How does data quality affect sales performance metrics?
Bad contact data corrupts every downstream metric. Wrong phone numbers tank connect rate; bounced emails destroy reply rate. Meritt cut bounce rates from 35% to under 4% and tripled weekly pipeline to $300K after switching to verified data - proof that fixing the data layer fixes the metrics.
What's a good pipeline velocity benchmark?
For mid-market B2B SaaS, target above $5K per day in pipeline velocity. Calculate it as (SQLs x average deal size x win rate) / sales cycle days. A declining velocity trend with stable pipeline size signals stalling deals or dropping win rates - investigate before adding headcount.