Lead Analytics: Benchmarks, Scoring Models, and the Data Quality Problem Nobody Talks About
Only 21% of marketing leaders can measure marketing ROI. Meanwhile, 65% of marketers say generating traffic and leads is their biggest challenge. The gap between those numbers is where most teams live - drowning in lead data but starving for insight. Tracking 50 KPIs in a dashboard nobody reads isn't lead analytics. Let's fix that.
The Short Version
If you only read one section, here's the hierarchy:
- Fix your data quality first. If a third of your emails bounce, every metric downstream is fiction.
- Build a lead scoring model with negative scoring. Adding points is easy. Subtracting them separates mature ops from wishful thinking.
- Pick an attribution model that matches your sales cycle length. Don't default to last-click.
- Build one dashboard with five metrics. Not five dashboards with fifty metrics.
That's the whole playbook. Everything below is the how.
What Is Lead Analytics?
Lead analytics is the practice of collecting, measuring, and interpreting data about your leads to understand which ones convert, why, and what to do about the ones that don't. It connects marketing spend to revenue.
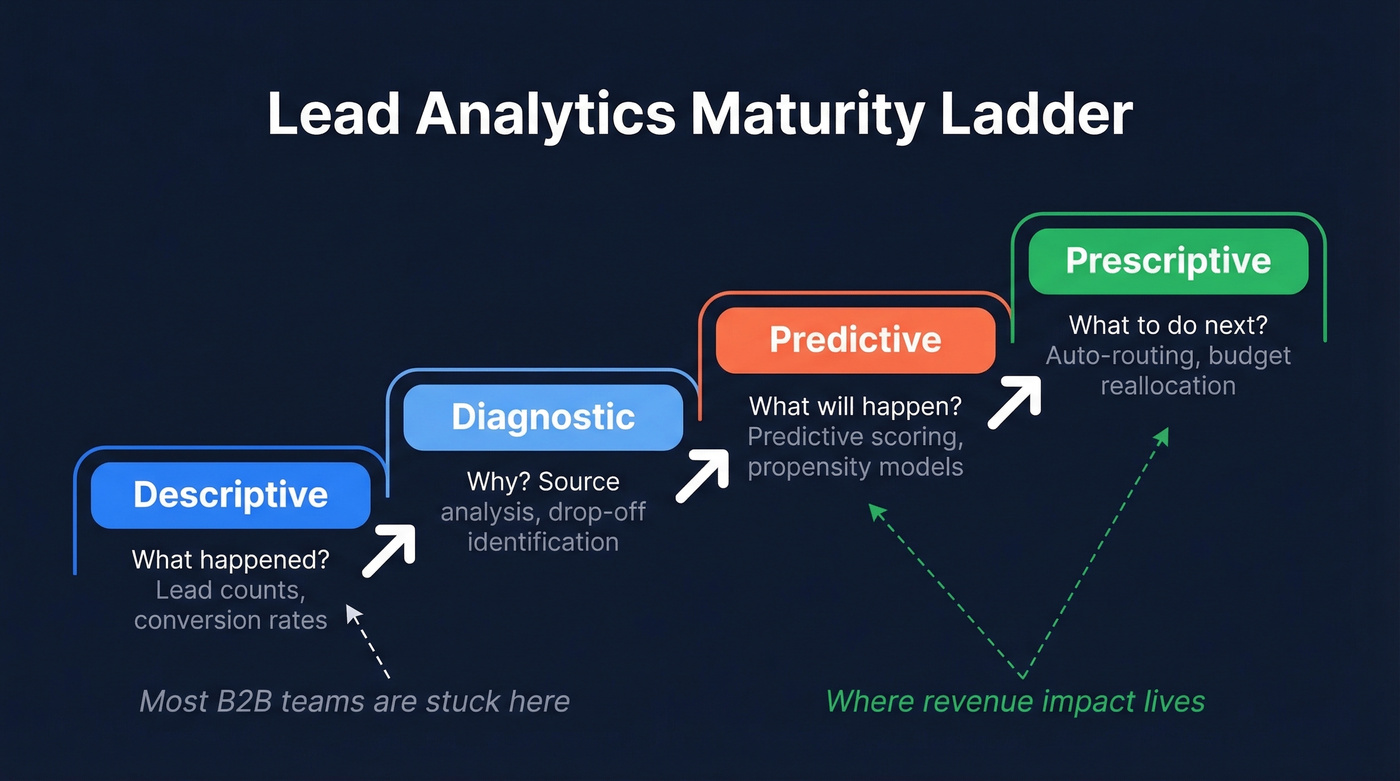
Most teams operate at the lowest maturity level. There are four:
- Descriptive - what happened (lead counts, conversion rates)
- Diagnostic - why it happened (source analysis, drop-off identification)
- Predictive - what will happen (predictive lead scoring, propensity to buy)
- Prescriptive - what to do next (automated routing, budget reallocation)
Most B2B programs are stuck at descriptive. They can tell you how many MQLs came in last month but can't tell you which channel produced the MQLs that actually closed. Here's a diagnostic example worth internalizing: if your SQL-to-Opportunity rate drops but MQL-to-SQL stays flat, the problem is in your sales process - demo scheduling friction, rep follow-up speed - not your lead quality. That kind of funnel analysis is the entire point of moving up the maturity ladder.
Core Lead Engagement Metrics That Matter
You don't need twenty KPIs. You need five, measured well.
Cost per lead (CPL) tells you acquisition efficiency. Conversion rate tells you funnel health. MQL-to-SQL rate tells you whether marketing and sales agree on what "qualified" means. Lead-to-customer rate tells you bottom-line impact. And lead velocity rate - month-over-month growth in qualified leads - tells you whether your pipeline is accelerating or stalling. For context, a marketing ROI of 5:1 is strong; anything below 2:1 signals a problem worth diagnosing.
GA4 tracks sessions and events, and much of that behavior is anonymous until a user identifies themselves. Lead analytics tracks identified people through your pipeline. Don't confuse the two - they answer fundamentally different questions.
Here's what good looks like at each funnel stage:
| Funnel Stage | Great | Average | Needs Work |
|---|---|---|---|
| Visitor to Lead | >5% | 2-5% | <2% |
| MQL to SQL | >60% | 40-60% | <40% |
| Lead to Customer | >20% | 10-20% | <10% |
If your MQL-to-SQL rate is below 40%, the problem usually isn't lead volume. It's lead quality or a misaligned handoff between marketing and sales.
2026 B2B Benchmarks
Benchmarks are only useful if they're specific enough to act on. Here's what we're seeing across channels and industries, based on compiled industry data.
| Channel | Avg Conv. Rate | Avg CPL |
|---|---|---|
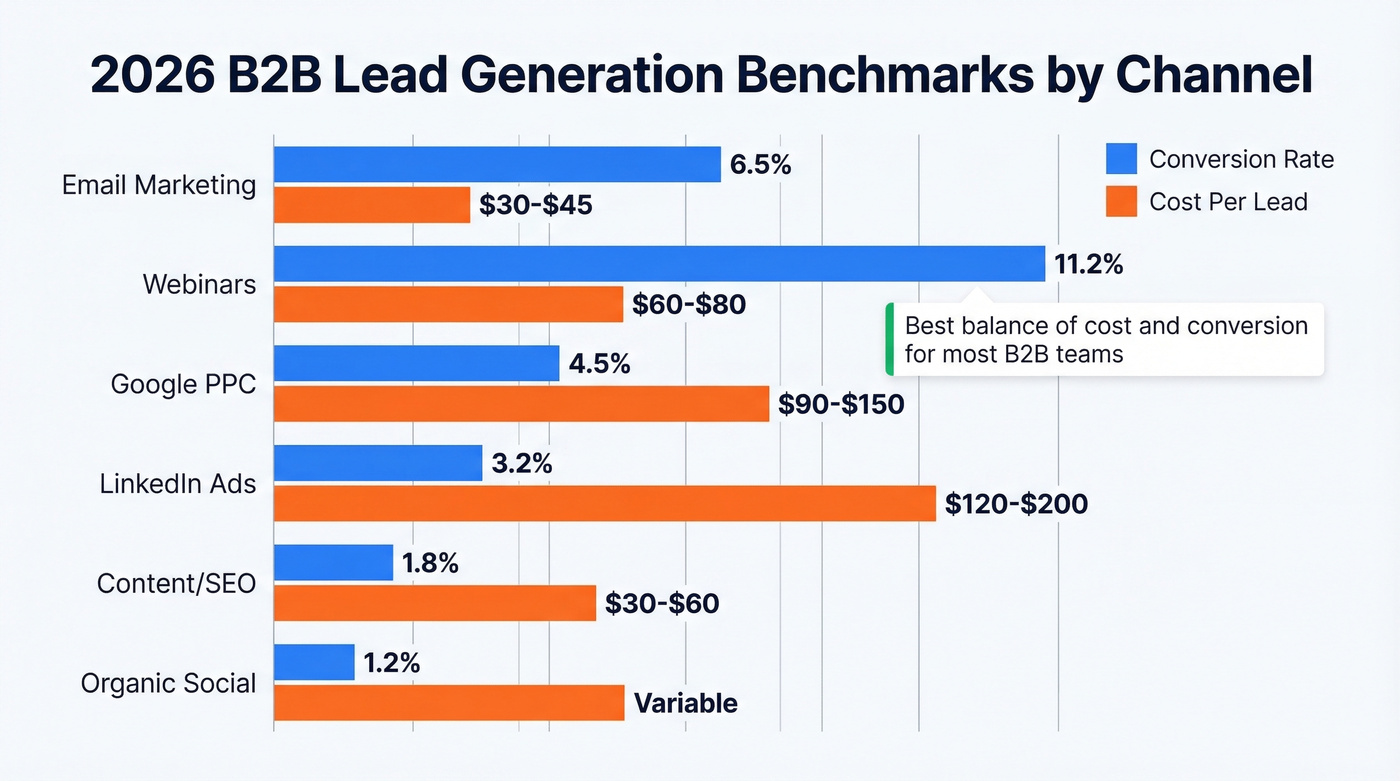
| Email marketing | 6.5% | $30-$45 |
| Webinars | 11.2% | $60-$80 |
| Google PPC | 4.5% | $90-$150 |
| LinkedIn ads | 3.2% | $120-$200 |
| Content/SEO | 1.8% | $30-$60 |
| Organic social | 1.2% | Variable |
| Industry | Conv. Rate | CPL | Lead-to-Customer |
|---|---|---|---|
| SaaS | 5.1% | $85 | 17% |
| Prof. Services | 6.0% | $60 | 20% |
| Financial Services | 4.5% | $110 | 15% |
| Healthcare Tech | 3.8% | $100 | 12% |
| Manufacturing | 2.7% | $75 | 8% |
One detail worth flagging: 3-field forms convert 27% better than 5-field forms. If you're gating content behind a 7-field form and wondering why CPL is high, there's your answer.
Webinars stand out at 11.2% conversion, but they're the hardest to scale. Email remains the best balance of lead conversion rate and cost efficiency for most B2B teams. And if you're in manufacturing sitting at 2.7%, don't panic - that's normal for long, committee-driven sales cycles. Compare yourself to your vertical, not to SaaS companies with self-serve funnels.
You just read that most teams are stuck at descriptive analytics because their CRM data is incomplete. Prospeo's enrichment returns 50+ data points per contact at an 83% match rate - firmographics, technographics, and intent signals across 15,000 Bombora topics. Score leads on real buying behavior, not form fills.
Stop scoring leads on incomplete records. Enrich your CRM in minutes.
How to Build a Lead Scoring Model
Firmographic + Behavioral Scoring
Every scoring model rests on two pillars: who the lead is and what they've done. Firmographic attributes tell you fit. Behavioral signals tell you intent. You need both.
| Signal | Points |
|---|---|
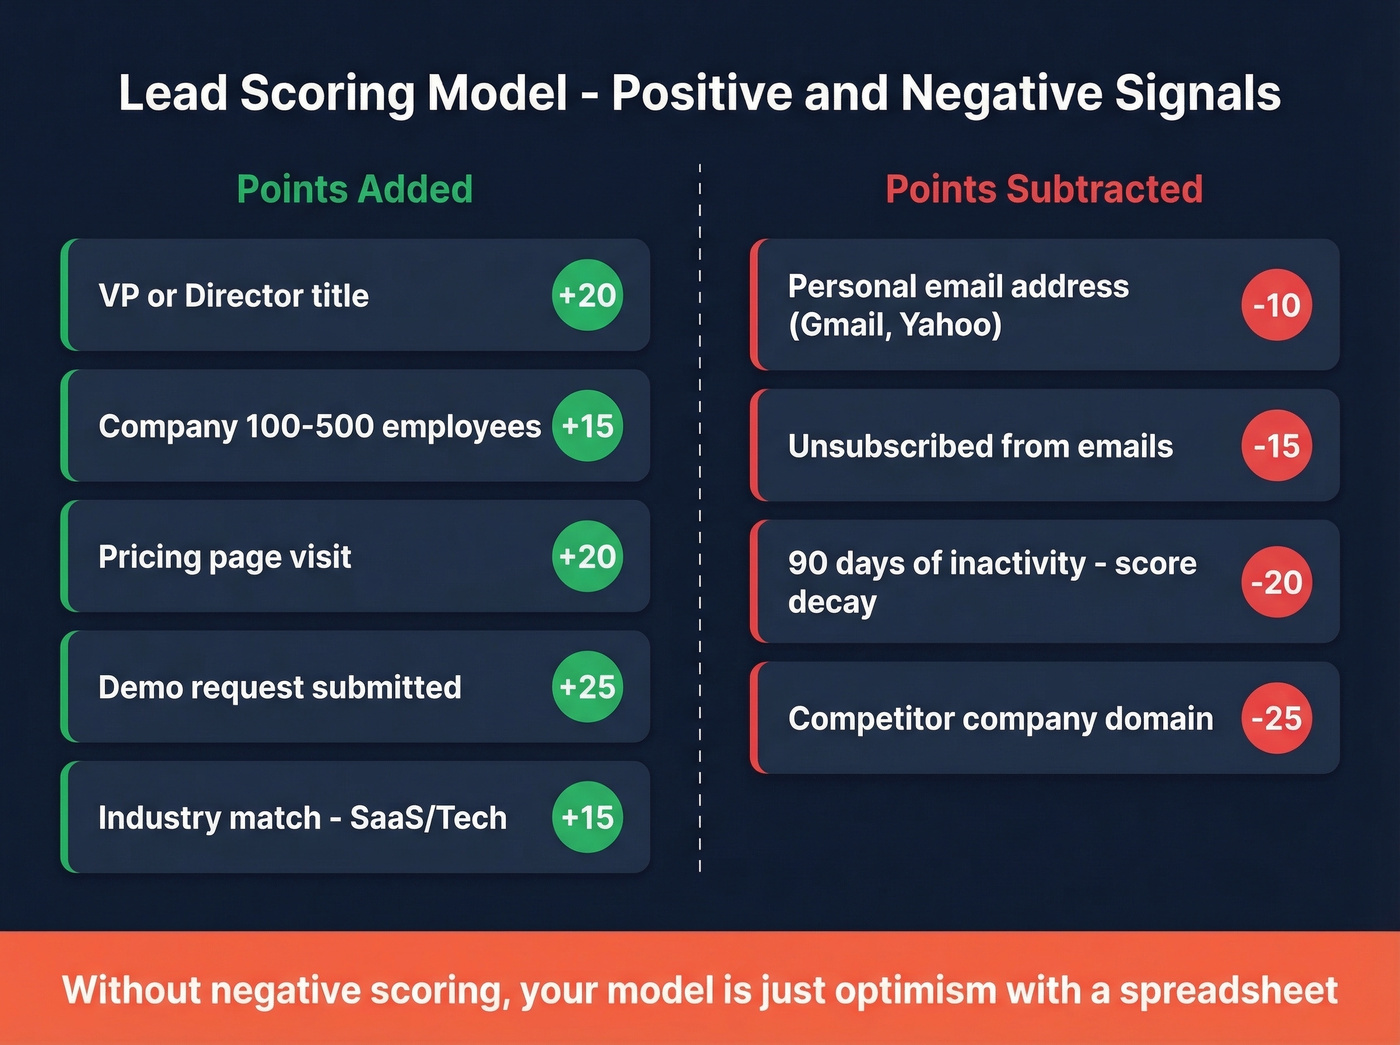
| VP/Director title | +20 |
| Company 100-500 employees | +15 |
| Industry: SaaS/Tech | +15 |
| Pricing page visit | +15 to +20 |
| Blog post read | +3 to +5 |
| Personal email address | -10 |
High-intent actions like pricing page visits and demo requests should carry 3-4x the weight of passive engagement. Personal email addresses on B2B forms typically indicate individual researchers, not decision-makers, and they convert worse than work emails. We've seen teams ignore this signal for months, then wonder why their "high-scoring" leads ghost after the first call.
Negative Scoring and Decay
Here's the thing: lead scoring without negative scoring is just optimism with a spreadsheet. Unsubscribes should cost points. Ninety days of inactivity should trigger score decay. If someone downloaded a whitepaper six months ago and hasn't engaged since, their score should reflect that reality - not the hope of the marketing team that originally captured them.
If you want a deeper framework, start with a dedicated lead scoring model and then layer in identifying buying signals to avoid over-weighting vanity engagement.
Engagement tracking with timestamps is what makes decay rules possible. Without it, you can't distinguish an active prospect from a stale one, and your sales team wastes hours chasing ghosts.
2026 Scoring Inputs
Modern predictive lead scoring pulls from five input categories:
- Engagement data - website visits, email opens, event attendance
- Demographics - job title, seniority, geography
- Persona alignment - buyer journey stage, pain points
- Company attributes / ICP fit - size, revenue, industry, growth trajectory
- Technographics and growth signals - tech stack, recent funding, hiring velocity
The last two categories are where most teams fall short because they require enrichment data that doesn't live in your CRM natively. To score leads on firmographic and technographic attributes, you need complete records. Prospeo's CRM enrichment returns 50+ data points per contact at an 83% match rate, with intent data tracking 15,000 Bombora topics via Bombora - so you're scoring on whether a company is actively researching solutions in your category, not just whether someone filled out a form. Tools like Clearbit (now Breeze Intelligence) also handle enrichment. The point: if your CRM records are missing company size and tech stack on half your leads, your scoring model is running on incomplete information.
If you're comparing vendors, see our breakdown of data enrichment services and the practical differences between firmographic and technographic data.
Attribution Models
Single-touch attribution is lying to you. Last-click makes Google Ads look heroic and content marketing look useless. First-click does the opposite. Neither reflects reality.
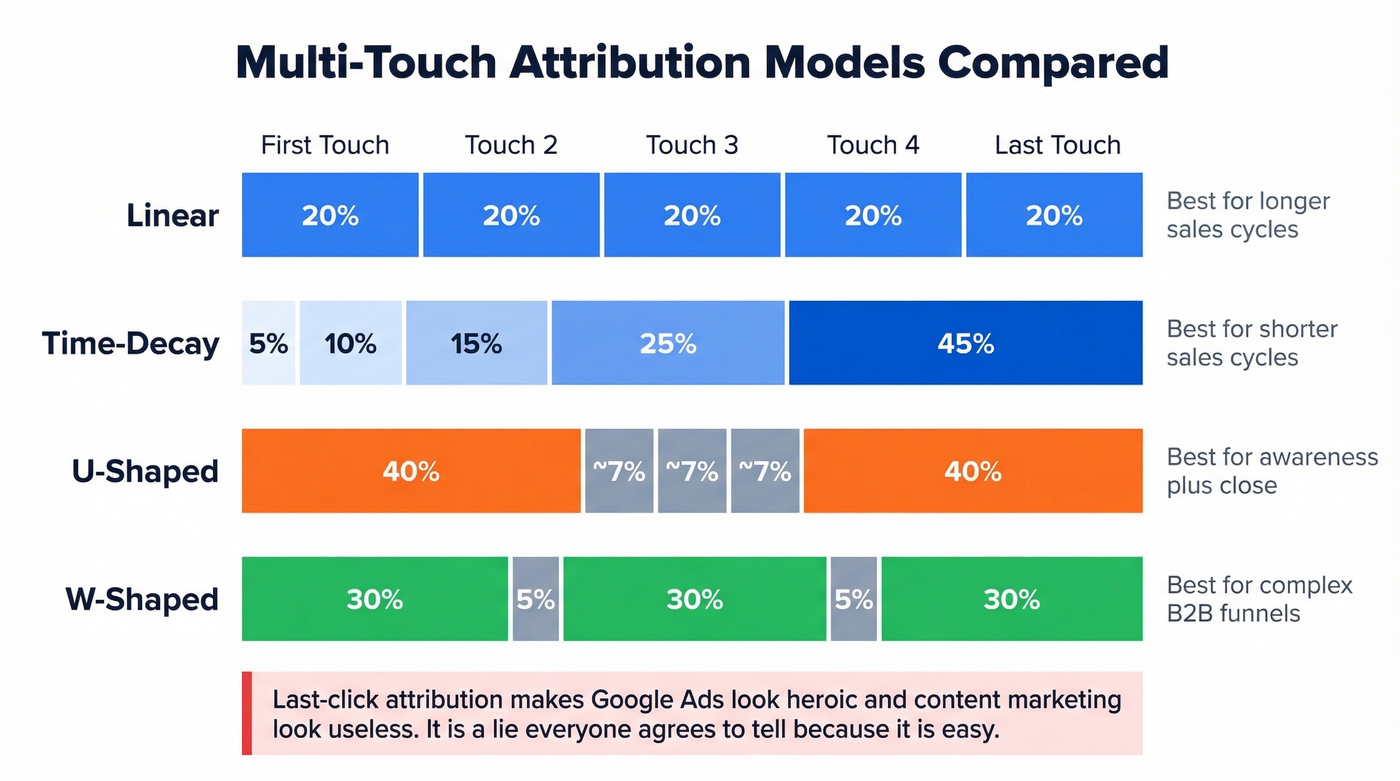
| Model | Credit Distribution | Best For |
|---|---|---|
| Linear | Equal across all | Longer sales cycles |
| Time-Decay | More to recent | Shorter sales cycles |
| U-Shaped | First + last touch | Awareness + close |
| W-Shaped | First + mid + last | Complex B2B funnels |
For teams with long, research-heavy sales cycles, start with linear attribution. It's the least biased and the easiest to explain to leadership. Short cycle? Time-decay gives more useful signal.
Multi-touch attribution is also getting harder in a privacy-first world. But imperfect attribution still beats no attribution - and it definitely beats last-click, which causes budget misallocation toward whatever channel happens to be the final touchpoint. The consensus on r/analytics is blunt: last-click is a lie everyone agrees to tell because it's easy. Don't be that team.
Building Your Analytics Dashboard
A dashboard monitors what's happening now. A report explains what happened over a period. Most teams build reports and call them dashboards, then wonder why nobody checks them.
Here's the layout that works: one pipeline view showing Lead to MQL to SQL to Opportunity to Revenue, with three metrics at each stage - volume, conversion rate, and CPL. Add lead source analysis as a filter, not a separate view. That's it. Layer in engagement metrics like email reply rates and content downloads per lead for a real-time read on pipeline warmth, but resist the urge to add more. Every widget you add dilutes attention.
If your HubSpot or Salesforce instance has twelve dashboards and nobody can tell you which channel produced the most revenue last quarter, you've got a reporting problem disguised as a data problem. Skip the fancy multi-tab setup until your team actually uses the simple one. If you need a sanity check on what to track, align your dashboard to lead generation metrics and a simple view of pipeline health.
Data Quality: The Foundation Nobody Wants to Talk About
Everything above - scoring models, attribution frameworks, dashboards - is built on an assumption: that your contact data is accurate. For most teams, it isn't.
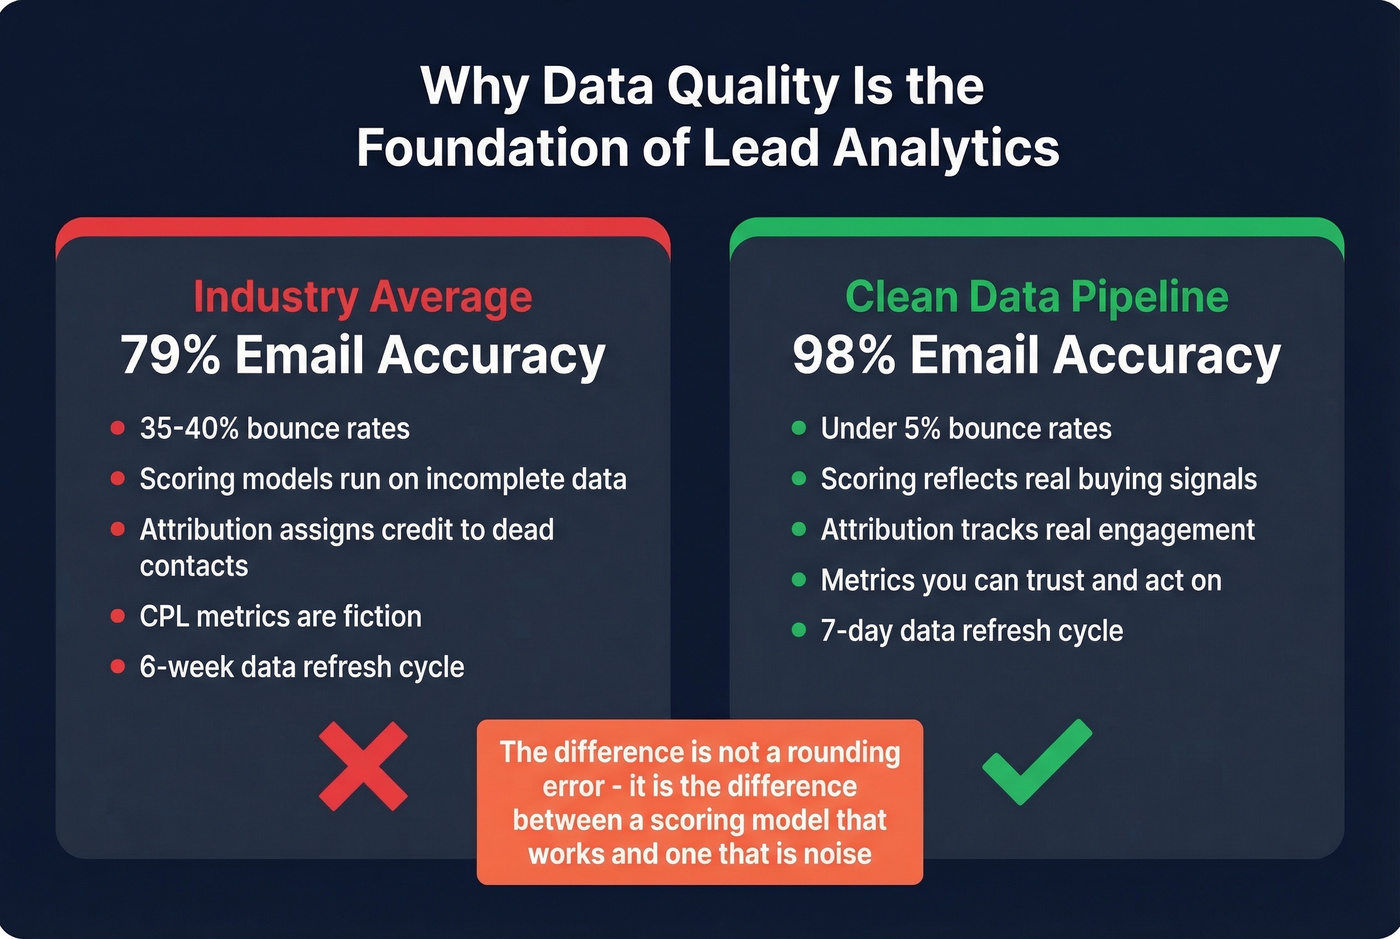
If a third of your emails bounce, your CPL and conversion metrics are fiction. You're calculating cost per lead on a denominator that includes leads who never received your message. Your attribution model is assigning credit to channels that "generated" contacts who don't exist. Engagement tracking breaks down entirely when messages never reach an inbox - you can't measure what a prospect does with an email they never got.
Here's the uncomfortable truth most guides skip: if your average deal size is under $10K, you probably don't need a $30K/year data platform. But you absolutely need accurate data. The difference between 79% email accuracy and 98% isn't a rounding error - it's the difference between a scoring model that works and one that's noise. Prospeo delivers that 98% accuracy with a 7-day refresh cycle, compared to the 6-week industry average that lets job changes and company moves silently corrupt your database.
If you're diagnosing why bounces are spiking, start with email bounce rate and then work backward through your email deliverability setup.
The proof is in the outcomes. Snyk's 50-person AE team was running bounce rates of 35-40%. After cleaning up their data pipeline, bounces dropped under 5%, AE-sourced pipeline jumped 180%, and they now generate 200+ new opportunities per month. Every scoring model, every attribution report, every dashboard metric improves when the underlying data is clean. We've seen this pattern repeat across dozens of teams - fix the data, and the analytics start telling the truth.
Bad data doesn't just inflate your bounce rate - it poisons every metric downstream. Prospeo's 5-step verification delivers 98% email accuracy on a 7-day refresh cycle, so your lead analytics reflect reality instead of fiction. At $0.01 per email, fixing data quality costs less than one bad dashboard decision.
Clean data in, accurate analytics out. Everything else is guesswork.
FAQ
What metrics should I track first?
Start with three: cost per lead, MQL-to-SQL conversion rate, and lead-to-customer rate. These cover acquisition efficiency, funnel alignment, and bottom-line impact. Add lead velocity rate once the basics are dialed in - it's the best predictor of pipeline momentum.
How is lead analytics different from web analytics?
Web analytics tracks anonymous sessions and page-level events. Lead analytics tracks identified people from first touch to closed deal, telling you which visits produced SQLs and revenue. GA4 answers "what happened on the site"; lead analytics answers "which leads became customers and why."
How often should I review my data?
Weekly for dashboards monitoring pipeline volume and conversion rates. Monthly for scoring model calibration and threshold adjustments. Quarterly for attribution and ROI reviews - that's when you reallocate budget based on which channels actually drove closed revenue.
What's a good free tool for improving lead data quality?
Prospeo's free tier includes 75 verified emails and 100 Chrome extension credits per month - enough to test enrichment accuracy before committing. HubSpot's free CRM handles basic tracking. Pair both with Google Looker Studio for dashboards, and you've got a functional stack at zero cost.