Lead Nurturing KPIs: The Metrics That Actually Matter
Most B2B teams measure lead nurturing the same way they always have - open rates, impressions, maybe a conversion number pulled from HubSpot once a quarter. Meanwhile, 40.4% of buyers take 6-12 months to make a purchase decision. The gap isn't effort. It's which lead nurturing KPIs you're tracking.
If your email dashboard still leads with open rate, stop. Apple Mail Privacy Protection turned it into a vanity metric, and iOS 18.2/18.3 made inbox visibility and engagement measurement even harder. Track clicks, replies, and conversions instead. And watch out for these four KPI traps that kill most nurture programs: overreliance on vanity metrics that don't prove progression, using the same KPIs at every funnel stage, no structured review cadence, and metrics isolated from sales impact.
Here's the thing: if you're running a sub-$15k deal motion and your nurture program doesn't track pipeline velocity, you're flying blind on the metric that actually predicts revenue. Everything else is a supporting signal.
Quick-Reference Benchmarks
Pin this somewhere your team can see it.
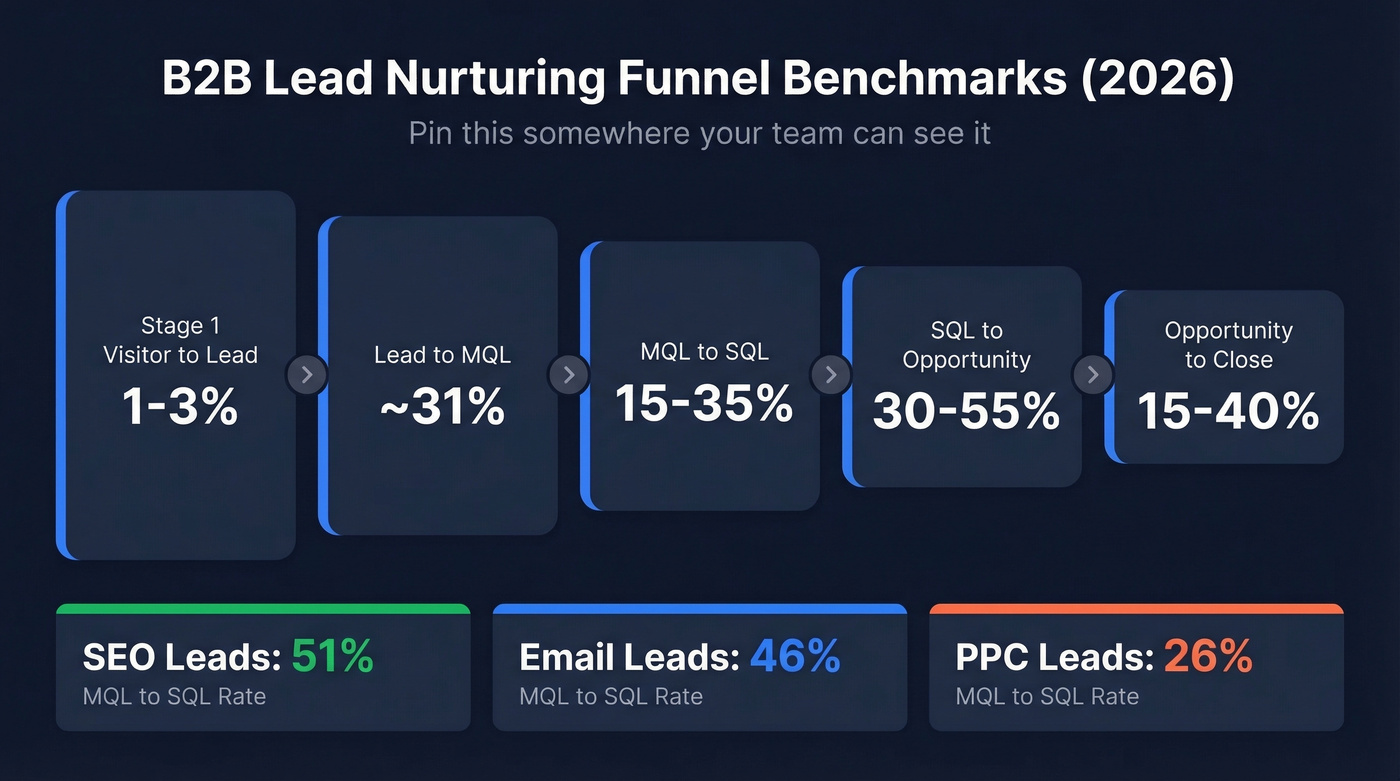
| Funnel Stage | Benchmark Range |
|---|---|
| Visitor to Lead | 1-3% |
| Lead to MQL | ~31% |
| MQL to SQL | 15-35% |
| SQL to Opportunity | 30-55% |
| Opportunity to Close | 15-40% |
SEO-sourced leads convert MQL to SQL at 51%, email at 46%, and PPC at just 26%. Company stage shifts the goalposts too:
| Company Stage | MQL to Close Rate |
|---|---|
| Early-stage | 1-2% |
| Growth | 2-4% |
| Scale | 3-5% |
| Enterprise | 4-7% |
Your lead scoring, MQL-to-SQL rates, and pipeline velocity all depend on one thing: reaching real people. Bounced emails corrupt scores, inflate cycle length, and tank conversion rates. Prospeo's 98% email accuracy and 7-day data refresh cycle keeps every KPI on this page honest.
Bad data is the silent killer of every nurture metric you track.
Core Metrics by Funnel Stage
Top-of-Funnel
Lead-to-MQL conversion rate is your first real signal. It tells you whether your content attracts the right people or just fills the funnel with noise. Since 45.8% of buyers consume 7+ content pieces during their purchase journey, your ToFu KPIs need to track progression across those touches, not just first-click metrics.

Email engagement is where most teams get it wrong. Apple Mail Privacy Protection preloads tracking pixels via proxy servers, firing "opens" even when nobody reads the email. With 74%+ of Apple users now on iOS 18.2 or 18.3, your open rate data is inflated on the majority of Apple devices. iOS 18.2 also introduced inbox tabbing, AI-generated preview text, and sender-based threading - all pushing marketing emails further from the primary inbox.
One practitioner on r/Emailmarketing shifted to tracking click-to-open rate and repeat-purchase rates instead of raw opens, and saw a ~20% lift in click-to-conversion within a month. Replace open rate with click-through rate and reply rate as your primary email engagement KPIs.
Mid-Funnel: Where Nurture Wins or Loses
MQL to SQL conversion rate tells you whether marketing and sales agree on what "qualified" means.
| Industry | MQL to SQL Rate |
|---|---|
| B2B SaaS | 13% |
| eCommerce | 23% |
| Business Insurance | 26% |
| Cybersecurity | 15% |
| Fintech | 11% |
Below 10%? Audit your lead scoring thresholds and nurture content relevance before blaming the sales team.
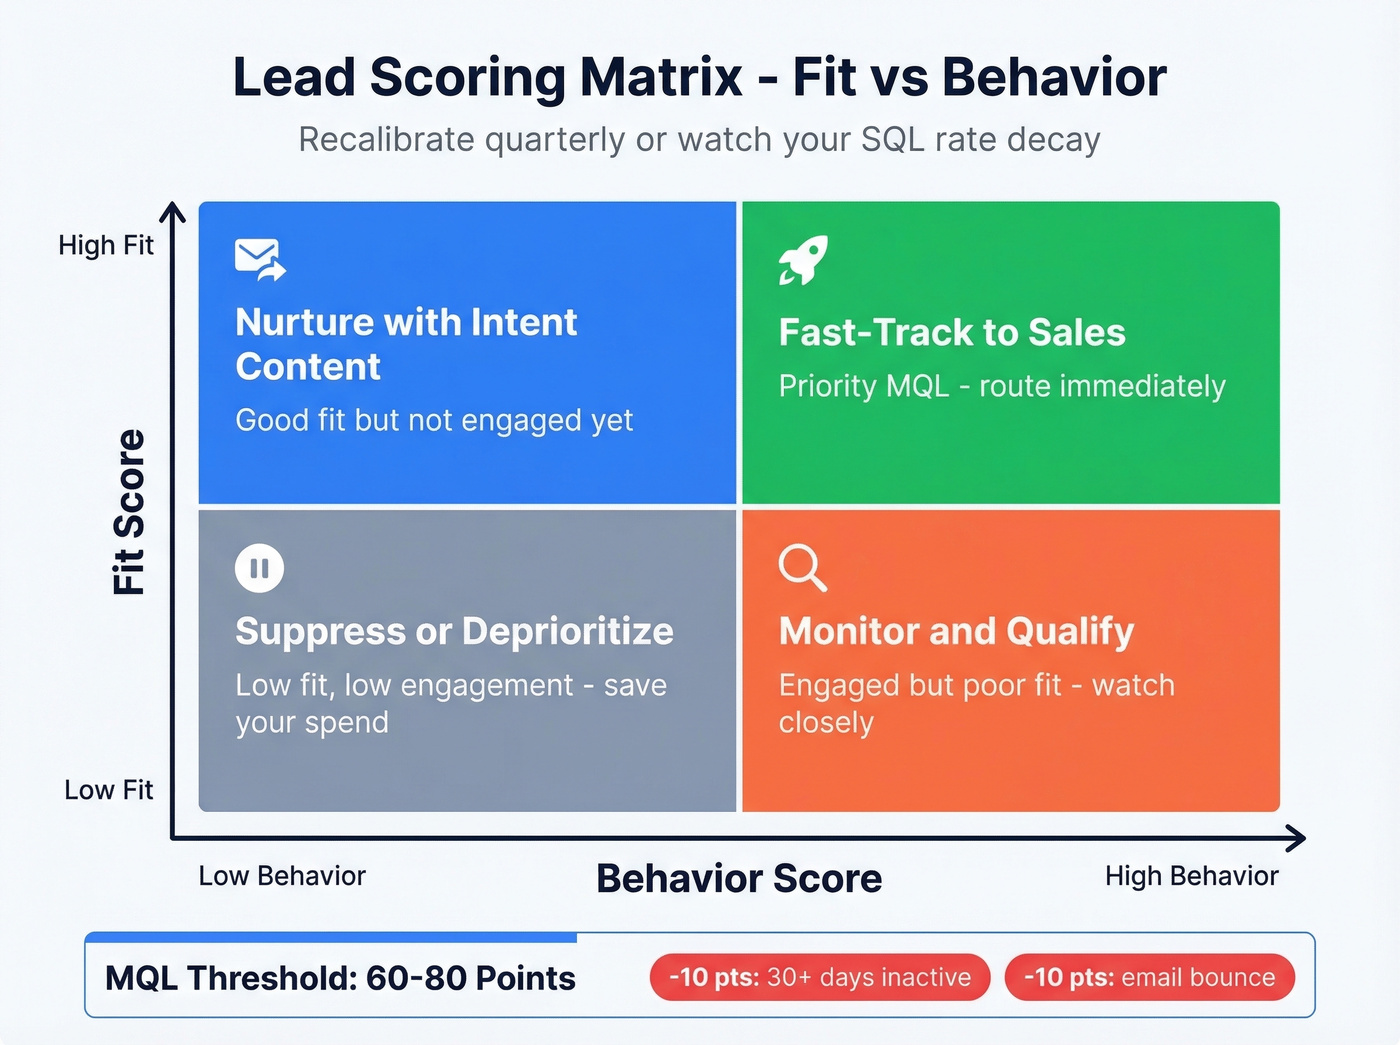
Lead scoring progression drives that conversion rate. Build scoring on a fit + behavior matrix: high-fit/high-behavior leads get fast-tracked, low-fit/low-behavior leads get suppressed. Set your MQL threshold in the 60-80 point range, and don't forget negative scoring - subtract 10 points for 30+ days of inactivity, another 10 for email bounces. We've seen teams double their SQL rate just by recalibrating lead scores quarterly. Most teams never recalibrate at all.
None of these metrics mean anything if your contact database is full of stale emails. Bounced emails corrupt lead scores and waste spend. Prospeo's 98% email accuracy and 7-day data refresh cycle keeps your nurture metrics honest - bad data is the silent killer of every metric on this page.
Lead response time is the most underrated mid-funnel lever. Follow up within the first hour and conversion hits 53%. Wait 24 hours and it drops to 17%. That's a 3x gap from a single operational change. (If you need a starting point, use these sales follow-up templates to standardize speed.)
A quick note on attribution: your choice of model - first-touch, linear, time-decay, W-shaped - directly affects how you credit nurture touchpoints. If you're running multi-touch nurture sequences but using last-touch attribution, you're systematically undervaluing the emails and content that warm leads up. Pick a model that reflects your actual buyer journey.
Bottom-of-Funnel + Predictive
Pipeline velocity is the metric your CFO actually understands:
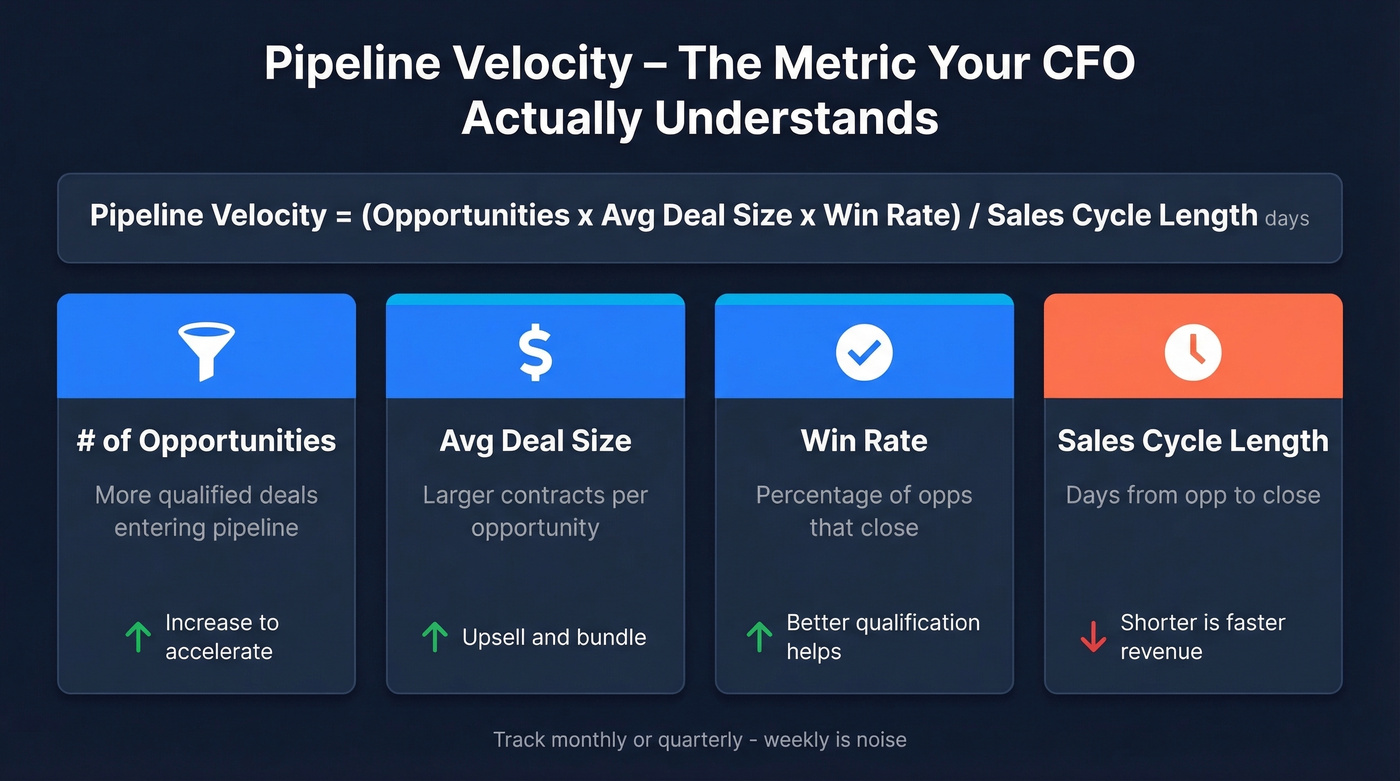
Pipeline Velocity = (# Opportunities x Avg Deal Size x Win Rate) / Sales Cycle Length (days)
Track it monthly or quarterly. Weekly is noise. The four levers - opportunity count, deal size, win rate, and cycle length - each tell you something different about where your funnel leaks. (For a broader view, map this to your funnel metrics so stage-level changes explain the velocity shift.)
Opportunity-to-close rate benchmarks 15-40% for SaaS. If you're consistently below 15%, the problem is usually mid-funnel qualification, not bottom-of-funnel closing.
Lead Velocity Rate predicts revenue 60-90 days out:
LVR = ((Qualified Leads This Month - Qualified Leads Last Month) / Qualified Leads Last Month) x 100
A healthy LVR runs 15-25% month-over-month. Below that, your pipeline is decelerating even if current revenue looks fine. In our experience, the teams that track LVR are the ones that never get blindsided by pipeline dips.
Let's be honest about one more thing: companies with genuine sales-marketing alignment achieve 24% faster revenue growth and 27% faster profit growth. Alignment isn't a buzzword - it's a measurable multiplier on every KPI listed above. (This is also where marketing enablement makes the numbers stick operationally.)
And don't forget post-sale nurture metrics. Retention rate, churn, NPS, and expansion revenue are the "fifth stage" of nurture measurement that most teams ignore entirely. Nurtured leads make 47% larger purchases on average - that ROI compounds when you keep measuring after the deal closes. If you're serious about this layer, start with a clean churn analysis so retention KPIs are actionable.
Reporting Cadence
| Frequency | What to Review |
|---|---|
| Weekly | CTR, reply rate, site traffic |
| Monthly | Content performance, mid-funnel progression, LVR |
| Quarterly | Pipeline velocity, deal velocity, lead scoring calibration |
| Annually | Retention, CLV, expansion revenue, NPS |
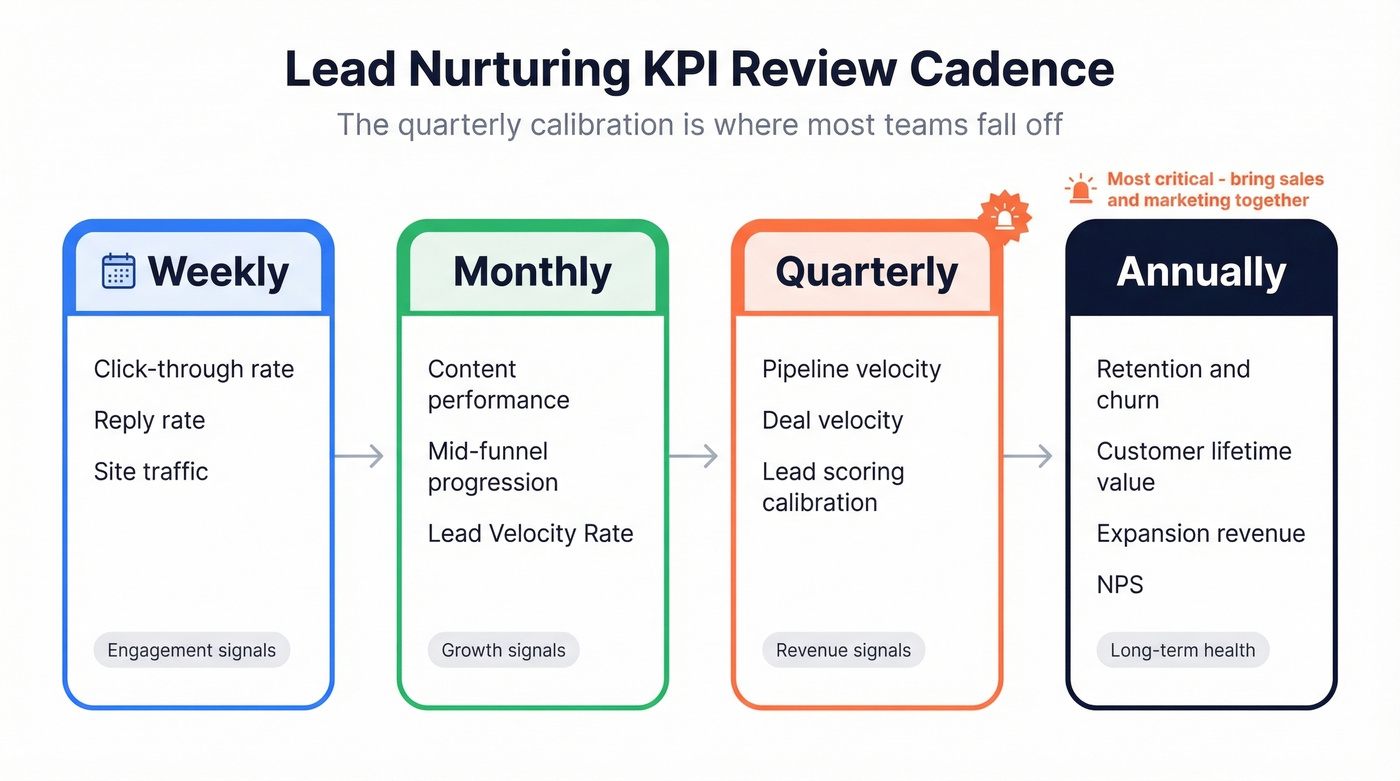
The quarterly calibration is where most teams fall off. Set a recurring meeting, bring sales and marketing into the same room, and recalibrate scoring thresholds based on what actually closed. Skip this if you enjoy discovering pipeline problems three months too late. (Many teams formalize this as a QBR to keep decisions consistent.)
You just learned that follow-up within the first hour drives 3x more conversions. But speed means nothing if you're reaching invalid contacts. Prospeo verifies 143M+ emails through a 5-step process - so your nurture sequences hit real inboxes, not dead ends. At $0.01 per email, cleaning your pipeline costs less than a single bounced send.
Stop optimizing nurture sequences built on broken contact data.
FAQ
What's a good MQL-to-SQL conversion rate?
The industry average across B2B is roughly 13%. B2B SaaS hovers around that mark, while eCommerce reaches 23% and business insurance hits 26%. If you're consistently below 10%, it's a scoring problem - audit your MQL thresholds and nurture content relevance before adding more volume.
Is email open rate still a useful nurture KPI?
Not as a primary metric. Apple Mail Privacy Protection preloads tracking pixels on Apple devices, inflating open rates well beyond actual engagement. Use click-through rate, reply rate, and conversion rate instead. Open rate still works as a rough deliverability check, but it shouldn't drive nurture decisions.
How often should I review lead nurturing KPIs?
Weekly for engagement signals like CTR and reply rate. Monthly for mid-funnel progression and Lead Velocity Rate. Quarterly for pipeline velocity, scoring calibration, and deal velocity. The quarterly review is the one most teams skip - and it's the one that matters most for catching pipeline slowdowns early.
How does bad contact data affect nurture metrics?
Bad emails inflate bounce rates, corrupt lead scores, and tank sender reputation - making every downstream KPI unreliable. We've watched teams spend months "optimizing" nurture sequences when the real problem was a 15% bounce rate poisoning their data. Keeping bounce rates under 4% gives your scoring models and conversion metrics a clean foundation to work from.