Your Lead-to-Close Rate Is Probably Wrong - Here's How to Fix It
Your VP just asked why the team's close rate is 4% when "the industry average is 20%." You pull up the dashboard, stare at the numbers, and realize you don't actually know if 4% is terrible or perfectly normal.
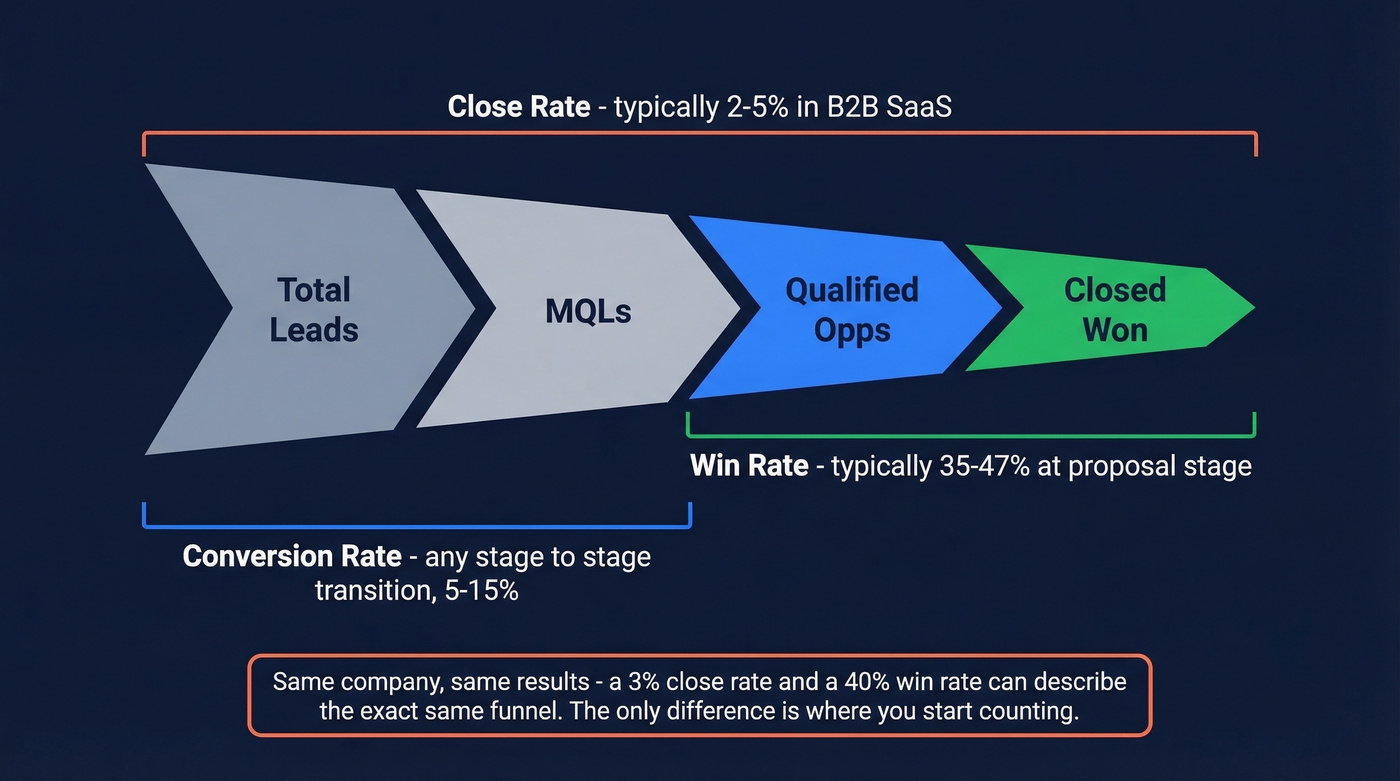
Here's the problem: most published lead-to-close rate benchmarks are useless because nobody agrees on the denominator. A 4% rate from total leads and a 40% opportunity-to-close rate can describe the exact same funnel - the difference is where you start counting. We've watched teams spiral over a "bad" close rate that was actually above average once they measured it correctly.
The Short Version
- Formula: Closed Won ÷ Total Leads × 100
- The key insight: Changing your denominator from "all leads" to "qualified opportunities" can swing your rate from 3% to 35% overnight - without closing a single extra deal
- Three highest-leverage fixes: Separate disqualified leads from closed-lost in your CRM, multi-thread every deal with 2+ stakeholders, and verify contact data before reps work it so stale emails and dead numbers don't inflate your denominator
What Is Lead-to-Close Rate?
Lead-to-close rate measures the percentage of leads that become paying customers. It's the broadest conversion metric in your funnel - and the most commonly misquoted.
Formula: (Closed Won Deals ÷ Total Leads) × 100
Say marketing generates 1,000 leads in January. By the time those leads work through the pipeline, 30 become customers. Your lead-to-close rate is 3%. That sounds low until you realize it's perfectly normal for B2B SaaS. The issue isn't the rate - it's whether you're measuring it the same way as the benchmarks you're comparing against.
Close Rate vs. Win Rate vs. Conversion Rate
The industry can't agree on definitions. Gartner's own close rate page says "close rate, also called win rate" and provides a lead-based formula. Outreach frames this as the "denominator debate" - and they're right.
| Metric | Denominator | What It Measures | Typical B2B Range |
|---|---|---|---|
| Close rate | Total leads | Full-funnel efficiency | Low single digits in many B2B SaaS funnels |
| Win rate | Qualified opps | Sales execution | ~47% average at proposal stage |
| Conversion rate | MQLs or total leads | Pipeline generation | 5-15% depending on industry |
A 3% close rate from total leads is normal. A 3% opportunity-to-close rate is a five-alarm fire. Same number, completely different diagnosis. If someone quotes you a "close rate" without specifying the starting stage, the number is meaningless.
Conversion rate is the most flexible of the three - it describes any stage-to-stage transition. "MQL-to-SQL conversion rate" and "visitor-to-lead conversion rate" are both conversion rates. They tell you where the funnel leaks, not how the whole thing performs.
If you want a clean way to map these stages, start with funnel metrics and standardize what each stage means in your reporting.
Every bounced email and wrong number is a fake lead inflating your denominator. Prospeo's 98% email accuracy and 7-day data refresh cycle means reps only work real contacts - so your lead-to-close rate reflects actual sales performance, not bad data.
Stop letting stale data destroy your close rate metrics.
Why Your Numbers Are Probably Wrong
Disqualified vs. Closed-Lost Contamination
A practitioner on r/sales posted about a 5% close rate that looked terrible - until they realized window shoppers, no-budget inquiries, and tire-kickers were all bucketed as "closed-lost." Those aren't lost deals. They were never real deals.
If you need a clean way to implement this in your pipeline, use a dedicated lead status taxonomy so "Disqualified" doesn't get mixed with "Closed-Lost."
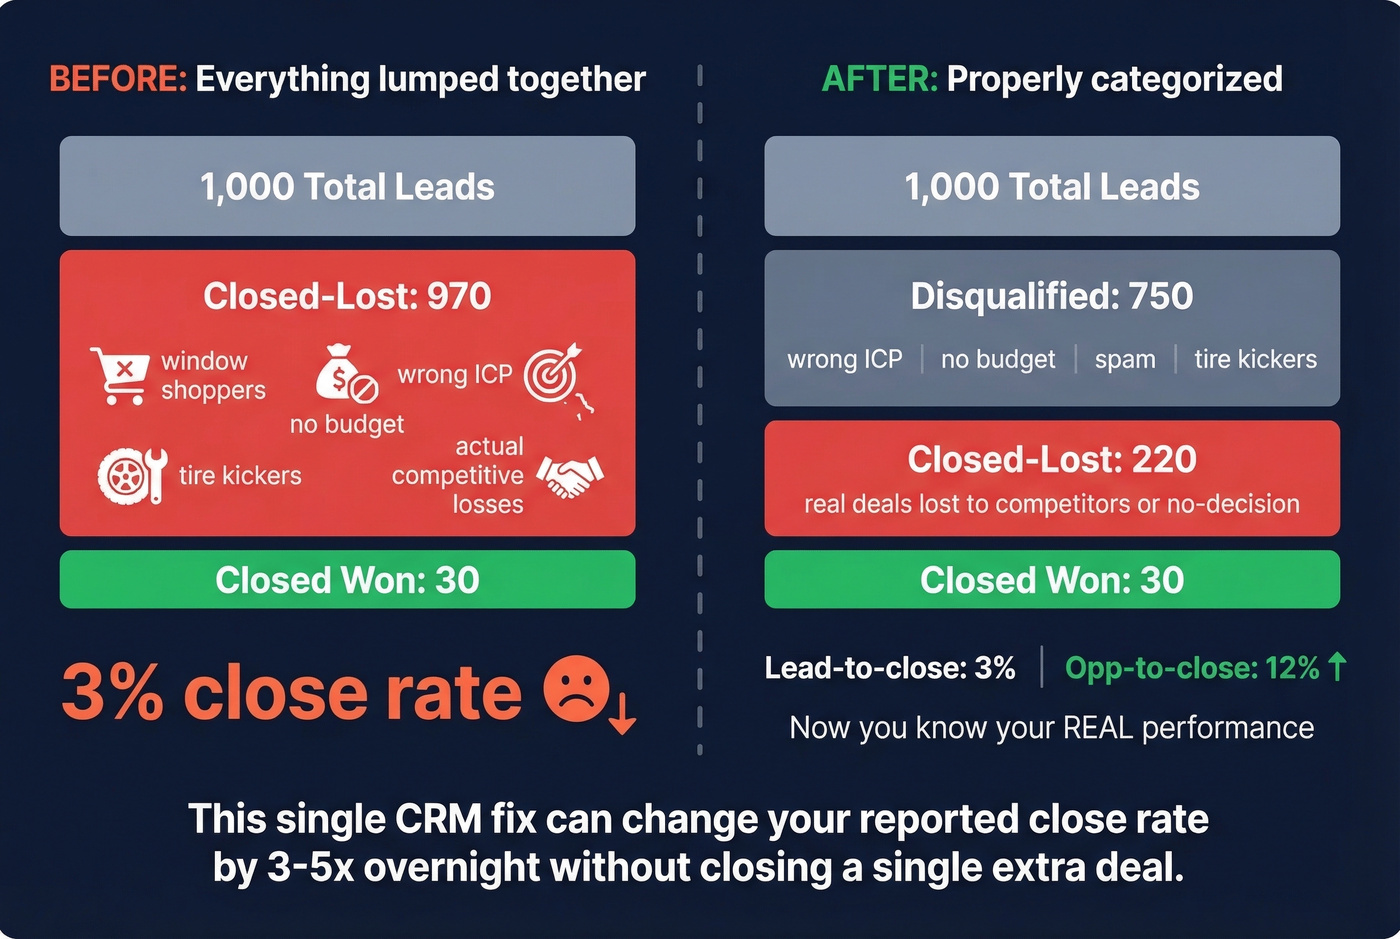
Create a "Disqualified" disposition in your CRM that's separate from "Closed-Lost." Disqualified means the lead never met your criteria. Closed-Lost means a qualified opportunity chose a competitor or went dark. Mixing the two makes your numbers look artificially low, and we've seen this single fix change a team's reported close rate by 3-5x overnight.
Zombie Pipeline and No-Decision Losses
Stale deals that stay open for months - sometimes years - drag down your close rate silently. That "opportunity" from Q2 where the champion left the company? Still open. Still inflating your denominator.
Don't forget deals lost to the status quo: prospects who went through the entire process and then decided to do nothing. Those need their own disposition too, because they reveal a different problem than competitive losses. Set a maximum age threshold by deal stage and auto-close anything that exceeds it.
If this is happening a lot, it’s usually a broader sales pipeline challenges issue - not just a reporting issue.
Inconsistent Lead Definitions
Marketing counts a whitepaper download as a lead. Sales counts a demo request. Both are right within their own context, but if you're dividing closed deals by marketing's lead count while benchmarking against companies that use sales-accepted leads as the denominator, you'll always look worse than you are. Pick one definition, document it, and make sure every dashboard and report references the same starting point.
2026 Benchmarks by Industry and Channel
Most articles quote a single "average close rate" without telling you what stage it's measured from, what industry it covers, or how old the data is. Let's fix that.
Industry Benchmarks
First Page Sage's 2026 dataset - drawn from client data, January 2022 through August 2025 - breaks conversion into distinct stages. Visitor-to-lead by industry:
- B2B SaaS: 1.1%
- IT & Managed Services: 1.5%
- Financial Services: 1.9%
- Manufacturing: 2.2%
- Higher Education: 2.8%
- Legal Services: 7.4%
Lead-to-opportunity rates tell a different story - B2B SaaS sits at 6.2%, Healthcare at 4.7%, HVAC at 11.8%. If your B2B SaaS visitor-to-lead rate is 1.1% and your conversion rate from lead to opportunity is 6.2%, that's not "low conversion." That's normal.
To compare apples-to-apples across teams, it helps to align on a single sales conversion rate definition per stage.
B2B SaaS Funnel by Channel
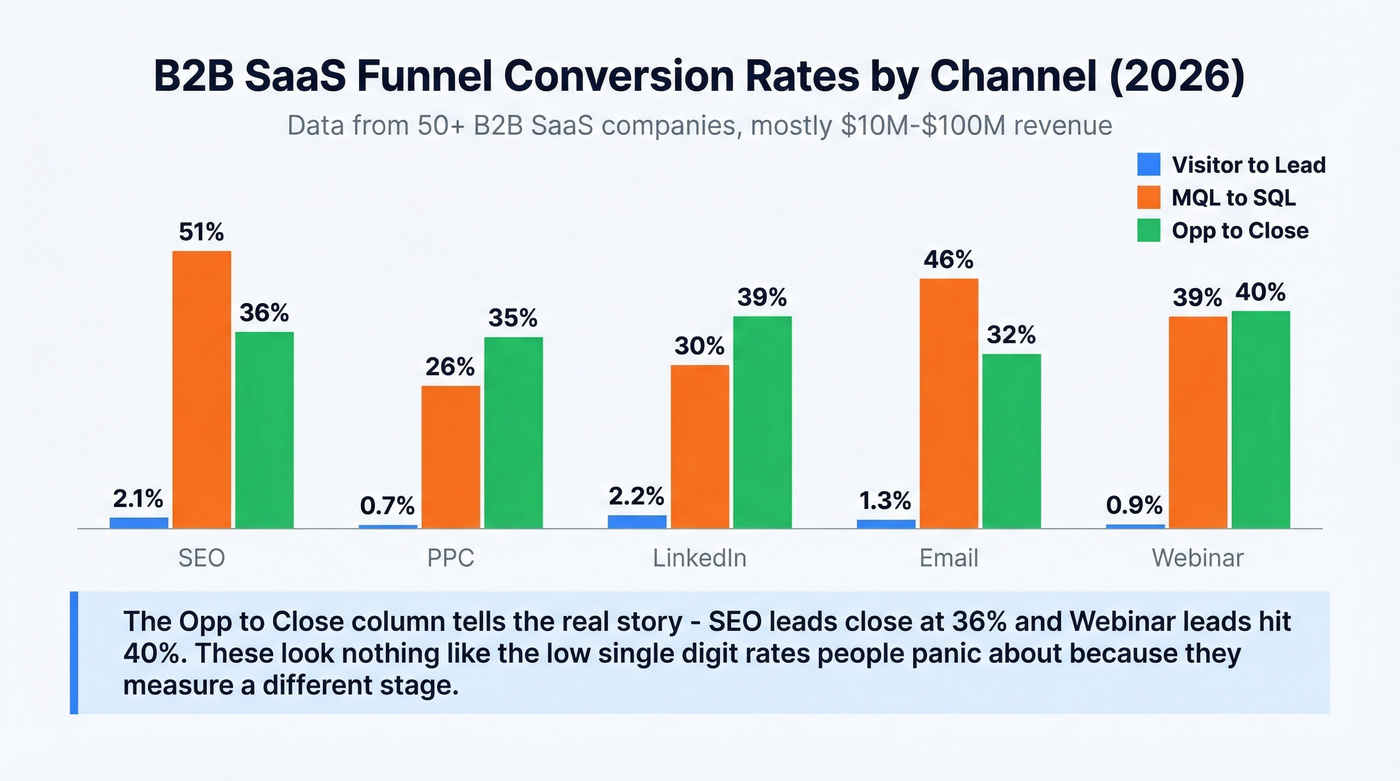
This is the most useful benchmark table we've found, from First Page Sage's SaaS funnel study covering 50+ B2B SaaS clients, mostly $10M-$100M in revenue.
| Channel | Visitor → Lead | MQL → SQL | Opp → Close |
|---|---|---|---|
| SEO | 2.1% | 51% | 36% |
| PPC | 0.7% | 26% | 35% |
| 2.2% | 30% | 39% | |
| 1.3% | 46% | 32% | |
| Webinar | 0.9% | 39% | 40% |
Look at the Opp → Close column. SEO-sourced leads close at 36% from the opportunity stage. Webinar leads hit 40%. These numbers look nothing like the low-single-digit rates people panic about - because they're measuring a different stage. That's the entire point.
Win Rate by Performance Tier
RAIN Group surveyed 472 sellers and executives and found an average win rate of 47%. But the distribution matters most: elite performers (top 7%) hit ~75%, top 20% hit 62%, and everyone else sits around 40%.
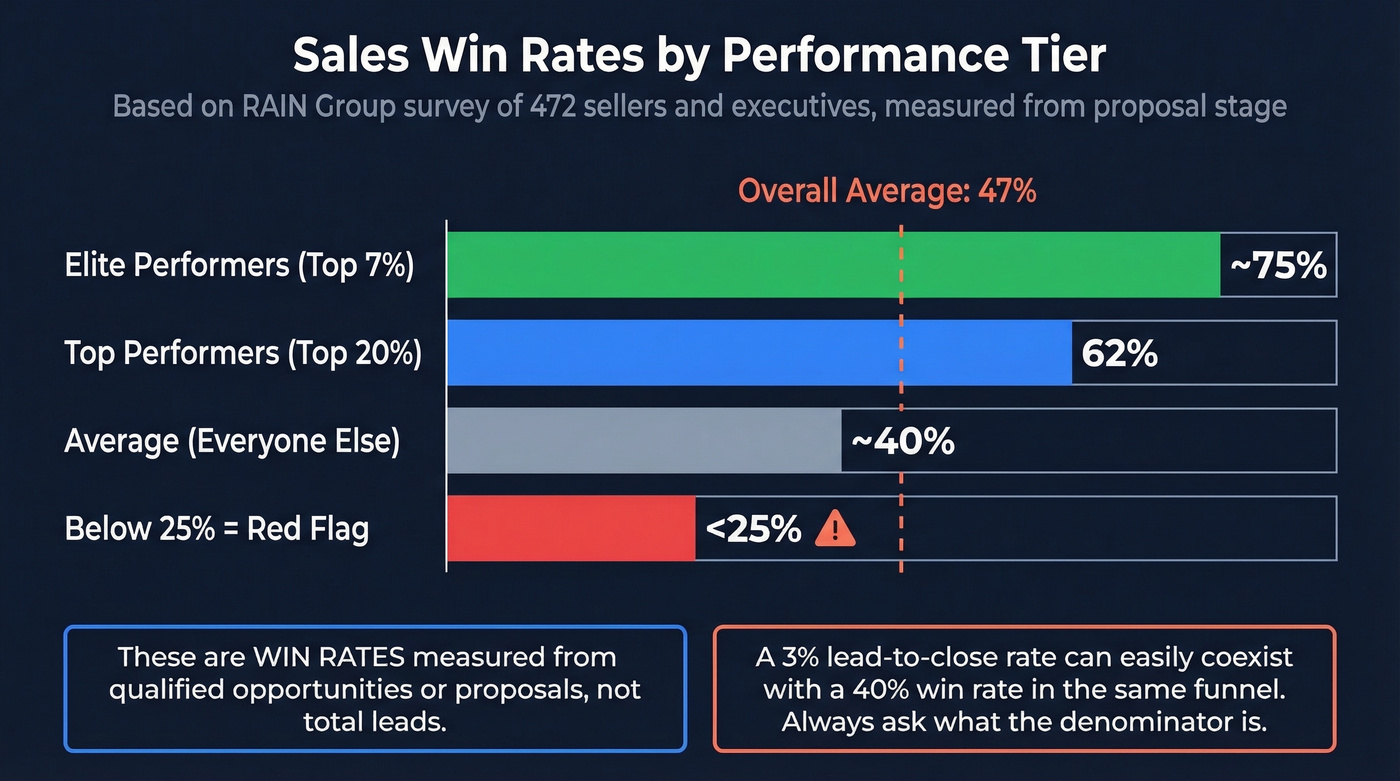
These numbers look dramatically higher than lead-to-close rates because RAIN measures from the proposal stage. A Reddit practitioner reported ~32% opp-to-close mixing inbound and outbound in SaaS, which tracks with the First Page Sage data. In our experience, sub-25% opp-to-close in most B2B SaaS funnels is a sales execution red flag, not a "lead quality" mystery.
How to Calculate It Correctly
1. Decide your denominator and document it. Total leads? MQLs? SQLs? Opportunities? Pick one and make sure every report uses the same starting point.
2. Separate disqualified from closed-lost. This alone can shift your reported rate dramatically.
3. Cohort by lead creation month, not close month. A deal that closed in March but was created in October belongs in October's cohort. Otherwise you're mixing pipeline vintages and the trend line becomes noise.
4. Segment by source, rep, and deal size. A blended close rate hides everything interesting. Your enterprise segment and your SMB self-serve funnel aren't the same business - don't average them together.
5. Clean your data first. If a meaningful share of your emails bounce and many phone numbers are disconnected, those unreachable leads still sit in your denominator. Prospeo's 7-day data refresh cycle catches contact changes before they become dead weight, so your rate reflects actual sales performance rather than data rot. (If you're diagnosing bounces specifically, start with email bounce rate.)
How to Improve Your Close Rate
Align Marketing and Sales
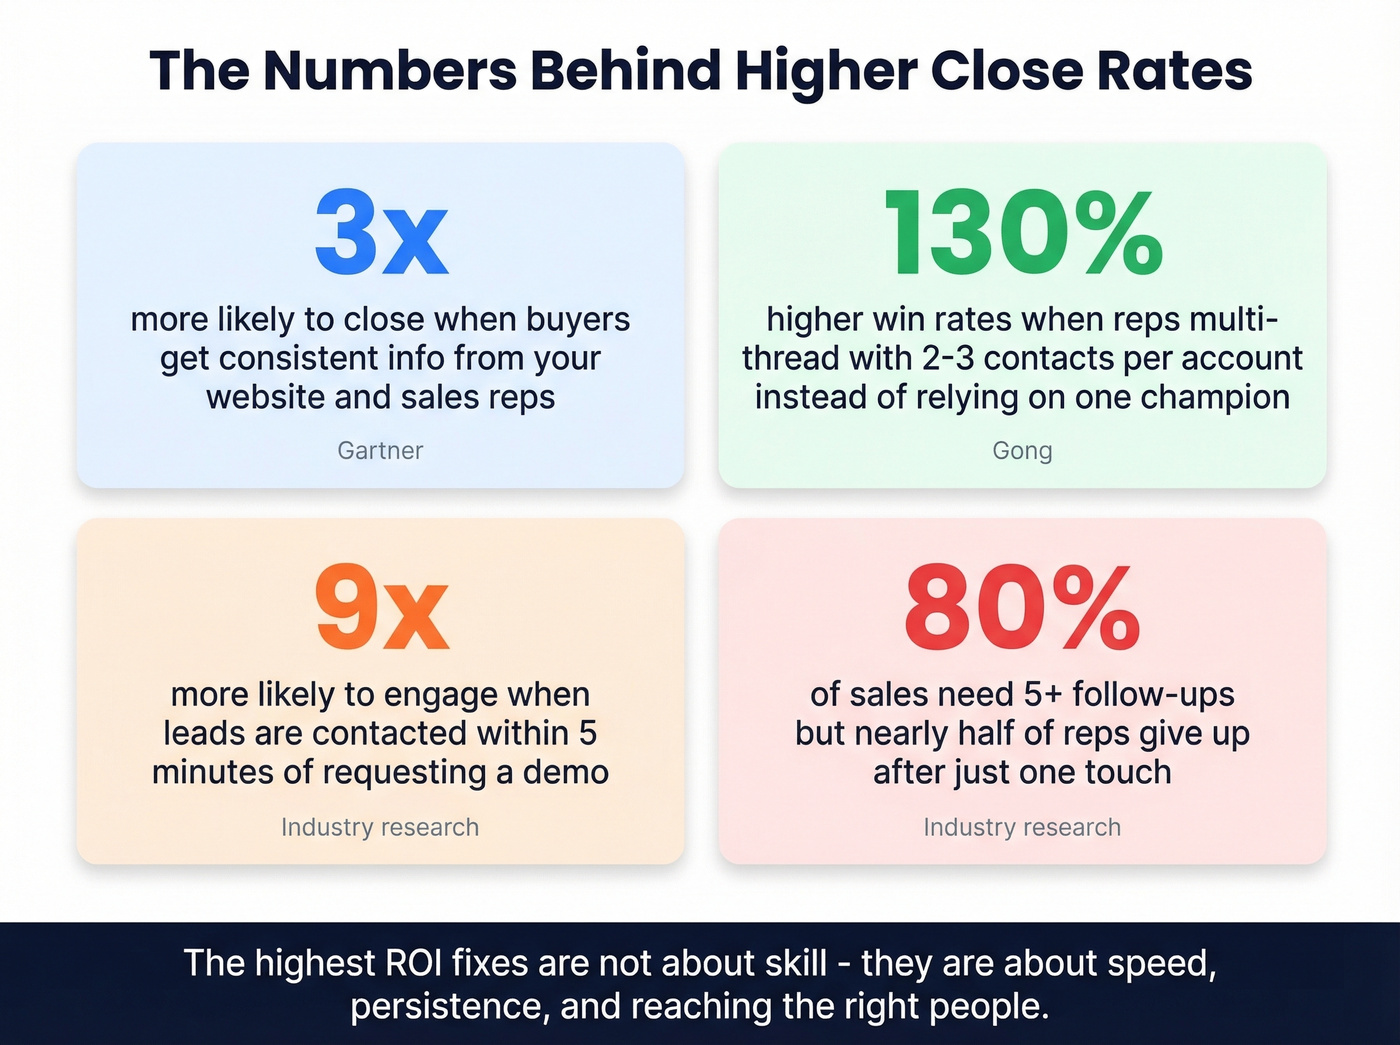
Buyers are 3x more likely to complete a deal when they receive consistent information from your website and sales reps. Yet 58% experience discrepancies. Start with a shared definition of "qualified lead," align on messaging, and watch the handoff friction drop.
If you need a practical system for this, build a shared lead scoring model and enforce it in routing.
Qualify Harder, Disqualify Faster
If your disqualified-to-closed-lost ratio is skewed, your qualification criteria are too loose. BANT works for transactional sales. MEDDIC works for complex deals. Either framework forces reps to disqualify early instead of dragging unwinnable deals through the pipeline.
Here's the thing: most teams don't have a close-rate problem - they have a disqualification problem. They let bad leads linger because an inflated pipeline looks good in the board deck. Skip this advice if your pipeline is already lean and your reps are genuinely losing at the proposal stage; in that case, your problem is competitive positioning, not qualification.
Multi-Thread Every Deal
Modern buying groups include 8-13 stakeholders. If your rep is single-threaded to one champion and that champion goes on vacation, the deal dies. Multi-threading - building relationships with 2-3 contacts per account - lifts win rates by roughly 130% according to Gong's analysis. For any deal above five figures, single-threading is malpractice.
Speed and Persistence Beat Skill
Two stats that should change how you run your team: leads contacted within five minutes are 9x more likely to engage, and 80% of sales require at least five follow-ups - yet nearly half of reps give up after one touch. Route inbound leads to available reps in real time, build follow-up cadences into your sequences, and hold reps accountable to completing them. Speed-to-lead is the highest-ROI process fix most teams ignore.
If you want plug-and-play messaging, keep a set of sales follow-up templates your team can personalize fast.
Verify Your Contact Data
Bad emails and disconnected phone numbers mean wasted activity and unreachable leads that still count in your denominator. That's a data problem, not a sales problem. Prospeo catches this at the source - 98% email accuracy, 125M+ verified mobile numbers, and a 7-day refresh cycle so contacts don't go stale between capture and outreach. Snyk dropped their bounce rate from 35-40% to under 5% and saw AE-sourced pipeline jump 180%.
Multi-threading deals with 2+ stakeholders is proven to lift win rates - but only if you can actually reach them. Prospeo gives you 125M+ verified mobile numbers with a 30% pickup rate and direct emails for every stakeholder in the deal, at $0.01 per contact.
Reach every decision-maker, close more of what's already in your pipeline.
FAQ
What is a good lead-to-close rate?
For B2B SaaS, expect low single digits (2-5%) when measured from total website leads. Opportunity-to-close rates typically run 30-40%. Anyone quoting "20%" without specifying the starting stage is comparing different metrics. Always confirm the denominator before benchmarking.
What's the difference between close rate and win rate?
Close rate divides deals won by total leads, measuring full-funnel efficiency. Win rate divides deals won by qualified opportunities that received a proposal - a smaller denominator that produces higher numbers. RAIN Group's average win rate is 47%, while the same teams' lead-to-close rates are often 3-5%.
How does bad data affect my close rate?
Bounced emails and disconnected numbers create unreachable leads that still inflate your denominator. Your reps never had a real shot at closing them, but they drag your rate down. Cleaning contact data before outreach ensures your denominator only includes contacts that are actually reachable - Snyk cut bounces from 35-40% to under 5% after switching to verified data.
How do I improve lead-to-close rate without more leads?
Disqualify faster, multi-thread deals with 2+ stakeholders, and respond to inbound leads within five minutes. These three changes address the biggest pipeline leaks - bad-fit leads lingering, single-threaded deals dying, and slow follow-up killing warm interest - without requiring a single additional lead.