Market Potential Calculation in 2026: Formulas, Worked Examples, Real Data
42% of startups fail because nobody wants what they built. Not a funding problem. Not a product problem. A market potential problem - they never calculated whether enough buyers existed at a price that made the business work.
The teams that do attempt market sizing usually get it wrong. As one investor who reviewed hundreds of pitch decks put it on r/Entrepreneur: "Most market size slides are bullshit, and investors know it. TAM/SAM/SOM with numbers pulled from Statista doesn't impress anyone. Show me YOUR math based on YOUR customer segments."
That's the bar. Let's clear it.
Three Methods, One Goal
Three common methods exist for estimating market potential. Master one, understand all three:
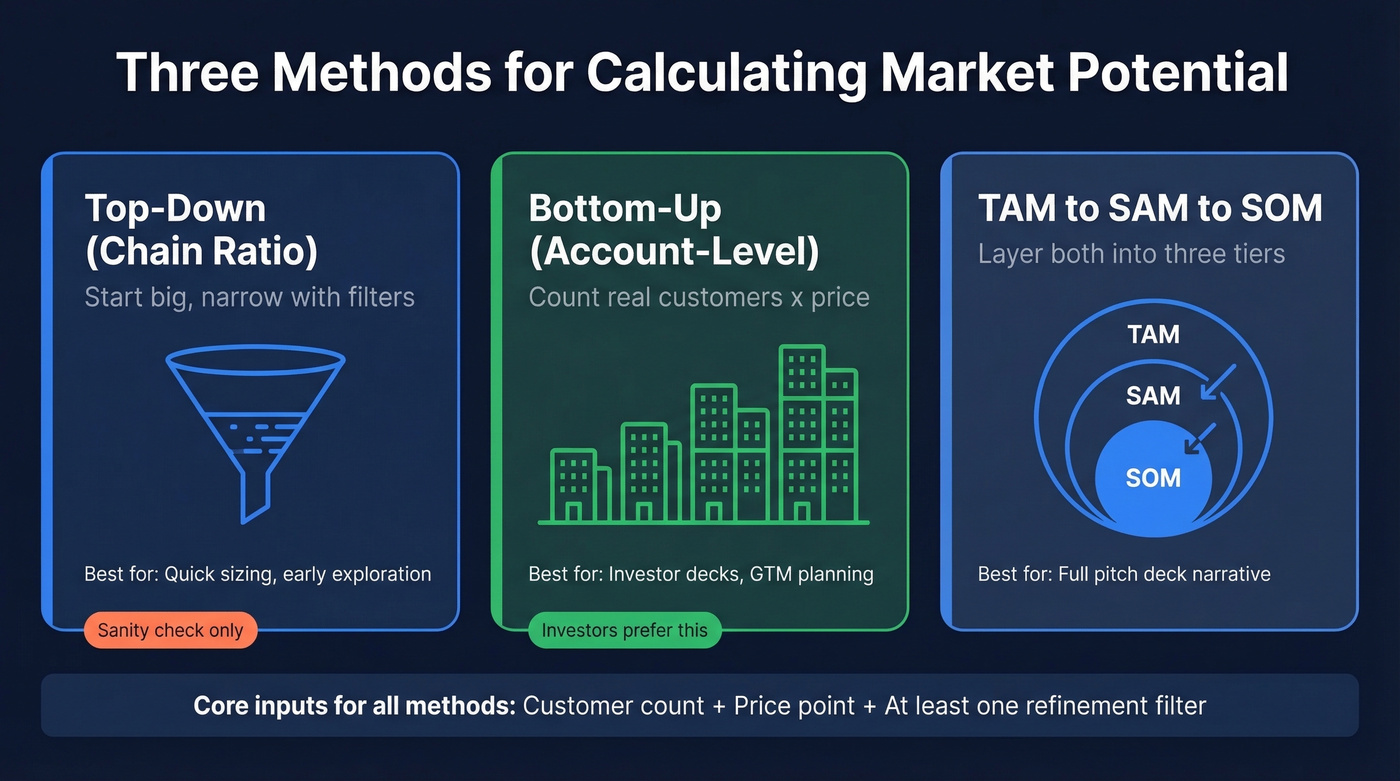
- Top-down (chain ratio): Start with a large population, apply narrowing filters. Fast but prone to inflation.
- Bottom-up (account-level): Count actual potential customers, multiply by price. The method investors trust.
- TAM to SAM to SOM: Layer both approaches to show total opportunity, serviceable market, and realistic capture.
Core inputs regardless of method: a count of potential customers, a price point (ACV, AOV, or ASP), and at least one refinement filter proving you've thought about who won't buy.
Key Definitions
These terms get used interchangeably, and that's where confusion starts.
| Term | Definition | Think of It As |
|---|---|---|
| Market potential | Theoretical max demand under ideal conditions | The ceiling |
| Market size | Revenue across all players in a segment | Current reality |
| Market share | Your % of total revenue | Your slice |
| TAM | Total addressable market at your price | The ceiling for you |
| SAM | Serviceable addressable market - the segment you can reach | Your realistic arena |
| SOM | Serviceable obtainable market - what you'll capture in 3-5 years | Your GTM plan |
As Bruce Clark frames it in his market potential breakdown, market potential is an "imaginary number" - a theoretical maximum that's "ultimately unknowable." That's actually freeing. Your job isn't to nail the exact number. It's to build a defensible demand estimation that narrows the unknowable into something useful.
The Core Formulas
Every sizing exercise boils down to one of three formulas. They look different but share the same DNA: count the buyers, multiply by the price.
Formula 1 - Simple market potential: Market Potential = Number of Potential Buyers x Average Price
Formula 2 - Chain ratio (top-down refinement): Q = n x p x q Where n = number of buyers, p = average price, and q = average per capita consumption. Chain multiple filters to narrow progressively.
Formula 3 - TAM via ACV (Wall Street Prep): TAM = Total Potential Customers x ACV
For SaaS: ACV = Total Contract Value / Contract Term in Years
The formulas are simple. The hard part is getting the inputs right - especially the customer count. That's where methodology matters.
Top-Down (Chain Ratio)
Start with a big number and whittle it down. Bruce Clark's chain ratio example makes this concrete:
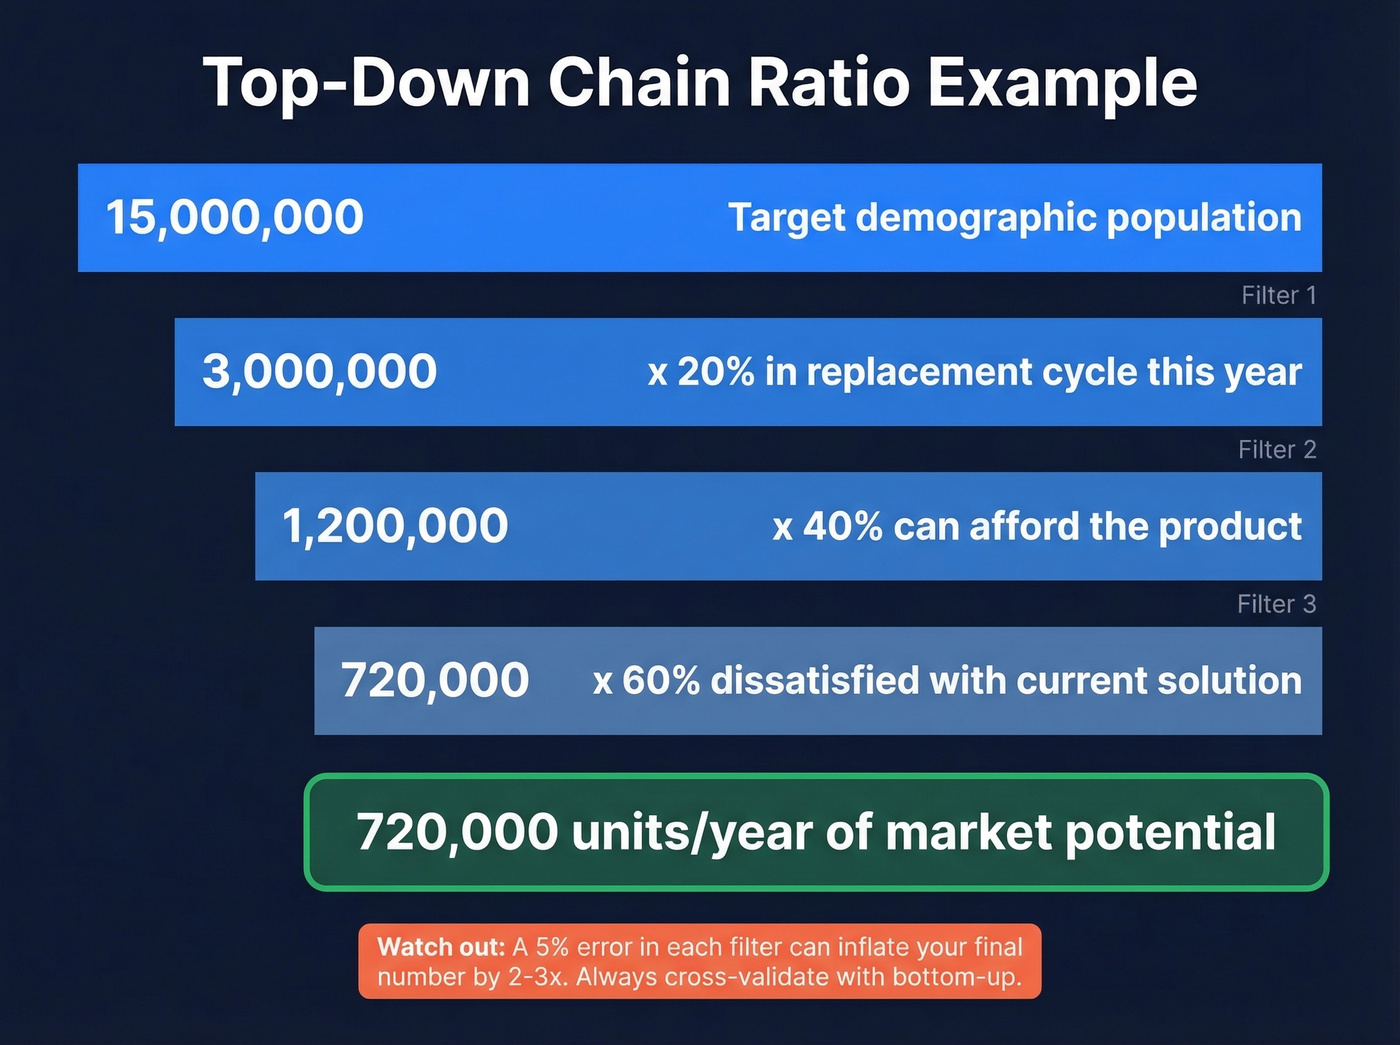
- 15 million people in the target demographic
- x 20% are in the replacement cycle this year
- x 40% can afford the product
- x 60% are dissatisfied with their current solution
- = 720,000 units/year of market potential
Each multiplier is a filter that narrows the population. You can build this in 20 minutes with a few industry reports and some reasonable assumptions.
Here's the thing: top-down is seductive because it always produces big numbers. Every filter you apply still leaves a lot of people, which is exactly why investors are skeptical of it as a standalone method. The assumptions compound, and a 5% error in each filter can inflate your final number by 2-3x. Beyond demographics, consider behavioral filters like purchase intent, tech adoption readiness, or switching propensity to sharpen your chain ratio multipliers. Use top-down as a directional check, not your primary estimate.
Bottom-Up (Account-Level)
This is the method that gets investor heads nodding. You start with actual customers you can name or count, not a macro population you're slicing.
The MaRS worked example for hospital equipment:
- 1,300 hospitals in the target geography
- x 70% market penetration rate based on regulatory requirements
- = 910 hospitals that will buy
- x $2.5M average deal size
- = $2.275 billion market value
Underscore VC offers a smaller-scale version: 175 hospitals, roughly 80 doctors per hospital, at $3,500 per doctor per year = a $50M addressable market. Two different scales, same transparent logic. An investor can challenge any single assumption without dismissing the whole estimate.
For B2B, the hardest step is counting companies that match your ICP. We've found that the fastest way to move from "estimate" to "enumeration" is querying a database with real company records - filtering by industry, headcount, revenue, and technographics - instead of guessing from census data. Prospeo's 300M+ profiles with 30+ search filters make this straightforward: instead of estimating how many mid-market SaaS companies exist in North America, you query and count them.
TAM to SAM to SOM Walkthrough
This method layers top-down and bottom-up thinking into a three-tier framework. The Wise UK payroll example is one of the cleanest walkthroughs we've seen:
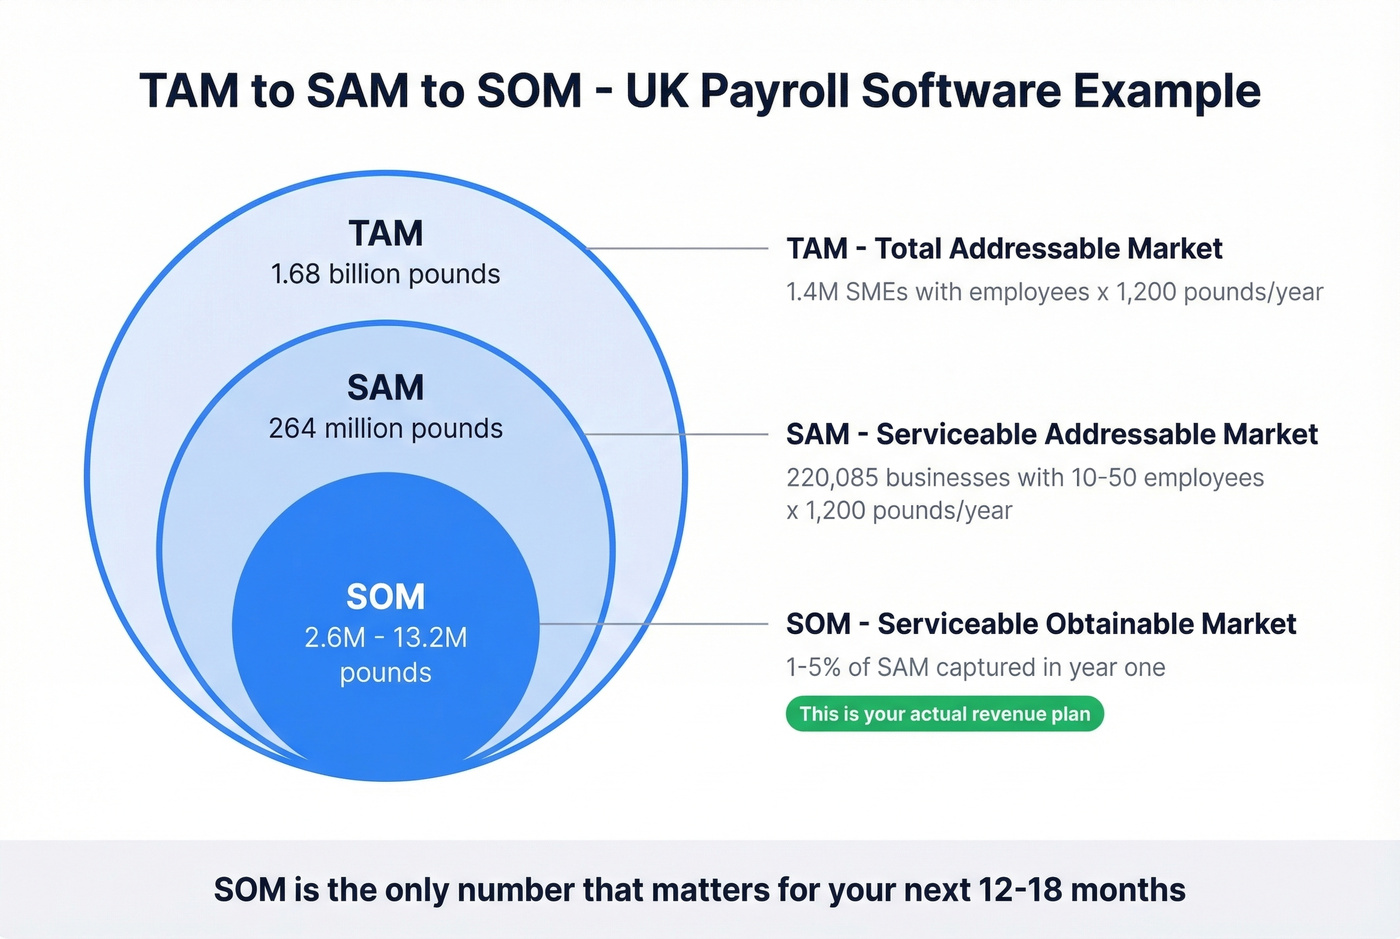
TAM: 5.7 million UK SMEs exist. Exclude the 4.3 million with zero employees - they don't need payroll software. That leaves 1.4 million SMEs with employees. At £1,200/year average spend, TAM = £1.68 billion.
SAM: The product targets companies with 10-50 employees. That segment contains 220,085 businesses. SAM = 220,085 x £1,200 = ~£264 million.
SOM: A seed-stage startup competing against established payroll providers capturing 1-5% of SAM in year one is aggressive but defensible. That's £2.6M-£13.2M in revenue.
SOM is the only number that matters for your next 12-18 months. TAM tells investors the opportunity is big enough to be interesting. SAM proves you've thought about who you're actually selling to. SOM is your revenue plan with a market-sizing wrapper - and investors who've seen a thousand pitch decks can tell instantly whether your SOM assumptions are grounded or aspirational.
Bottom-up sizing only works when you can count real companies that match your ICP. Prospeo's database of 300M+ profiles with 30+ filters - industry, headcount, revenue, technographics, funding - lets you enumerate your TAM instead of guessing it.
Turn market potential from an estimate into an exact count.
Top-Down vs Bottom-Up: When to Use Each
| Dimension | Top-Down | Bottom-Up |
|---|---|---|
| How it works | Macro market, narrow with filters | Count customers x price |
| Best for | Quick sizing, early exploration | Investor decks, GTM planning |
| Strengths | Fast, uses available data | Transparent, defensible |
| Risks | Inflated estimates | Can understate upside |
| Investor preference | Sanity check only | Primary method |
80% of pitch deck templates still push founders toward top-down slides. That's a problem. Investors have seen enough inflated TAM numbers to be reflexively skeptical. Use bottom-up as your primary method and top-down as a sanity check. If the two estimates land within 2x of each other, you're in good shape. If they're 10x apart, one of your assumptions is broken.
Why Market Potential Isn't Revenue
Market potential is a ceiling. Actual sales always fall short - and understanding why makes your estimate credible instead of naive.
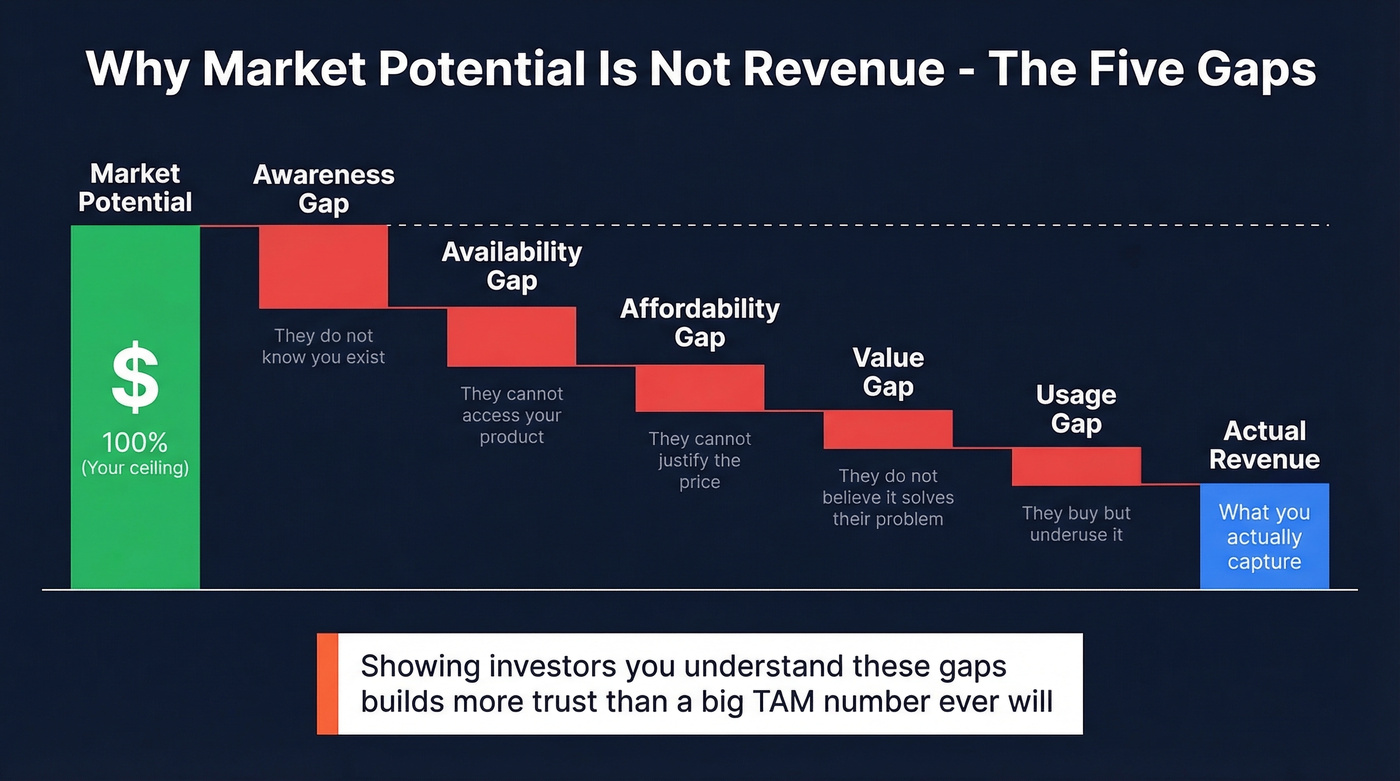
Bruce Clark's five gaps framework explains the distance between potential and reality. Think of it as a waterfall: your theoretical maximum gets reduced at each stage. Prospects who don't know you exist create an awareness gap. Those who can't access your product due to geography or distribution create an availability gap. Buyers who want the product but can't justify the price create an affordability gap. Prospects who are aware and can afford it but don't believe it solves their problem well enough create a value gap. And customers who buy but underuse the product, reducing expansion revenue, create a usage gap.
Accounting for even two or three of these gaps in your pitch deck separates you from founders who present TAM as if it's a revenue forecast. Investors know the gaps exist. Showing that you know they exist builds trust.
Where to Get Reliable Data
The quality of your market potential calculation depends entirely on the quality of your inputs.
Free government sources (recommended by the SBA): NAICS codes and U.S. Census Business Builder for industry classifications, Bureau of Labor Statistics for employment data, Bureau of Economic Analysis for economic indicators, and Statistics of U.S. Businesses for industry-specific business counts. The U.S. Census Economic Census is thorough but only updated every five years.
Free consulting insights: McKinsey Global Institute, Bain Insights, and BCG Henderson Institute publish free research with market-level data points. These won't give you a complete TAM, but they provide defensible assumptions about growth rates and adoption curves.
Paid research: Gartner, Forrester, and Statista offer pre-built market forecasts. A caveat: raw Statista numbers alone won't impress investors. They've seen the same reports. Use paid research as one input, not your entire methodology.
B2B account data: For bottom-up sizing, a database with millions of filterable business profiles lets you move from estimation to enumeration. That's the difference between "we estimate 4,000 companies match our ICP" and "we queried a database and found 4,127 companies matching these exact criteria." If you're evaluating providers, start with a shortlist of B2B company data sources.

Mistakes That Inflate Your Estimate
We've reviewed dozens of market sizing slides, and the same errors keep appearing:
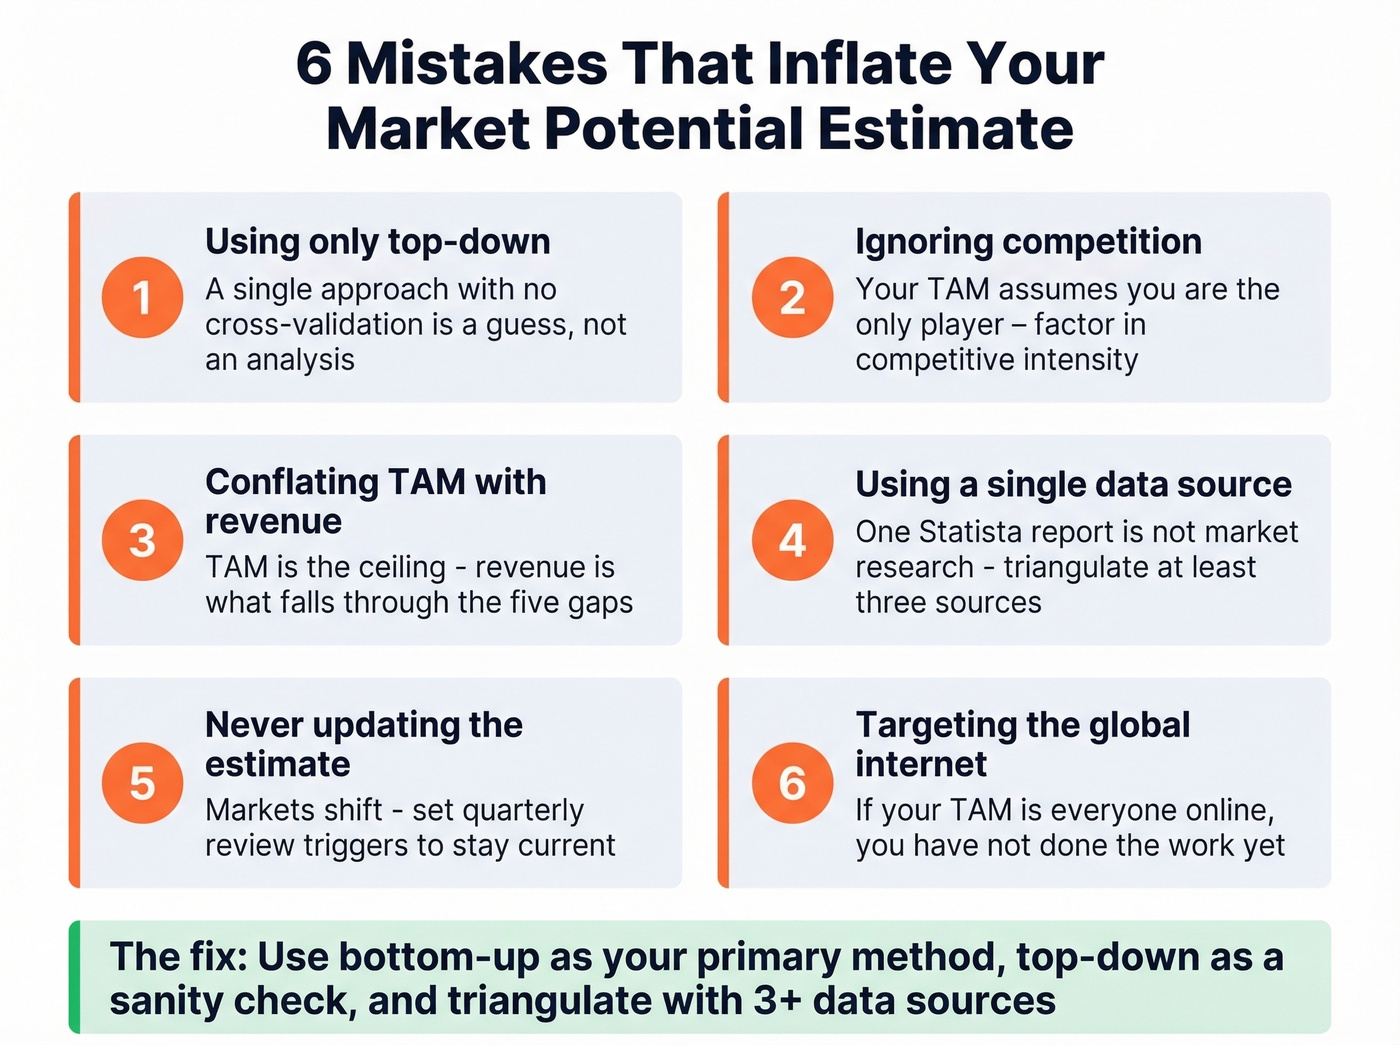
- Using only top-down. A single approach with no cross-validation is a guess, not an analysis.
- Ignoring competition. Your TAM assumes you're the only player. Factor in competitive intensity.
- Conflating TAM with revenue. TAM is the ceiling. Revenue is what falls through the five gaps.
- Using a single data source. One Statista report isn't market research. Triangulating at least three sources catches most estimation errors.
- Never updating the estimate. Markets shift. Set quarterly review triggers, or layer in intent data signals to track changes between reviews.
- Targeting "the global internet." If your TAM slide says "all SMBs worldwide," you don't know who your customer is. Niche down.
- Skipping scenario ranges. A single number is a guess. A range - best-case, base-case, worst-case - is an analysis that shows investors you've stress-tested your assumptions.
Presenting This to Investors
Underscore VC calls it the "TAM/SAM/SOM Trap": founders include those three numbers just to fill a slide, but investors care about how you got there. A Statista screenshot with three concentric circles isn't analysis. It's decoration.
Lead with your bottom-up math. Show the segment, the customer count, the price, and the penetration assumptions. Include a top-down estimate as a sanity check - if both methods land in the same range, your credibility jumps. In our experience, the decks that get funded always show their work.
Present three estimates, not one. Show your SOM assumptions explicitly: what market share you expect to capture, over what timeframe, and why that's realistic given your go-to-market motion. Backing your SOM with a credible market penetration rate - grounded in comparable product launches or industry benchmarks - gives investors a concrete anchor instead of an optimistic guess.
The $1B TAM threshold is real for institutional VCs. If your market opportunity falls below that, you're either in a niche market (fine for bootstrapping or angel rounds) or you haven't defined the market broadly enough. If you need a tighter definition, use an addressable market framework to pressure-test your segments.
Your SOM calculation is only as good as your ability to reach the accounts in it. Prospeo gives you verified emails (98% accuracy) and direct dials for every company in your serviceable market - at $0.01 per lead, not $1.
Calculate your market, then go capture it with verified contact data.
Advanced: Monte Carlo Sizing
Single-point estimates are fragile. Change one assumption by 10% and your entire TAM shifts. Monte Carlo simulation fixes this by running thousands of scenarios instead of one.
The concept, per Investopedia, is straightforward: instead of plugging in a single value for each variable - adoption rate, price sensitivity, churn - you define a distribution for each one. Run 10,000 iterations, each pulling random values from those distributions, and aggregate the results. The output isn't one TAM number but a probability distribution showing the likelihood of different market sizes.
Results tend to be right-skewed, meaning a few optimistic scenarios pull the mean above the median. That mirrors reality in venture-backed markets. Skip this for seed-stage decks, but it's powerful for Series B+ when you're stress-testing expansion assumptions.
FAQ
What's the difference between market potential and TAM?
Market potential is the theoretical ceiling of demand under ideal conditions - every possible buyer, no constraints. TAM is the total revenue opportunity for a specific product at a specific price point. TAM is always a subset of market potential because it assumes a defined product targeting a particular segment.
How often should I update my estimate?
Quarterly at minimum, and always after major market shifts like new regulation, competitor entry, or macroeconomic changes. Treat your sizing as a living document, not a one-time pitch deck slide you never revisit.
What if my market lacks reliable data?
Use primary research: customer interviews, pilot data, and triangulation from adjacent markets. Bottom-up estimates built from even 20-30 customer conversations beat top-down guesses from unreliable reports. For B2B, a database with real company counts by industry and headcount replaces outdated directories with actual numbers.
How do I count B2B accounts for bottom-up sizing?
Use a B2B database with filtering capabilities - filter by industry, headcount, revenue, and technographics to get an actual account count instead of an assumption. Export the filtered list, and you've got both your market sizing input and your first prospecting list in one step.