New Business Pipeline Generation: A Data-Driven System for 2026
Your VP asks why pipeline is down 30% this quarter. Nobody can answer. Not the SDR manager, not the demand gen lead, not the RevOps analyst staring at a Salesforce dashboard with 14 reports and zero clarity. Meanwhile, the outbound team sent 10,000 emails last month - 3,500 bounced, the domain got flagged, and now even the good prospects aren't seeing your messages. Down the hall, a team that canceled ZoomInfo six months ago has no outbound engine at all - just a CRM full of stale contacts and a vague plan to "figure it out next quarter."
These aren't hypothetical scenarios. They're Tuesday.
The consensus on r/sales is blunt: more volume has "burnt more bridges in the long run." Most pipeline generation advice is a vendor pitch in disguise. This piece gives you the system, the math, and the benchmarks to actually build new business pipeline generation that works - so you can create more opportunities without burning your domain or your team.
What Pipeline Generation Actually Is
Pipeline generation isn't lead generation with a fancier name. Lead gen fills the top of your funnel with names and email addresses. Pipeline generation is the full-cycle system that moves net-new prospects through defined stages - MQL, SQL, opportunity, opportunity - to closed revenue.
Lead gen is an input. Pipeline gen is the engine. In enterprise sales, it means detecting signals inside target accounts and acting on them before an RFP ever gets written. For SMBs, it's simpler but equally systematic: identify, reach, qualify, close. Not a tactic. A system.
Why Winning New Business Is Harder
Only 24% of reps exceed their yearly quota. Around 60% of deals are lost not to a competitor, but to indecision - prospects who simply choose to do nothing. The buying group has swelled to an average of 13 people, buying teams consume a mountain of content before any decision gets made, and 58% of SDR leaders say their biggest pipeline challenge isn't process but competition.
Buyers themselves have changed. 80% of B2B decision-makers now prefer digital engagement over in-person interactions, and 89% use generative AI as a top information source across buying phases. Your prospects are more informed, more skeptical, and harder to reach than at any point in the last decade.
Yet most teams respond by doing more of what isn't working - more emails, more automation, more tools. One Reddit poster captured it perfectly: "if prospects don't have the time and interest to respond to a human, they won't respond to AI." The answer isn't volume. It's precision, persistence, and a system that measures what matters.
Pipeline Math: Know Your Numbers
Before you optimize tactics, know your numbers. We've seen teams spend six months tweaking email copy when the real problem was a 4% MQL-to-SQL conversion rate nobody had ever calculated.
Stage-by-Stage Conversion Benchmarks
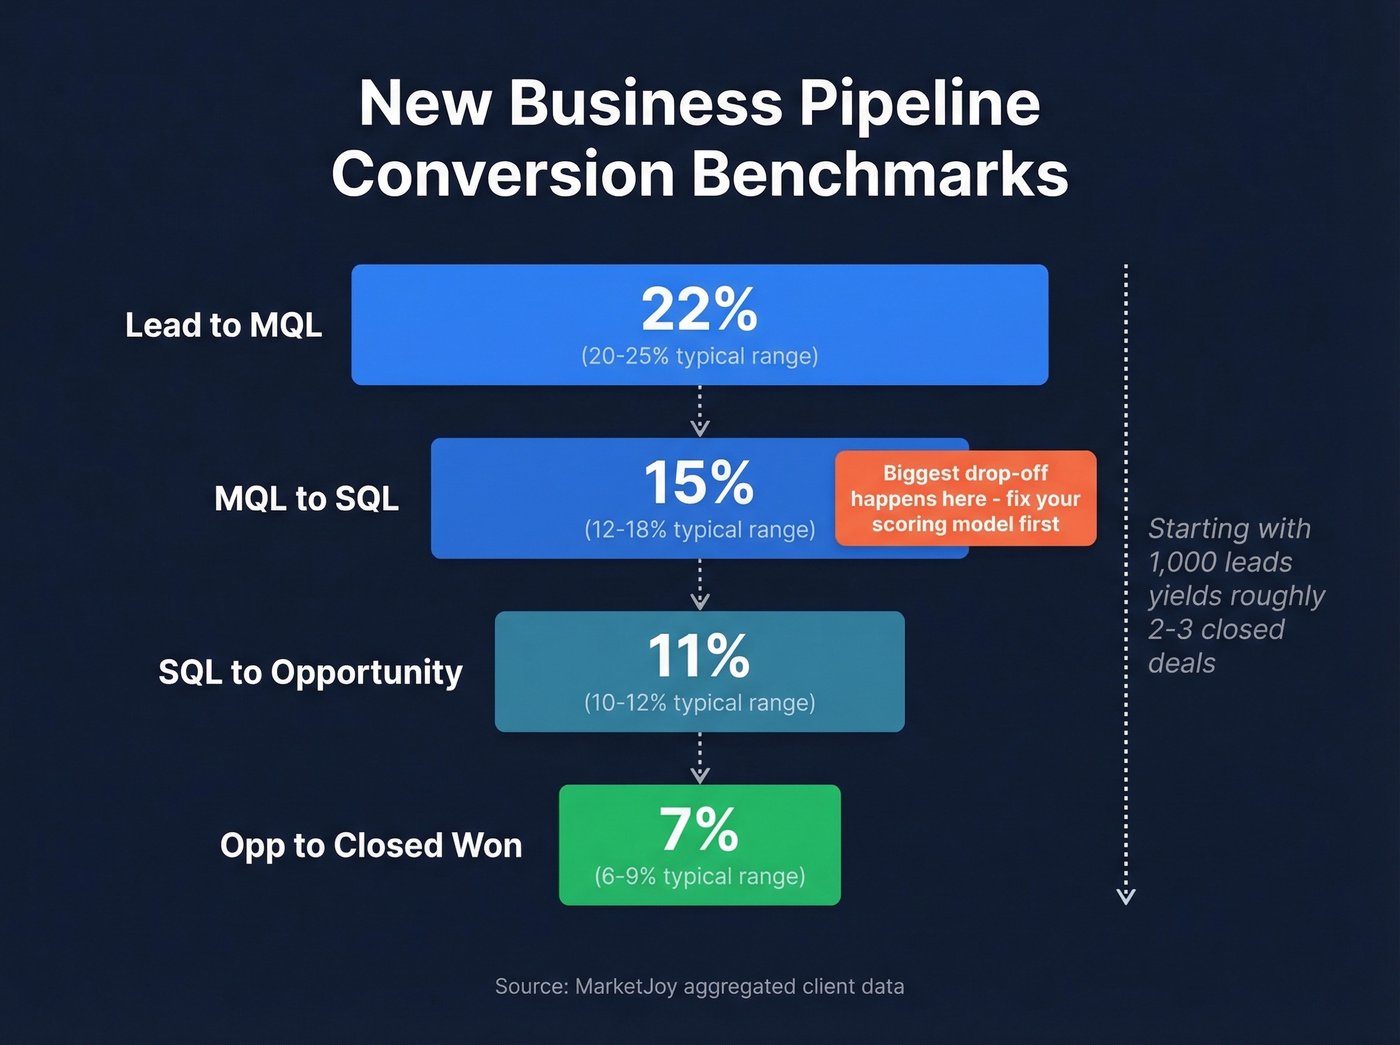
These benchmarks from MarketJoy's aggregated client data give you a baseline:
| Stage | Benchmark | Typical Range |
|---|---|---|
| Lead to MQL | 22% | 20-25% |
| MQL to SQL | 15% | 12-18% |
| SQL to Opportunity | 11% | 10-12% |
| Opp to Closed-Won | 7% | 6-9% |
The biggest drop-off happens at MQL to SQL. That's where marketing's definition of "qualified" collides with sales' definition of "worth my time." If your MQL-to-SQL rate is below 12%, the problem isn't your SDRs - it's your scoring model (and usually your lead scoring model).
One stat worth internalizing: contacting leads within 24 hours increases conversion by 5x. Responding within 5 minutes pushes that to 9x. Speed-to-lead isn't a nice-to-have. It's a multiplier on everything else you're doing.
Industry-Specific Benchmarks
Your numbers will vary by vertical. FirstPageSage's benchmark data breaks it down:
| Industry | Lead to MQL | MQL to SQL | SQL to Opp | SQL to Closed |
|---|---|---|---|---|
| B2B SaaS | 39% | 38% | 42% | 37% |
| Cybersecurity | 24% | 40% | 43% | 46% |
| IT & Managed Services | 19% | 38% | 41% | 46% |
B2B SaaS teams see higher top-of-funnel conversion but lower close rates. IT services converts fewer leads initially but closes a much higher percentage of what makes it through. Calibrate to your own vertical within two quarters - generic benchmarks are a starting point, not a target.
Sales Velocity Formula
This is the single most useful formula for measuring pipeline health:
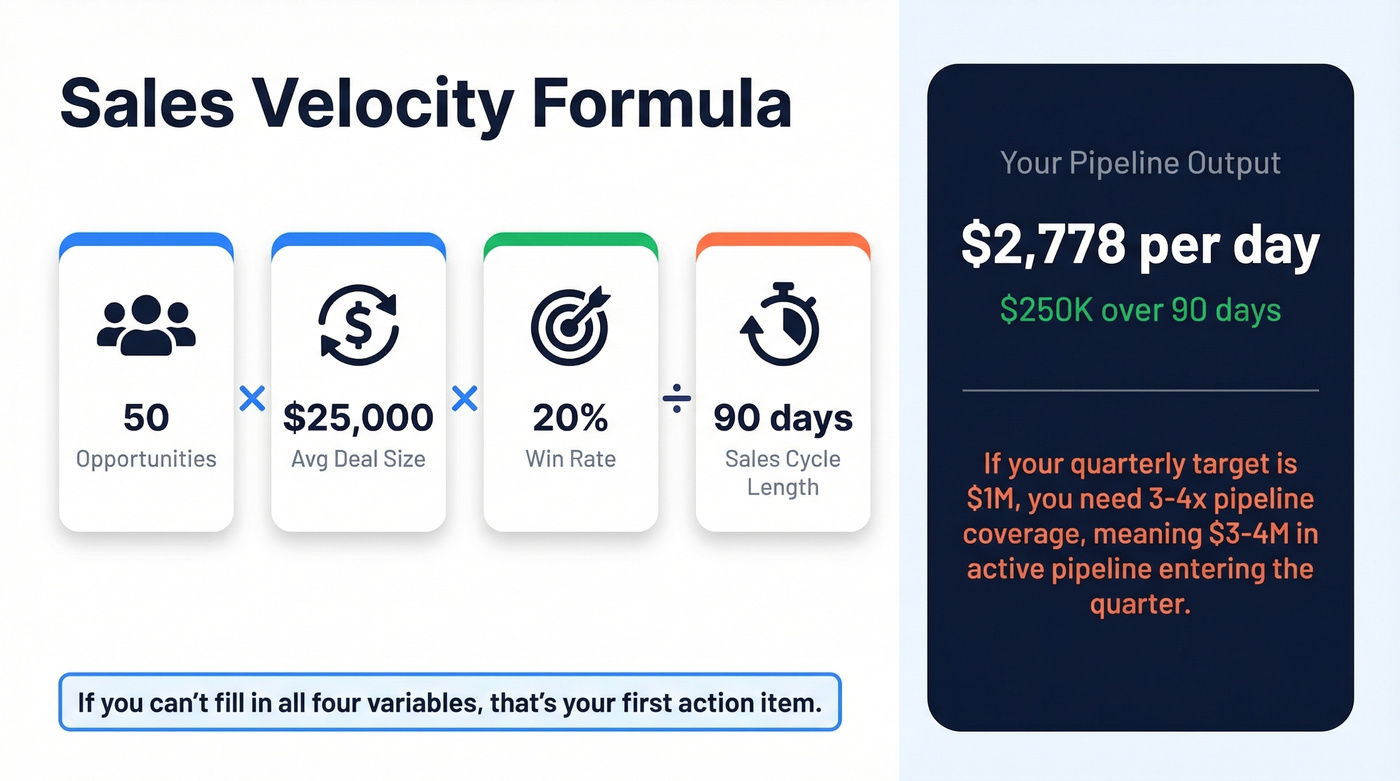
Sales Velocity = (# Opportunities x Avg Deal Size x Win Rate) / Avg Sales Cycle Length
Say you've got 50 opportunities in pipeline, your average deal is $25,000, your win rate is 20%, and your average sales cycle runs 90 days.
Velocity = (50 x $25,000 x 0.20) / 90 = $2,778/day
That's roughly $250K over a 90-day cycle from your current pipeline. If your quarterly target is $1M, you need a pipeline coverage ratio of 3-4x, meaning $3-4M in active pipeline entering the quarter. Work backward through your stage conversion rates to calculate the lead volume required at the top.
Plug your own numbers into the velocity formula - if you can't fill in all four variables, that's your first action item.
Most companies don't have a pipeline problem. They have a pipeline math problem.
Building Your Pipeline System
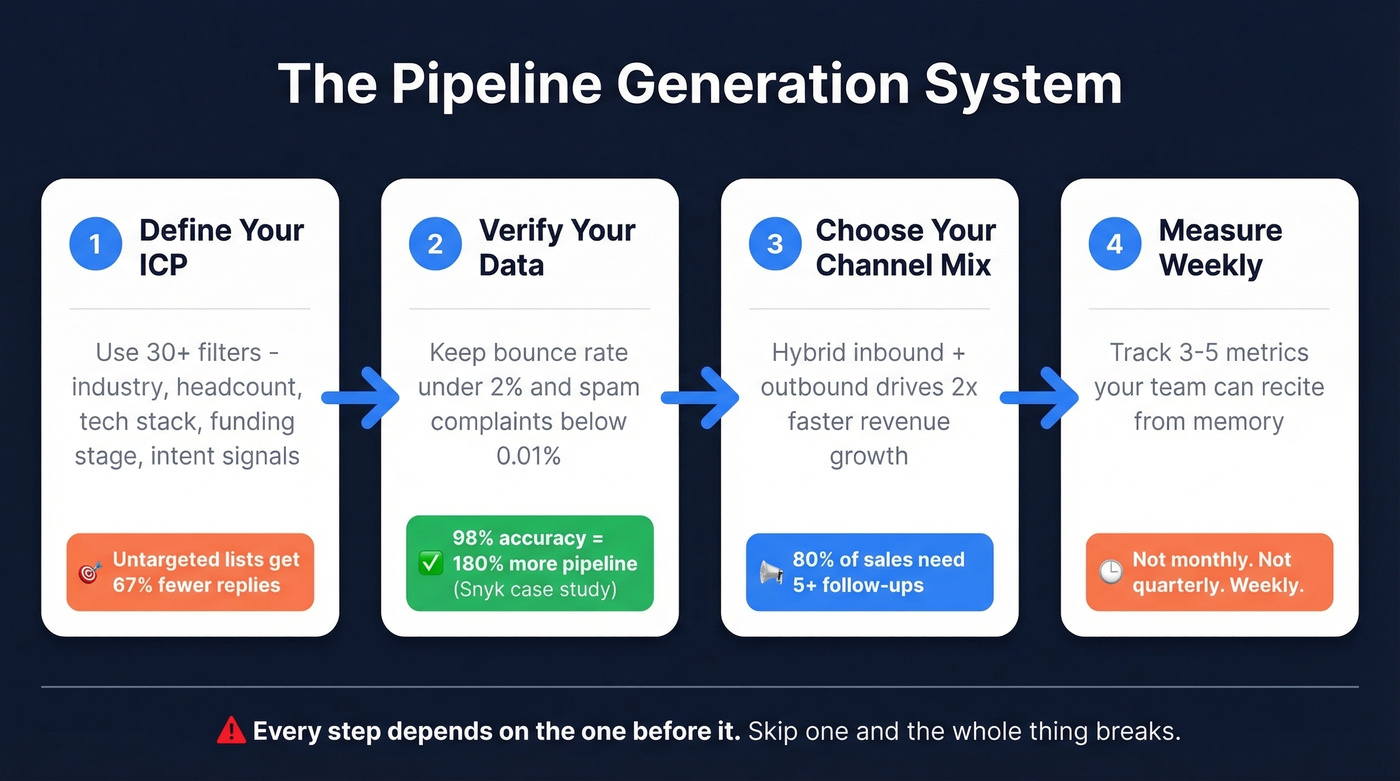
The system has four steps: define your ICP, verify your data, choose your channel mix, and measure weekly. Every step depends on the one before it. Skip one and the whole thing breaks.
Define Your ICP First
For enterprise teams, your target account set is fixed. You can't "add more leads" to fix a pipeline gap - you need better signal detection within the accounts that actually matter. For growth-stage companies, use 30+ filters to define your ICP precisely: industry, headcount, tech stack, funding stage, department growth, buyer intent signals. Untargeted lists get 67% fewer replies. Precision isn't optional.
If you need a starting point, use an ideal customer profile template and refine it with firmographic filters and firmographic and technographic data.
Fix Your Data
Here's the thing: none of the tactics in this article matter if your data is bad. Keep your bounce rate under 2% and spam complaint rate below 0.01%. Those aren't suggestions - they're the thresholds that determine whether your emails reach inboxes or spam folders. (If you’re not tracking it, start with email bounce rate and an email deliverability guide.)
The results when teams fix this are stark. Snyk's 50-person AE team was running bounce rates of 35-40%. After switching to verified data, bounces dropped under 5%, AE-sourced pipeline jumped 180%, and they now generate 200+ new opportunities per month. Meritt tripled pipeline from $100K to $300K per week after getting bounce rates under 4%. Clean data isn't a nice-to-have - it's the foundation your entire revenue engine sits on.
Prospeo handles this at the foundation level with 98% email accuracy, 300M+ professional profiles, and a 7-day data refresh cycle versus the 6-week industry average. The Chrome extension lets you pull verified emails and direct dials from any website in one click. Where enterprise data platforms run $15-40K/year, Prospeo operates at roughly $0.01 per email with a free tier to start.
| Factor | ZoomInfo (typical) | Prospeo |
|---|---|---|
| Annual cost | $15-40K | ~$0.01/email, free tier |
| Email accuracy | ~87% | 98% |
| Data refresh | 6 weeks | 7 days |
| Contract | Annual, sales-gated | No contract, self-serve |
| Mobile pickup rate | ~12.5% | 30% |
You just calculated your pipeline coverage ratio. Now ask: how much of that pipeline is built on emails that actually reach inboxes? Prospeo delivers 98% email accuracy across 300M+ profiles with a 7-day refresh cycle - so your velocity formula doesn't collapse at step one.
Stop generating pipeline on a foundation of bad data.
Choose Your Channel Mix
Companies using a hybrid of inbound and outbound see 2x faster revenue growth versus single-channel approaches. Inbound leads cost up to 60% less to acquire. Outbound produces larger deals and gives you targeting control.
The right mix depends on your deal size. For deals under $15K, lean inbound-heavy with targeted outbound for strategic accounts. Six-figure enterprise deals? Outbound drives the bus while inbound builds air cover. Either way, 80% of sales require 5+ follow-ups, and 48% of reps stop after one touch. Persistence isn't annoying - it's the baseline expectation (and it’s why teams keep a library of sales follow-up templates).
Snyk cut bounce rates from 35% to under 5% and added 200+ opportunities per month. Meritt tripled weekly pipeline to $300K. The difference wasn't tactics - it was verified data from Prospeo at $0.01 per email, with 30+ ICP filters to match.
Triple your pipeline output without tripling your team.
Nurturing: The Stage Everyone Underfunds
If your buying cycle is 6-12 months and your reps quit after one touch, you don't have a pipeline. You have a leaky bucket.
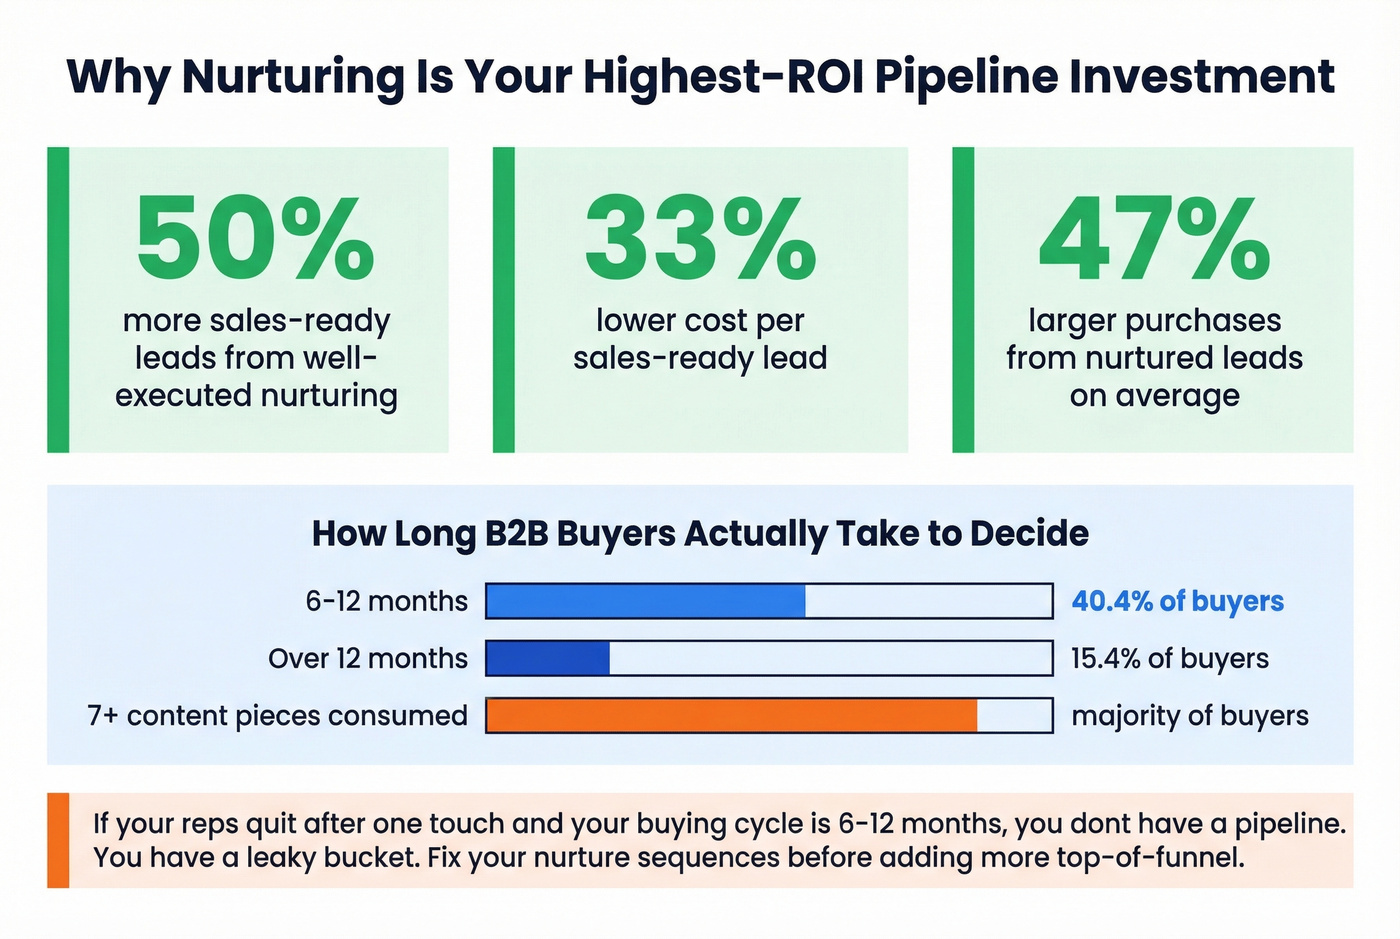
The business case is overwhelming: well-executed nurturing generates 50% more sales-ready leads at 33% lower cost. Nurtured leads make purchases that are 47% larger on average. And the timing reality makes this even more urgent - 40.4% of B2B buyers take 6-12 months to reach a purchase decision, with another 15.4% taking over a year. The majority consume more than 7 content pieces during the process.
Real nurturing means multi-channel touchpoints - email, content, events, direct mail - timed to buying signals, not arbitrary cadences. We've found that investing in the middle of the funnel pays better than pouring more leads into the top. If you're only spending on top-of-funnel, skip that and fix your nurture sequences first.
How to Measure Pipeline Health
The Sacks framework gives you the right starting point: Opportunities Created, Pipeline Value Created, Win Rate, Sales Cycle Length, and Stage Conversion Rate. Add Time-in-Stage to catch deals that are stalling, and you've got a complete picture (see pipeline health for a deeper metric set).
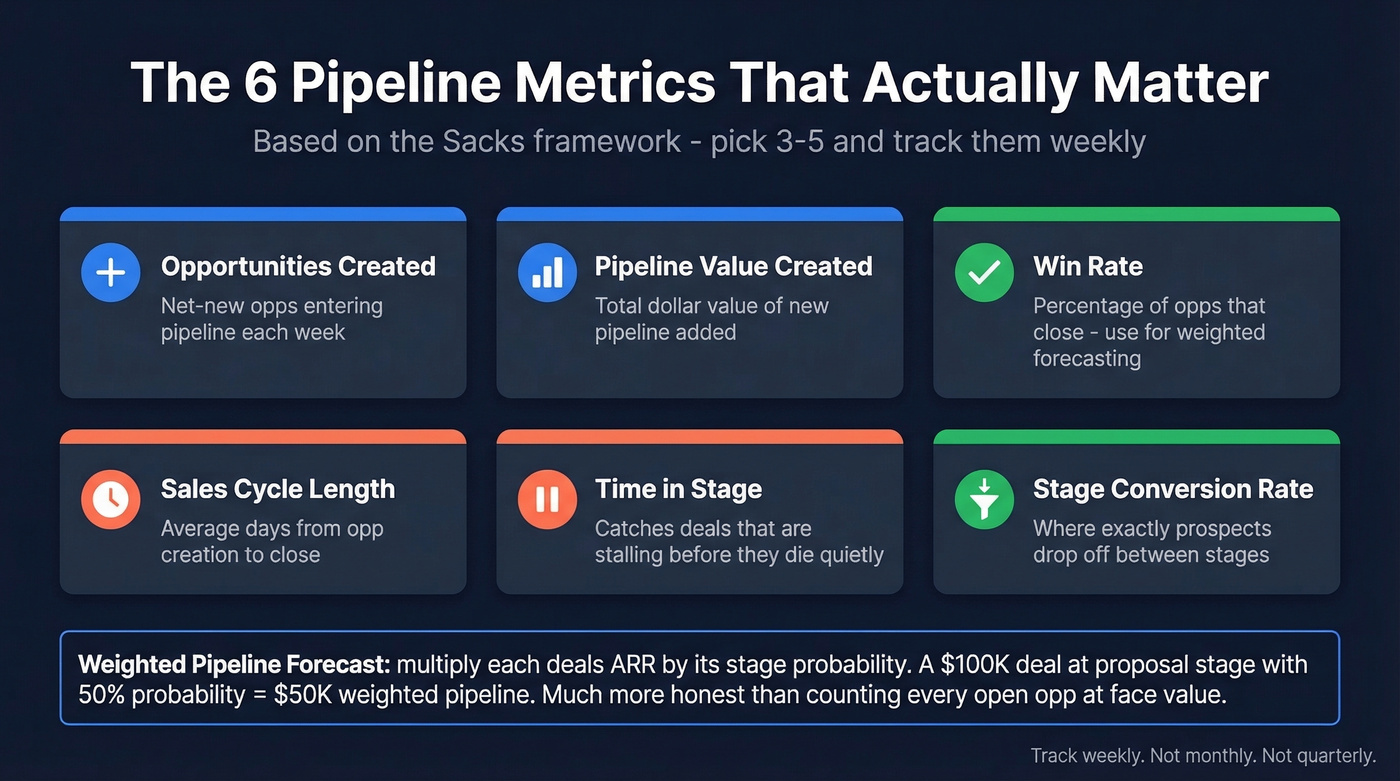
Pick 3-5 of these metrics and track them weekly. Not monthly. Not quarterly. Weekly. The UserGems approach is right: metric overload kills focus. You don't need 14 dashboard reports. You need three numbers your team can recite from memory.
Use Weighted Pipeline to forecast: sum each deal's ARR multiplied by its stage probability. A $100K deal at the proposal stage with a 50% probability contributes $50K to your weighted pipeline. This gives you a far more honest forecast than counting every open opportunity at face value (and pairs well with sales forecasting solutions).
Let's be honest about the contrarian take that keeps proving true: stop adding tools. Start measuring what you have. Many sales teams use 10+ tools and can't tell you their MQL-to-SQL conversion rate.
AI and Pipeline Generation in 2026
81% of sales teams claim to use AI, but only 19% of reps actually use the AI features built into their tools. The market for AI sales tools hit $3B in 2025 and is growing at ~13% annually, but most of that spend is shelfware.
The teams getting real results aren't using AI to write more emails. They're using it for signal detection and prioritization - layering intent data into prospecting workflows so reps target accounts actively researching solutions rather than blasting cold lists. Reps who partner with AI effectively are 3.7x more likely to hit quota, and Gartner projects 40% of enterprise apps will include task-specific AI agents by end of 2026. (If you want to operationalize this, start with identifying buying signals and intent based segmentation.)
Here's my hot take: if your average deal is under $10K, you probably don't need a $30K intent data platform. But you absolutely need verified contact data and a sequencer that doesn't let reps quit after two touches. The economics are simple - a fully loaded SDR costs ~$139K/year, and reps spend only 28-30% of their time actually selling. AI won't replace your SDRs, but it should be freeing them from the 70% of their day spent on non-selling activities. If it isn't doing that yet, you've got a tool problem, not an AI problem.
Mistakes That Kill Pipeline
Single-channel outreach. Email-only or phone-only approaches leave conversion on the table. Buyers are multi-channel; your prospecting should be too.
No ICP definition. Spraying messages at a broad list wastes budget and burns your domain. Define your target before you write a single email.
Over-investing in top-of-funnel when MQL-to-SQL is below 10%. This is the most expensive mistake nobody talks about. Pouring more leads into a broken middle funnel just accelerates waste. Fix your conversion rates before you scale volume.
Stale data with no verification. Assume 15-20% of contact data decays annually without verification. Bad data is the silent pipeline killer - and the fastest way to sabotage your revenue efforts.
No follow-up persistence. 80% of sales need 5+ touches. If your sequences stop at three, you're quitting before the game starts.
Ignoring compliance. GDPR penalties run up to EUR 20M or 4% of global annual revenue. CAN-SPAM, CASL, and state-level privacy laws add more risk. This isn't optional.
FAQ
What's the difference between pipeline generation and lead generation?
Lead generation fills the top of the funnel with names and contact information. Pipeline generation is the full system that moves those names through MQL, SQL, and opportunity stages to closed revenue. You can have great lead gen and terrible pipeline gen if your middle-funnel process is broken.
How much pipeline coverage do I need?
Use the 3-4x coverage ratio. If your quarterly target is $1M and your win rate is 25%, you need $3-4M entering the quarter. Work backward through stage conversion rates to calculate the lead volume required - most teams underestimate this because they've never mapped full-funnel math.
What's a good pipeline conversion rate?
General B2B averages run Lead-to-MQL 22%, MQL-to-SQL 15%, SQL-to-Opportunity 11%, Opportunity-to-Closed 7%. B2B SaaS tends higher at the top (39% Lead-to-MQL) while IT services runs lower (19%). Calibrate to your own data within two quarters.