Outbound Sales Metrics: What to Track, What to Ignore, and What "Good" Actually Looks Like
A 10.7% reply rate sounds incredible until you realize it came from 800 hyper-personalized emails. A 1.6% reply rate sounds terrible until you learn it's running across 100K+ sends per month and generating more pipeline than the "elite" number.
Benchmarks without context are dangerous. They make good teams feel bad and bad teams feel safe. Here's what we've learned tracking outbound sales metrics across hundreds of campaigns: the numbers that matter aren't always the ones on your dashboard, and the ones on your dashboard aren't always real.
If You Only Track Three Things
- Conversations per day - the leading indicator that correlates most directly with pipeline
- Qualified meeting rate - not meetings booked, meetings that actually convert
- Cost per opportunity - the number your CFO cares about
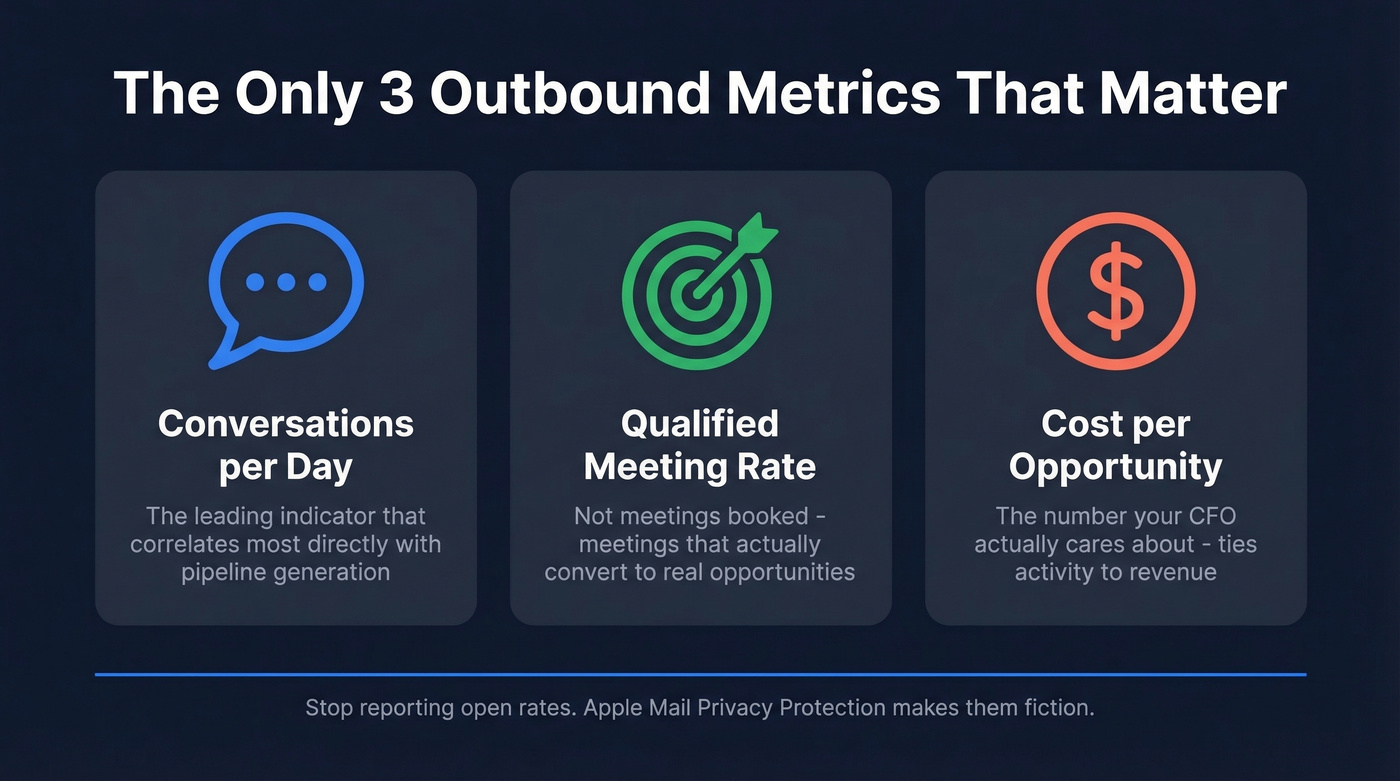
Stop reporting open rates. Apple Mail Privacy Protection preloads email content, which means your "45% open rate" is fiction. And if your bounce rate is above 5%, fix your data before optimizing anything else. Every downstream metric is compromised when you're sending to dead addresses. (If you need a baseline, start with email bounce rate benchmarks and fixes.)
Activity Metrics
Bridge Group's SDR Metrics & Trends survey of 351 B2B companies puts averages at 44 dials/day, 41 emails/day, and 4.1 quality conversations/day.
The number that matters most is attempts per prospect. The data shows an average of 10.6 attempts, with a sweet spot of 9-12. Most reps quit too early in the sequence. That's not persistence - it's waste. You've already paid for the lead; finish the sequence.
Engagement Metrics
Reply rate is the engagement metric that actually tells you something. Instantly's benchmark data - drawn from billions of emails across thousands of workspaces - pegs the average at 3.43%. Top quartile hits 5.5%+. Top 10% clears 10.7%.
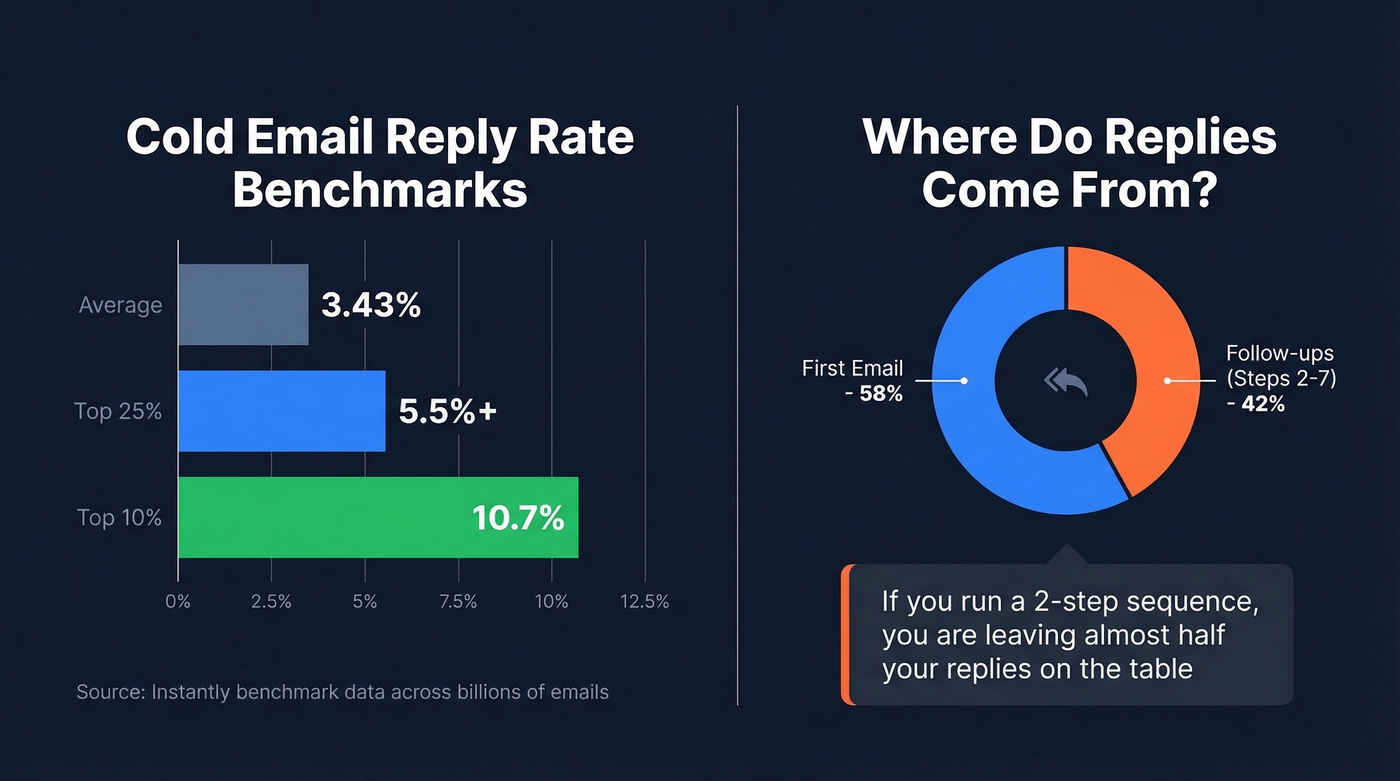
Here's the sequencing insight most teams miss: 58% of replies come from the first email, but 42% come from follow-ups in steps 2-7. If you're running a 2-step sequence, you're leaving almost half your replies on the table. Reply-style follow-ups outperform formal reminders by 30%, and emails under 80 words with a single CTA consistently beat longer pitches. (If you want examples, use these sales follow-up templates to test faster.)
Bounce rate should sit under 2%. Open rate? Dead metric.
Conversion Metrics
This is where vanity falls away. Track qualified meetings booked, lead-to-opportunity conversion rate, pipeline value created, outbound-sourced win rate, and outbound CAC. If you need a clean definition set, map these to your funnel metrics so teams stop arguing about terms.
Let's be honest: qualified meeting rate matters more than meetings booked. If you're only reporting the latter, you're misleading your board. When your VP asks why 40 meetings turned into 6 qualified opportunities, the answer isn't "reps need more dials." It's that targeting, messaging, or qualification criteria are broken. Track stage conversion rates to find the bottleneck - don't pour more volume into a leaky funnel.
Every conversion metric on your dashboard is downstream of data quality. If your bounce rate is above 2%, your reply rates, meeting rates, and cost-per-opportunity are all compromised. Prospeo's 5-step verification delivers 98% email accuracy - so every metric you track reflects real performance, not data noise.
Stop optimizing campaigns built on broken data.
Channel Benchmarks for 2026
No channel is dead. Bad messaging is. But single-channel outbound is a losing strategy. Period.
| Scenario | Primary Channel | Secondary Channel |
|---|---|---|
| TAM under 5K accounts | Social | Phone |
| TAM over 50K accounts | Phone | |
| ACV under $10K | Social | |
| ACV over $50K | Phone | Social |
A seller on r/b2b_sales ran a head-to-head test from the same list: social outreach pulled a ~27% response rate versus ~1% for cold email. That's one test, not gospel - but the consensus across r/sales and r/coldemail is clear: multichannel wins, and each channel needs its own strategy. "Spray everything" underperforms because it dilutes effort across channels without adapting the message to each one. (For a tighter playbook, borrow these sales prospecting techniques and adapt per channel.)
Here's a strong opinion: if your average deal size is under $10K and you're running a phone-heavy motion, you're probably burning money. The math doesn't work. Your cost-per-conversation is too high relative to deal size. Lead with email, use phone as a sequence accelerator, and save the heavy dialing for enterprise deals where the payoff justifies the labor.
Why Your Metrics Look Bad (and the Audit Order That Fixes Them)
Before you rewrite a single email, audit in this order: data quality -> deliverability -> targeting -> messaging -> channel mix.
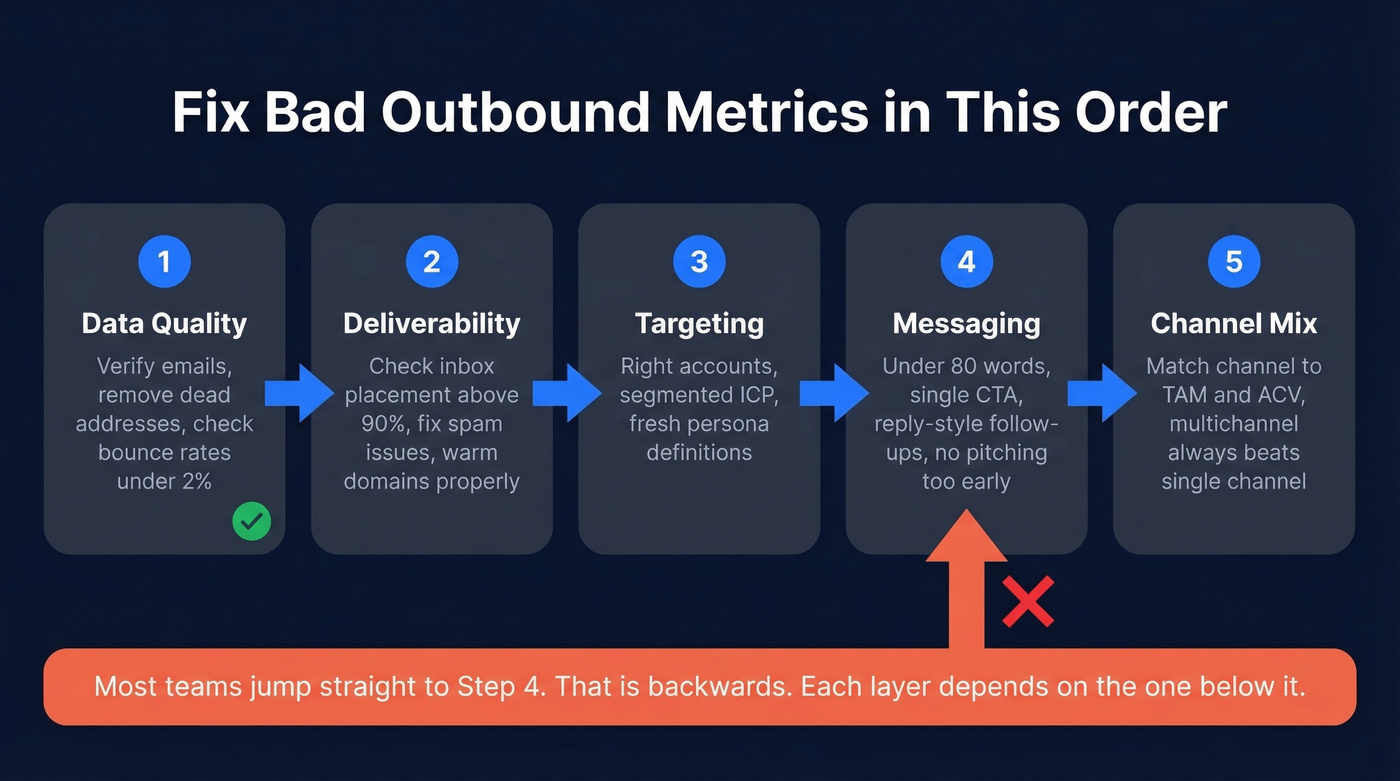
Most teams jump straight to messaging. That's backwards. Each layer depends on the one below it, and Litmus found that 70% of emails show at least one spam-related issue. If your inbox placement drops below 90%, you've got a deliverability problem, not a copywriting problem. (Start with a real email deliverability guide before you touch copy.)
The common mistakes we see over and over fall into three buckets:
Targeting failures - wrong accounts, no segmentation within ICP, stale ICP definitions, ignoring personas entirely. Execution failures - generic messaging, pitching too early in the sequence, relying on one channel. Data failures - bad contact data, unverified lists, no bounce monitoring. If your ICP is fuzzy, use an ideal customer profile template to force clarity.
That last bucket is the silent killer. Teams blame messaging or targeting when the real problem is that a chunk of their list doesn't exist. Without reliable outbound analytics, you can't distinguish a messaging failure from a data failure - and most teams never bother to separate the two. We watched one agency spend three months A/B testing subject lines before discovering their bounce rate was 28%. Three months of "optimization" wasted on emails that never arrived.
Prospeo's 5-step verification catches invalid emails, spam traps, and catch-all domains before they hit your sequences. Meritt switched and saw bounce rates drop from 35% to under 4%, and their pipeline tripled from $100K to $300K per week.
You just read that most teams audit messaging first when metrics look bad. The real fix starts with data quality. Prospeo refreshes 300M+ profiles every 7 days - not every 6 weeks - so your sequences hit real inboxes. Meritt made the switch: bounce rates dropped from 35% to under 4%, pipeline tripled to $300K/week.
Audit your data layer first - start at $0.01 per verified email.
How to Calculate Outbound ROI
Outbound ROI is often underreported because revenue impact lags activity by 3-9 months. Here's how to frame it so leadership doesn't kill the program before it matures.
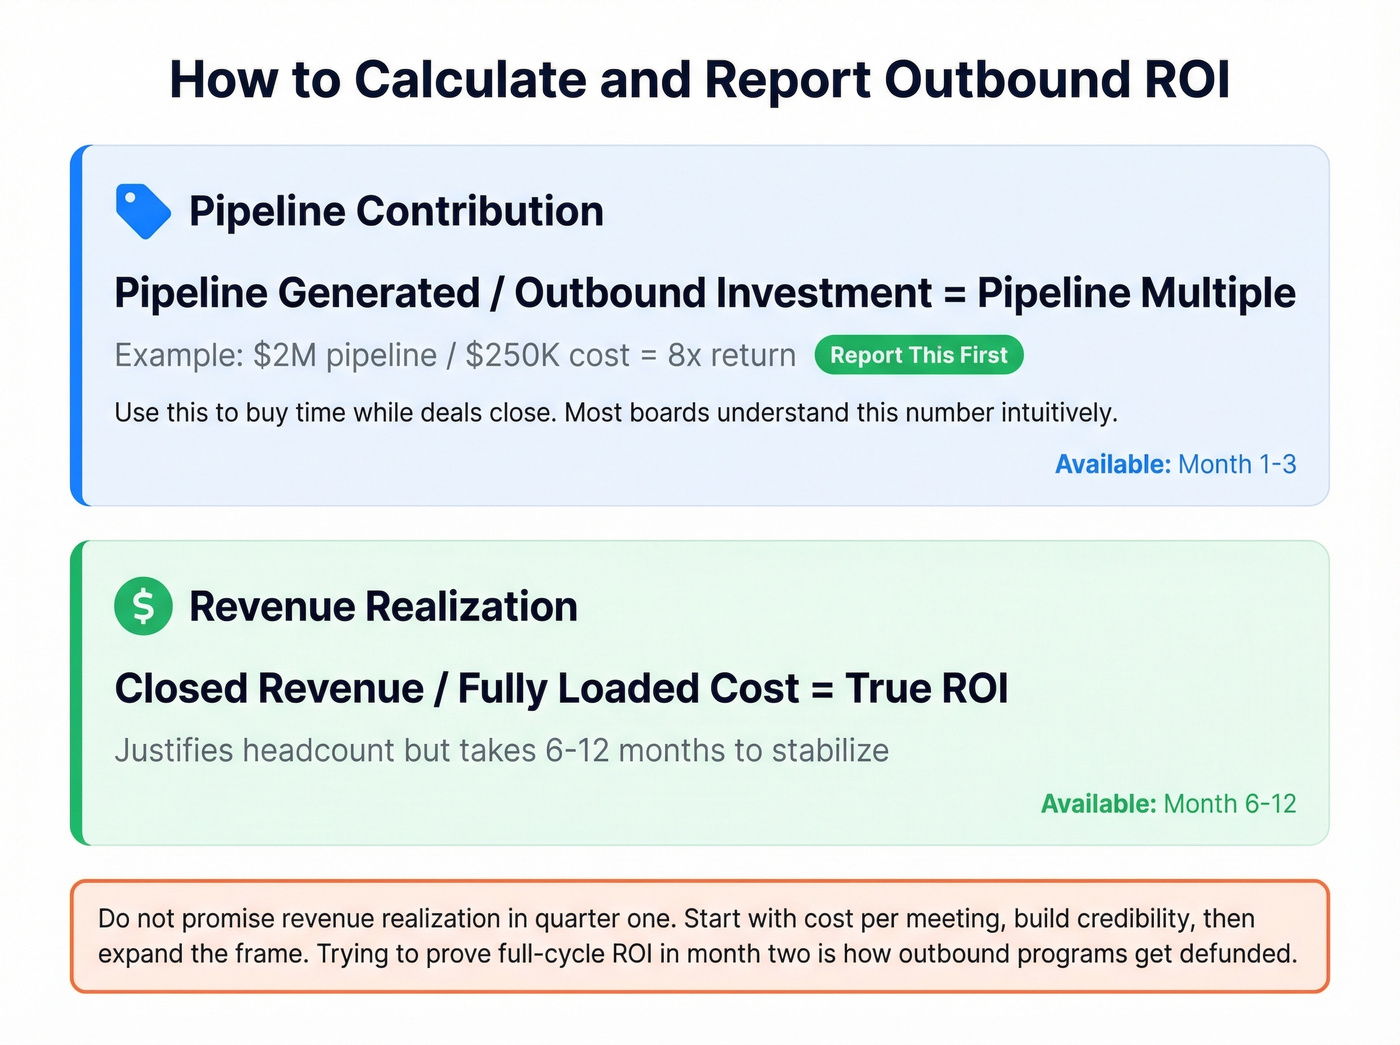
Pipeline Contribution = Pipeline Generated / Outbound Investment. If your outbound team generates $2M in pipeline on a $250K fully loaded cost, that's 8x. Most boards understand that number intuitively, and it buys you time while deals close.
Revenue Realization = Closed Revenue / Fully Loaded Cost. This justifies headcount - but it takes 6-12 months to stabilize. Don't promise revenue realization in quarter one. Start with cost-per-meeting, build credibility, then expand the frame. Trying to prove full-cycle ROI in month two is how outbound programs get defunded prematurely. (If leadership wants a single number, align on cost to acquire customer vs. cost-per-opportunity.)
SDR Operational Benchmarks
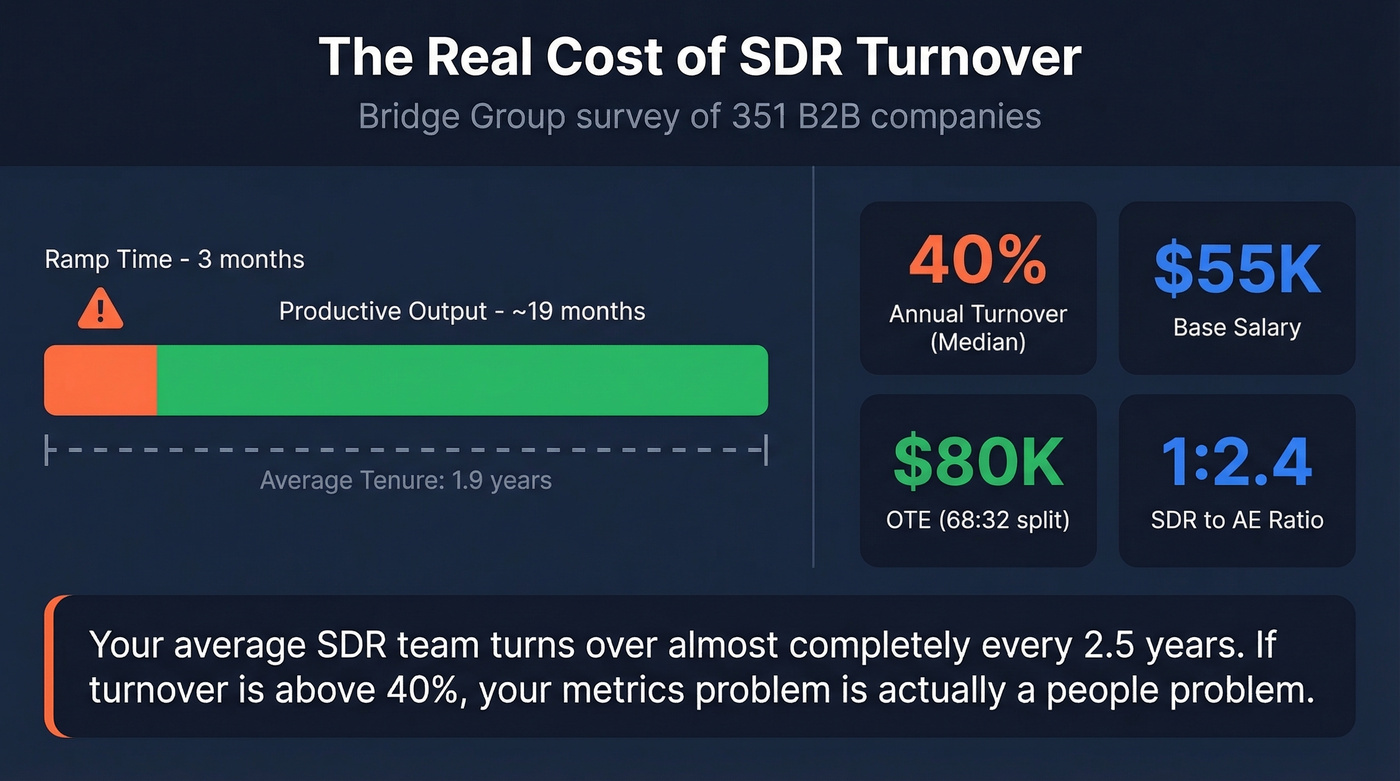
These come from Bridge Group's survey of 351 B2B companies (83% SaaS, $47M median revenue):
| Metric | Benchmark |
|---|---|
| SDR:AE ratio | 1 : 2.4 |
| Ramp time | 3.0 months |
| Average tenure | 1.9 years |
| Annual turnover | 40% (median) |
| Base salary | $55K |
| OTE | $80K (68:32 split) |
| Manager span | 1 : 6.4 |
That 40% turnover number is brutal. Your average SDR team turns over almost completely every 2.5 years. Ramp time of 3 months on a 1.9-year tenure means roughly 19 months of productive output per hire. If your turnover is above 40%, your metrics problem is actually a people problem - and no amount of sequence optimization fixes that. Factor retention into your cost-per-opportunity math before blaming the playbook. (If comp is part of the churn, sanity-check your OTE in Sales assumptions.)
Skip this section if your team's been stable for 12+ months. But if you're churning reps every year, this is probably where your real cost leak lives.
Where Outbound Reporting Is Heading
AI sales assistants are becoming non-negotiable for note-taking and follow-up. Contact-level website tracking is replacing expensive third-party intent data. And data hygiene tools are becoming standard pre-send infrastructure as teams outsource deliverability ops. Gartner's latest research shows 33% of high-growth companies now set targets based on opportunity potential rather than existing revenue, which changes how you measure territory performance entirely.
The shift toward unified platforms that connect activity, engagement, and revenue data in a single view means teams can finally tie dials and sends to closed revenue without stitching together five dashboards. Expect outbound sales KPIs to evolve alongside these tools - leading indicators like intent-signal response time and sequence-level ROI will supplement traditional activity counts.
FAQ
What's a good cold email reply rate in 2026?
Average is 3.43% based on Instantly's benchmark data. Top quartile hits 5.5%+, and top 10% clears 10.7%. Build your own baseline after 90 days of consistent sending before comparing to industry averages - your ICP, deal size, and market all shift the curve.
How many touches should an SDR make per prospect?
Bridge Group data shows 10.6 attempts on average, with 9-12 being the sweet spot across email, phone, and social. Most reps quit after 3-4 touches, leaving nearly half of potential replies unrealized.
Why is open rate no longer a reliable metric?
Apple Mail Privacy Protection preloads email content automatically, inflating open rates regardless of whether anyone read your message. Reply rate, click-through rate, and bounce rate are the engagement signals worth tracking.
How does bad contact data affect outbound performance?
Bounce rates above 5% destroy sender reputation, inflate CAC, and make every downstream metric unreliable. Prospeo's email verification catches invalid addresses, spam traps, and catch-all domains before sends - Meritt cut bounces from 35% to under 4% and tripled pipeline as a result.