Revenue Churn: What It Is, Benchmarks & How to Fix It
Your VP of Finance just asked why net revenue is flat when the sales team hit quota last quarter. The answer is almost always revenue churn - and nobody's measuring it correctly.
What Is Revenue Churn?
Revenue churn is the [percentage of MRR or ARR] you lose each period from cancellations, downgrades, and non-renewals. It's the financial bleed from your existing customer base, completely separate from whether you're adding new logos on top.
Why does it matter so much? Bain & Company's research found that a 5% improvement in retention can increase profits by 25-95%. That single stat should reframe how your entire leadership team thinks about growth. This metric determines whether your revenue compounds or just treads water.
Customer Churn vs Revenue Churn
These two metrics tell radically different stories about the same business. Optimizing for the wrong one leads to misallocated resources, and we've seen teams make this mistake repeatedly.
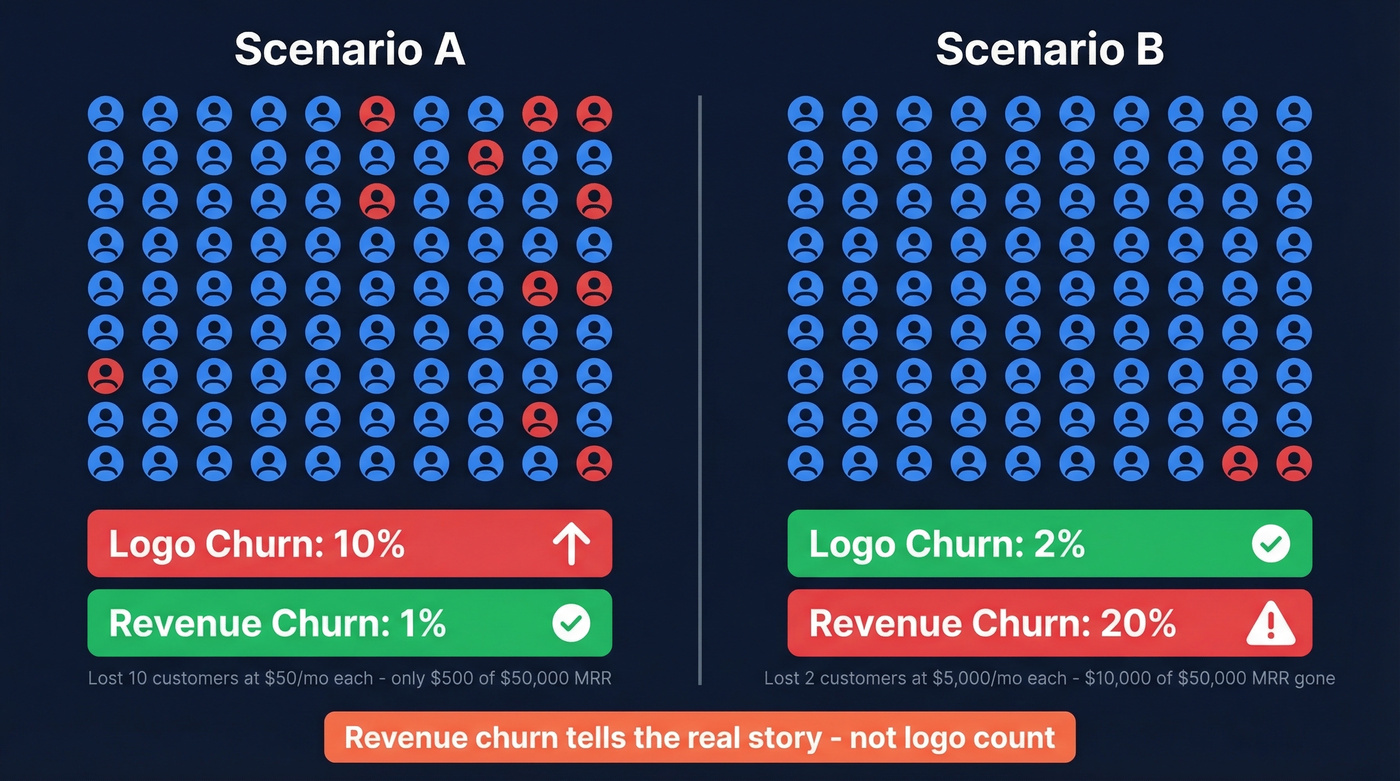
Scenario A: You lose 10 of 100 customers - 10% logo churn. But they're all $50/mo accounts. Revenue lost: $500 out of $50,000, just 1% MRR loss. Your biggest customers are happy.
Scenario B: You lose 2 of 100 customers - 2% logo churn. But they're your two largest accounts at $5,000/mo each. Revenue lost: $10,000 out of $50,000, a brutal 20% MRR loss. Two customers. Twenty percent of your revenue. Gone.
Revenue churn matters more than customer churn for every business decision except one: product-market fit diagnosis. If you're trying to understand whether your product resonates broadly, logo churn tells you how many people reject it. For everything else - forecasting, valuation, growth planning, board reporting - the revenue-side metric is what counts.
How to Calculate Revenue Churn
Two formulas matter. Don't skip the second one.
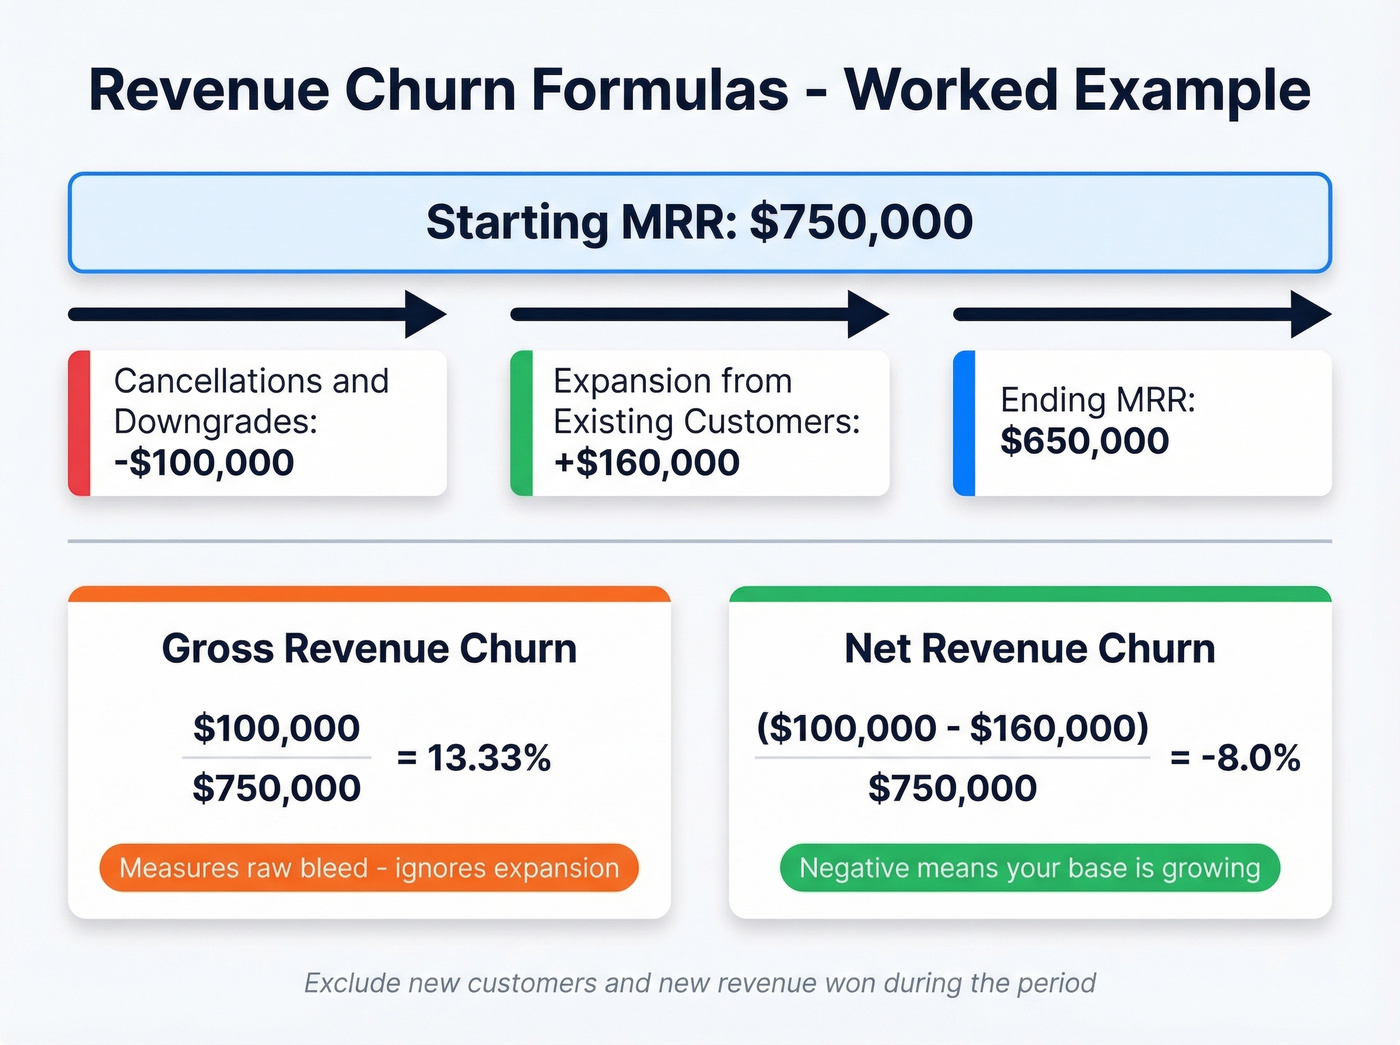
Gross revenue churn rate = (MRR lost to cancellations + downgrades) / Starting MRR
Net revenue churn rate = (MRR lost - expansion MRR) / Starting MRR
Here's a worked example from Paddle: start the month at $750k MRR, end at $650k, with $160k in upgrades from existing customers. Gross churn is 13.33%. Net churn is -8%, meaning your existing base actually grew despite the cancellations. The key rule: exclude new customers and new revenue won during the period. You're measuring the health of your existing base, not your sales team's output.
If you want the full breakdown of churn math (including edge cases like mid-cycle upgrades), see our guide on how to calculate churn.
ChurnZero's taxonomy is the cleanest framework for categorizing renewals:
| Type | Definition |
|---|---|
| Churned | Non-renewals |
| Contracting | Downgrades and discounts |
| Renewed | Flat renewals |
| Expansion | Upsells and price increases |
Every dollar of recurring revenue should land in one of those buckets. No exceptions.
Negative net revenue churn is the gold standard, and it's more common than you'd think. ChartMogul found that 40% of businesses in the $15-30M ARR range achieve it. If you're not there yet, that's your north star.
If you’re reporting this metric in a board pack, it helps to pair it with an ARR waterfall so leaders can see exactly where contraction and expansion came from.
Negative net revenue churn starts with reaching the right buyers. Prospeo's 300M+ profiles with 98% verified email accuracy help you land expansion conversations with decision-makers - not bounce into spam folders. At $0.01/email, the cost of protecting your existing revenue is negligible.
Stop losing revenue to contacts that never connect.
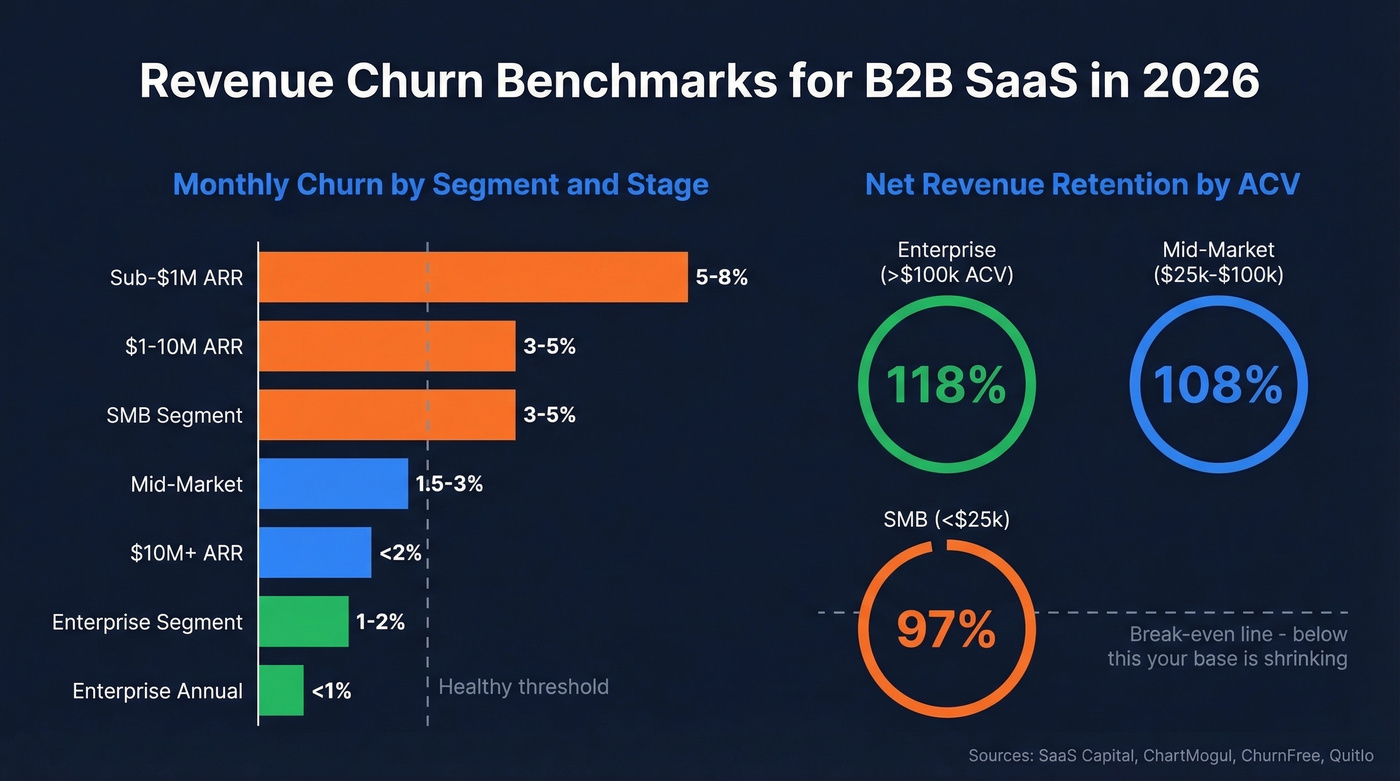
Revenue Churn Benchmarks
Every guide says "lower is better." Nobody tells you what "good" actually looks like for your segment and stage. We pulled data from multiple sources to fix that.
Monthly Rates by Segment
| Segment | Monthly Churn |
|---|---|
| SMB | 3-5% |
| Mid-market | 1.5-3% |
| Enterprise | 1-2% |
Based on ChurnFree's analysis of 900+ B2B SaaS companies.
Monthly Rates by ARR Stage
| ARR Stage | Monthly Churn |
|---|---|
| Sub-$1M | 5-8% |
| $1-10M | 3-5% |
| $10M+ | <2% |
| Enterprise (annual) | <1% |
Based on Quitlo's analysis of 400+ PLG startups.
Net Revenue Retention by ACV
| ACV Band | Median NRR |
|---|---|
| Enterprise (>$100k) | 118% |
| Mid-market ($25k-$100k) | 108% |
| SMB (<$25k) | 97% |
For the $25k-$50k ACV band, SaaS Capital's annual survey pegs median NRR at 102% and top quartile at 111%. Across all venture-backed SaaS, ChartMogul's study of 2,100 companies puts the median at 106%.
If you need a clean definition of ACV (and how it changes benchmark interpretation), start with ACV.
Best-in-class companies run NRR above 130%. Good is 100-120%. Below 100% means your existing base is shrinking every period. But 100% NRR can mask high churn if expansion offsets losses - track GRR separately. If GRR drops below 85%, your expansion revenue is papering over a retention problem that will catch up with you.
To go deeper on NRR math and common reporting pitfalls, see how to calculate net revenue retention.
Here's the thing: high churn isn't always a crisis. A founder on r/SaaS reported 15% churn with SMB customers, $50 CAC, $400 LTV, and 25% month-over-month growth - and they're profitable. If your unit economics work and your acquisition engine is efficient, the math can still pencil out. Benchmarks are context, not commandments.
If you’re sanity-checking churn against acquisition efficiency, compare it to your LTV CAC ratio and CAC payback assumptions.
Common Measurement Mistakes
A single blended churn number is almost useless. If you're reporting one metric to your board, you're hiding more than you're revealing.
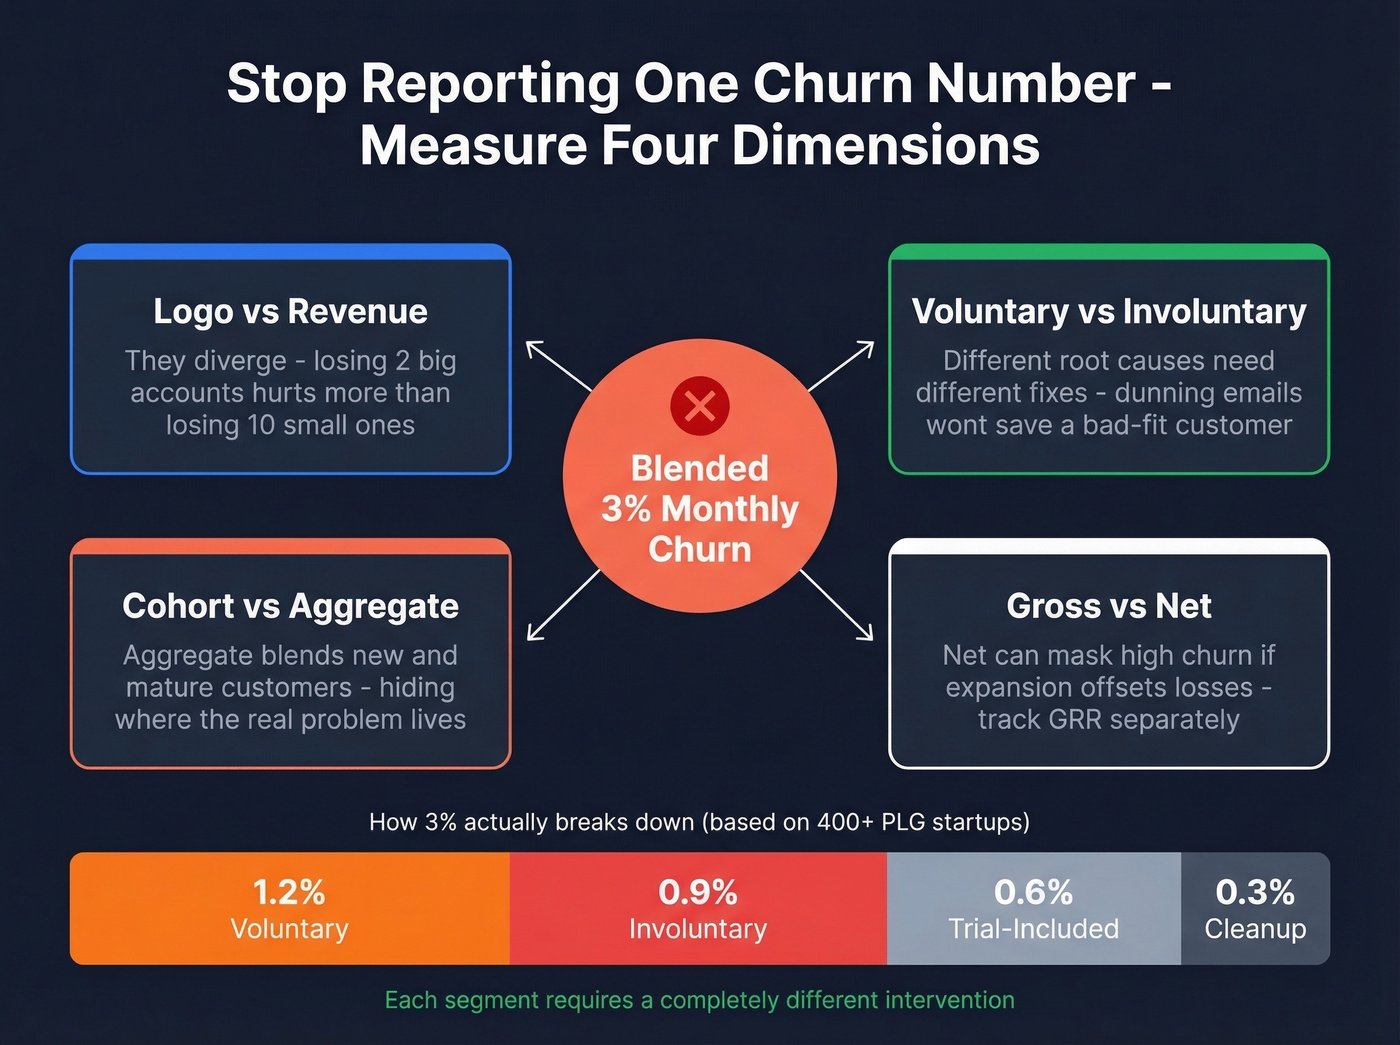
The teams that actually reduce churn measure across four dimensions: logo vs. revenue (they diverge), voluntary vs. involuntary (completely different problems), cohort vs. aggregate (aggregate blends new and mature customers), and gross vs. net (raw bleed vs. expansion-adjusted). Skip any one of these and you're flying partially blind.
If you’re seeing a big involuntary component, it’s worth separating it explicitly as involuntary churn rather than burying it in a blended number.
Let's break down how misleading blended numbers get. Quitlo decomposed a "3% monthly churn" figure from 400+ PLG startups and found it broke into 1.2% voluntary, 0.9% involuntary, 0.6% trial-included (people who never really converted), and 0.3% already-gone cleanup. Each requires a completely different intervention - a dunning email won't fix a bad-fit customer, and a discount won't fix an expired credit card. Treating them as one number means you're solving the wrong problem.
How to Reduce Revenue Churn
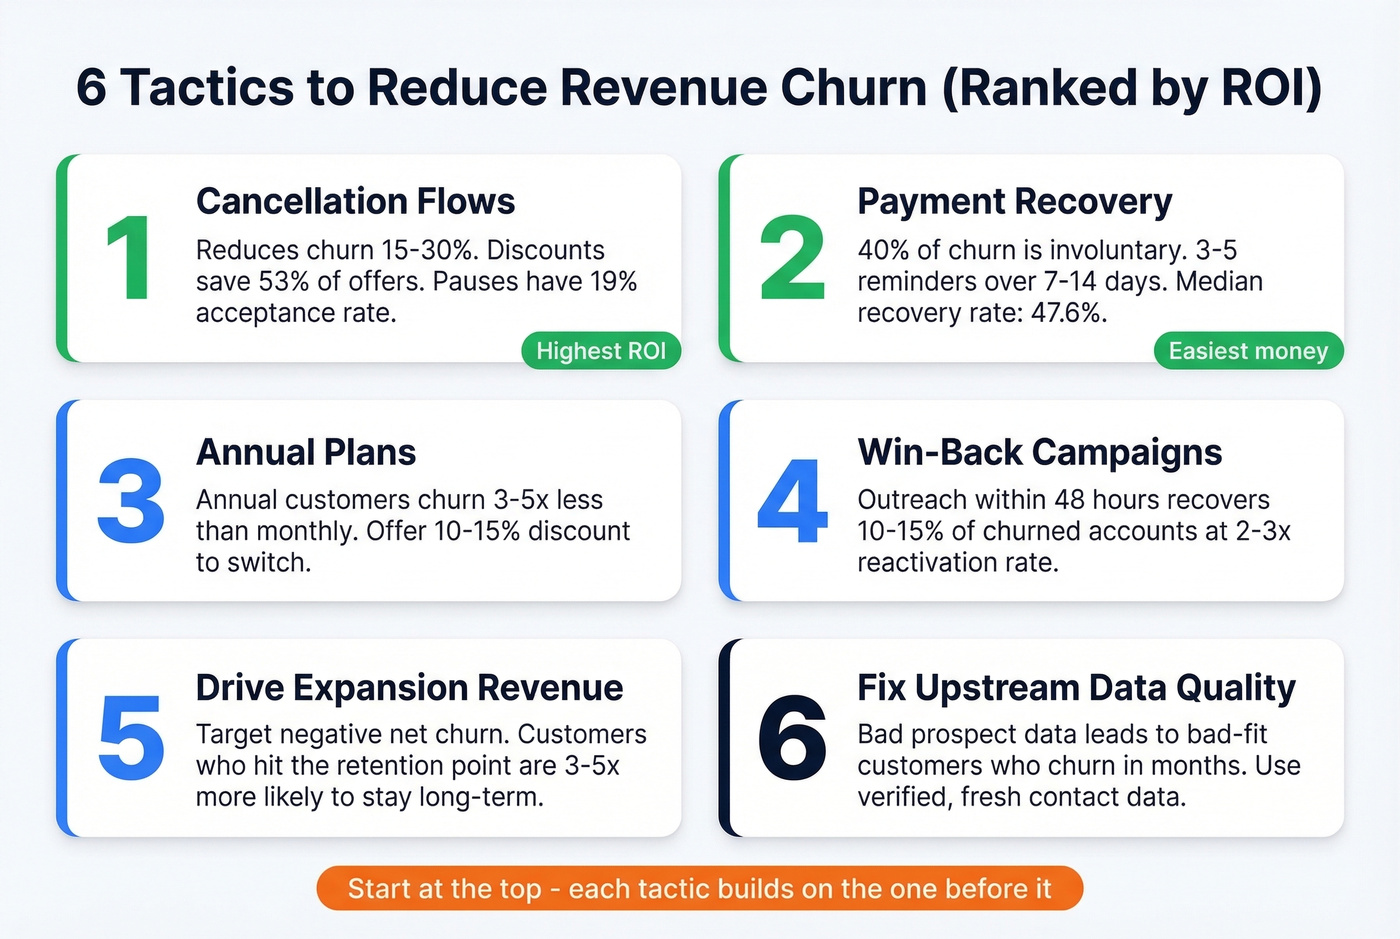
Six tactics, ordered by typical ROI. Start at the top and work down.
Cancellation Flows
Smart cancellation flows reduce churn by 15-30%. Churnkey's dataset across 3M cancellation sessions shows discounts account for 53% of all accepted save offers, and pauses carry a 19% acceptance rate. Budget limitations drive 33% of voluntary cancellations - a third of your voluntary churn is solvable with a temporary discount or pause rather than a permanent goodbye. If you don't have a cancellation flow with at least three save offers, build one this week.
Payment Recovery
Involuntary churn - failed payments, expired cards, billing errors - accounts for roughly 40% of total churn. That's revenue walking out the door with zero customer intent to leave.
Best practice is 3-5 reminders over 7-14 days across email, SMS, and in-app. The median recovery rate sits at 47.6%. Recurly estimated $129B was at risk from involuntary churn in 2025 alone. If you haven't optimized your dunning sequences, this is the easiest money on the table.
Annual Plans and Win-Backs
Annual customers churn 3-5x less than monthly customers. If you're not actively incentivizing annual plans - even a modest 10-15% discount - start today.
For customers who do leave, targeted win-back campaigns within 48 hours of cancellation recover 10-15% of churned accounts at 2-3x the reactivation rate of delayed outreach. We've seen teams automate same-day outreach and consistently outperform those that treat win-backs as an afterthought.
If you’re building a formal renewal motion (owners, timing, and KPIs), use a dedicated renewal rate framework so churn reduction doesn’t rely on heroics.
Drive Expansion Revenue
The ultimate goal is negative net revenue churn through expansion. When existing customers expand faster than others leave, your base grows organically. Customers who hit a "retention point" - typically the moment they integrate your product into a core workflow - are 3-5x more likely to become long-term users. Your CS team should know exactly what that milestone is and drive every account toward it.
If expansion is your lever, map it explicitly as expansion revenue so you can separate “saved” revenue from “grown” revenue.
Fix Upstream Data Quality
Look, churn starts before the customer signs up. When outbound teams prospect with stale contact data, they acquire customers who were never a good fit - and those customers churn within months. This is the silent churn driver nobody talks about because it sits in a different department's budget.
Prospeo's 98% email accuracy and 7-day data refresh cycle helps outbound teams reach the right people at the right companies, reducing bad-fit signups that inflate churn downstream. Fresher data means better targeting, which means customers who actually stick around.
If you want a QA checklist for keeping contact records fresh, see BDR contact data.
Your NRR depends on reaching existing accounts with upsell and renewal conversations. Prospeo refreshes every record on a 7-day cycle - so your CRM never holds stale contacts for churning accounts. Layer intent data across 15,000 topics to spot at-risk customers before they cancel.
Catch churn signals before they hit your MRR.
FAQ
What's a good revenue churn rate?
For SMB SaaS, 3-5% monthly is typical; mid-market lands at 1.5-3%, and enterprise teams should target under 2%. Whether your rate is actually a problem depends on unit economics - if CAC payback is fast and LTV stays healthy, higher churn can still support profitable growth.
What's negative net revenue churn?
It means expansion revenue from existing customers exceeds revenue lost to cancellations and downgrades, so your installed base grows without adding new logos. About 40% of businesses in the $15-30M ARR range achieve it, typically through usage-based pricing or seat expansion.
How is revenue churn different from NRR?
They're inverse lenses on the same data. A 5% net revenue churn rate equals 95% NRR. Investors prefer NRR because higher numbers look better in pitch decks; operators prefer churn rate for diagnosing problems. Track both.
Can bad prospect data cause higher churn?
Absolutely. Stale or inaccurate contact data leads to outreach that lands with bad-fit buyers who churn within months. Tools like Prospeo verify emails at 98% accuracy on a 7-day refresh cycle, while many competitors refresh every 4-6 weeks - fresher data means better-fit customers from the start.