Revenue Reporting: The 2026 Guide to Metrics, Dashboards, and Automation
It's 8 PM the night before a board meeting. You've got revenue numbers from Salesforce, a different set from your billing system, and a third from the GL. None of them match. The CFO is asking which one's right, and you're not sure any of them are.
This isn't a tooling problem - it's a data problem. Forrester's Revenue Operations Survey found 46% of revenue ops processes are mostly manual and 49% of leaders say their processes can't flex to changing conditions. Meanwhile, companies with a formal RevOps function report 36% higher revenue growth and up to 28% more profitability. The gap between teams that nail revenue reporting and those that fumble it is widening fast.
Here's the short version: revenue reporting is a data quality problem first, a dashboarding problem second. Fix your CRM before you build reports. Track five core metrics - MRR components, net revenue retention, gross margin, CAC payback, and churn. Benchmark them by stage. Automate reconciliation before anything else.
What Is Revenue Reporting?
Revenue reporting is the structured process of tracking, reconciling, and presenting the money your business earns. It pulls from three financial statements: the P&L (revenue's home as the top line), the balance sheet with its deferred revenue and contract assets, and the cash flow statement showing actual cash collected versus recognized revenue.
The distinction between gross and net revenue matters more than most teams realize. Gross revenue is total sales before returns, discounts, and allowances. Net revenue strips those out, and it's what income statements typically report. You also need to separate operating revenue - money from your core business - from non-operating revenue like interest income, asset sales, and one-time gains.
Then there's accrual versus cash basis. Cash basis records revenue when money hits the bank. Accrual basis records it when earned, regardless of when cash arrives. For a SaaS business with annual contracts, the difference can be enormous, and getting it wrong distorts every downstream metric from deferred revenue balances to forecasting accuracy.
Why Most Revenue Reports Fail
The #1 reason reports fail isn't bad dashboards or wrong formulas. It's bad data. Forrester puts data accuracy and quality as a top challenge for 38% of data users. Leapfin's State of Automation report, based on nearly 200 finance professionals, found 73% of businesses are growing faster than finance can keep up - up from 48% the prior year. And 23% cite data quality as the biggest blocker to using automation more effectively.
We see the same pattern over and over: a team spends weeks building a beautiful dashboard, then discovers the underlying CRM has 40% duplicate records and contacts with job titles from two years ago. The dashboard looks great. The numbers are fiction.
Reddit's r/FPandA community echoes this constantly. The CRM data and revenue forecasting thread is basically a support group for finance teams who can't trust their pipeline data. Industry estimates put contact data decay at 30-40% per year. If you're not actively enriching and deduplicating, your revenue attribution drifts further from reality every quarter.
Let's be honest: most teams don't need more reports. They need to fix the three they have. Before you build a single new dashboard, run an enrichment pass on your CRM. Tools like Prospeo return 50+ data points per contact on a 7-day refresh cycle with a 92% API match rate - so your pipeline reflects reality, not six-month-old job titles. (If you're comparing vendors, start with this list of data enrichment services.)

5 Mistakes That Cost You Board Credibility
These are the errors that make CFOs lose sleep - and none of them involve chart formatting.
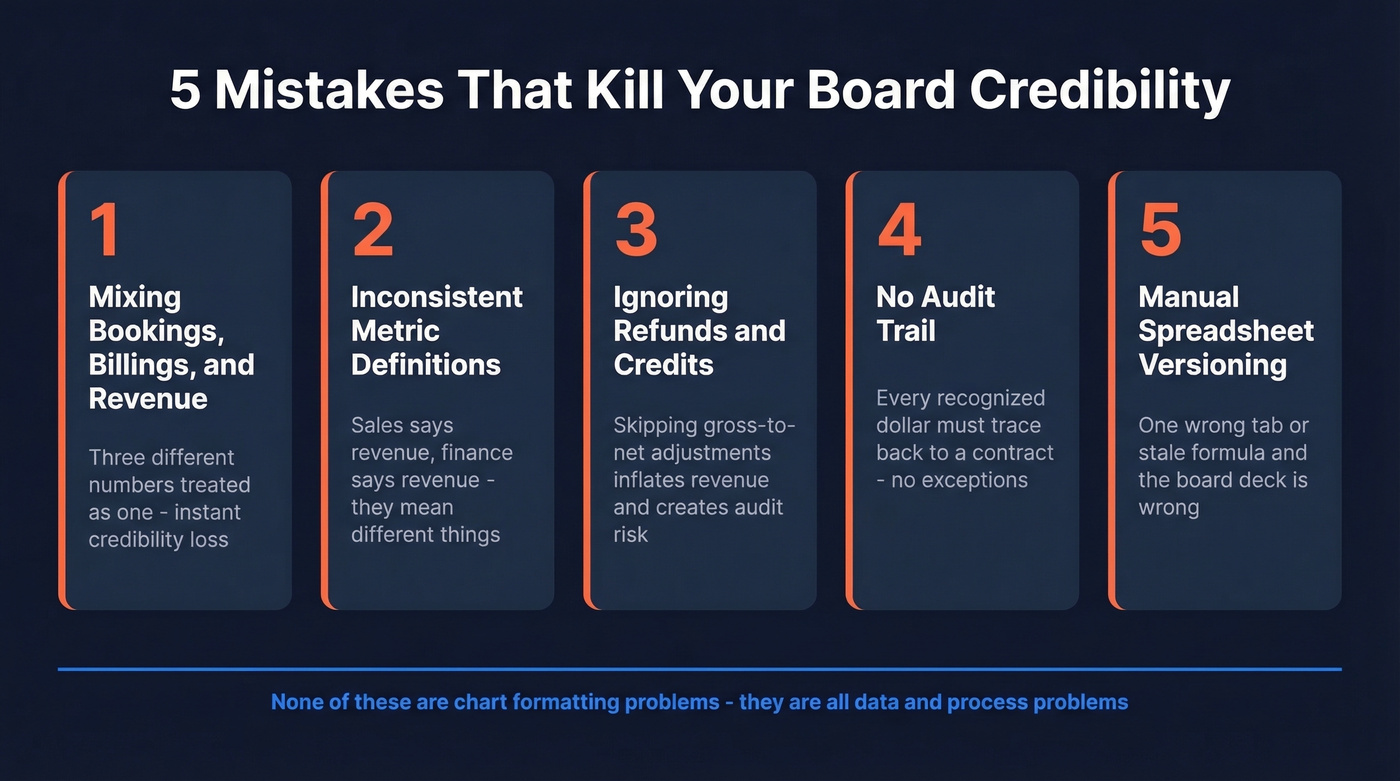
- Mixing bookings, billings, and revenue. These are three different numbers. Bookings are signed contracts. Billings are invoices sent. Revenue is what's been earned and recognized. Conflating them is the fastest way to lose credibility with investors.
- Inconsistent metric definitions. If sales calls bookings "revenue" and finance calls recognized revenue "revenue," your reports will never reconcile. Build a data dictionary and enforce it.
- Ignoring refunds and credits. Gross-to-net adjustments aren't optional. Skipping them inflates revenue and creates audit risk.
- No audit trail from contract to recognized dollar. Every recognized dollar should trace back to a specific contract and performance obligation. If it can't, you're one audit away from a restatement.
- Manual spreadsheet versioning. The moment your revenue close depends on emailing Excel files, you've introduced version control risk. One wrong tab, one stale formula, and the board deck is wrong.
Core Revenue Metrics
Financial Fundamentals
| Metric | Formula |
|---|---|
| Gross Revenue | Total sales before deductions |
| Net Revenue | Gross - returns - discounts - allowances |
| COGS | Direct costs of delivering product/service |
| Gross Margin | (Net Revenue - COGS) / Net Revenue |
| Operating Revenue | Revenue from core business |
| Non-Operating Revenue | Interest, asset sales, other gains |
Gross margin separates healthy SaaS businesses from those burning cash to grow. Target 70-80%+ for software. Below 60%, scaling gets much harder because every dollar of growth carries too much delivery cost.
SaaS Revenue Metrics
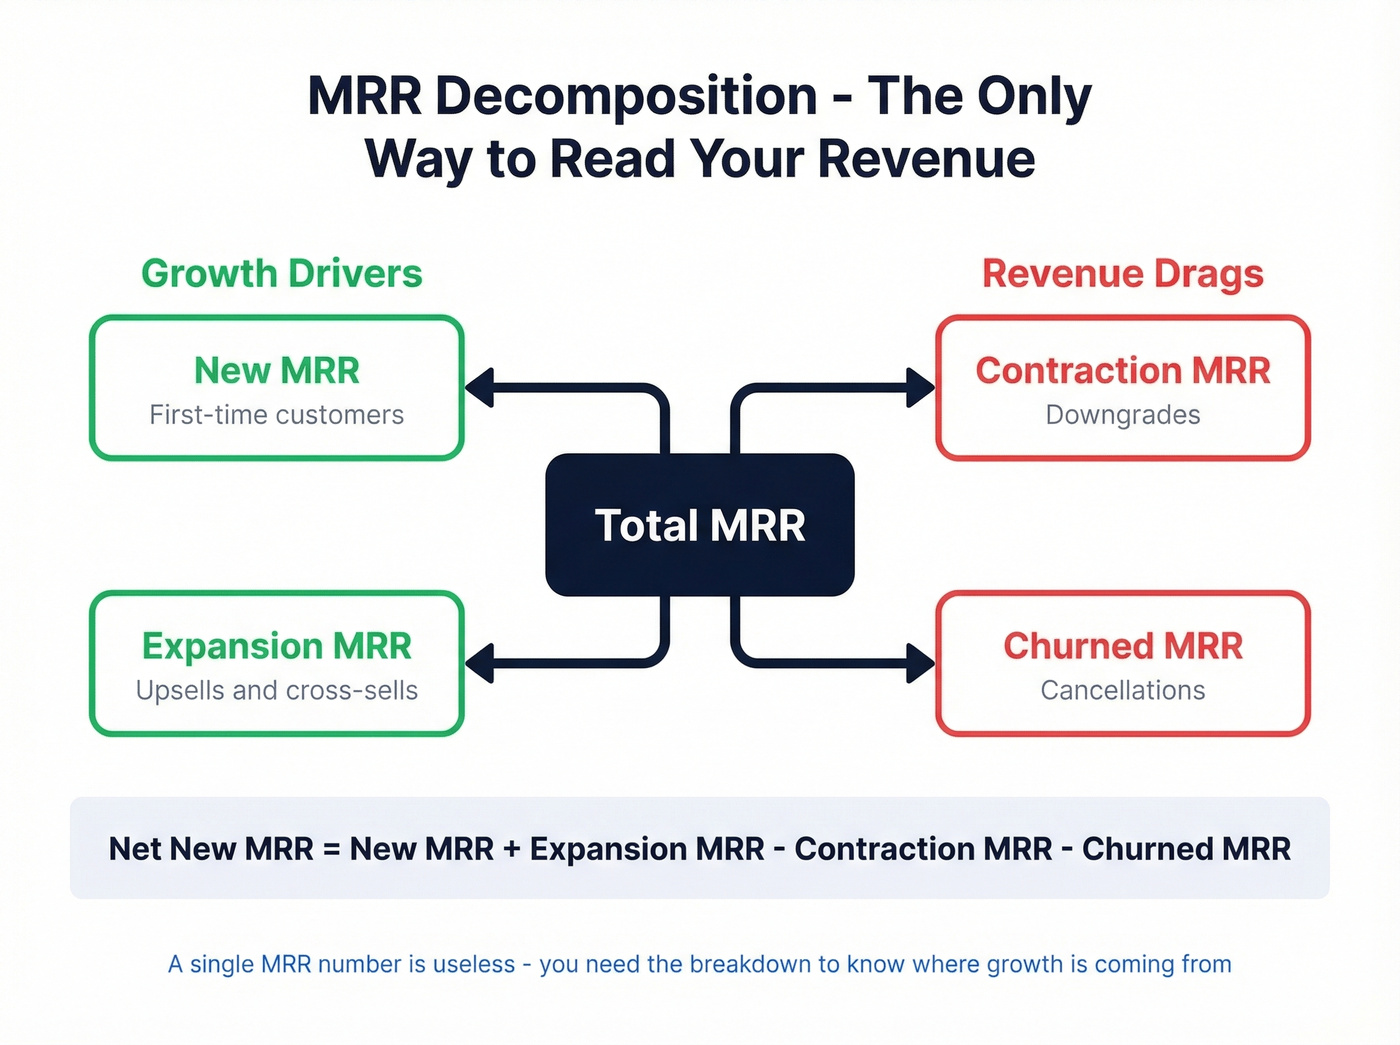
MRR is the heartbeat of any subscription business, but a single MRR number is useless. You need to decompose it: New MRR from first-time customers, Expansion MRR from upsells and cross-sells, Contraction MRR from downgrades, and Churned MRR from cancellations. Without this breakdown, you can't tell whether growth is coming from new logos or existing accounts - and that distinction drives completely different strategic decisions. (For a deeper breakdown, see our guide to funnel metrics.)
ARR is MRR x 12. Net Revenue Retention tells you whether your existing customer base is growing or shrinking without any new sales: NRR = (Starting Revenue + Expansions - Cancellations) / Starting Revenue x 100. An NRR above 100% means your existing customers are worth more each year - the strongest signal of product-market fit in SaaS.
Distinguish customer churn from revenue churn. A company can have low customer churn but high revenue churn if it's losing its biggest accounts. Early-stage SaaS companies typically see 5-10% monthly churn; mature companies target 2-5%. (If you want the formulas and benchmarks, start with what is churn and then go deeper with churn analysis.)
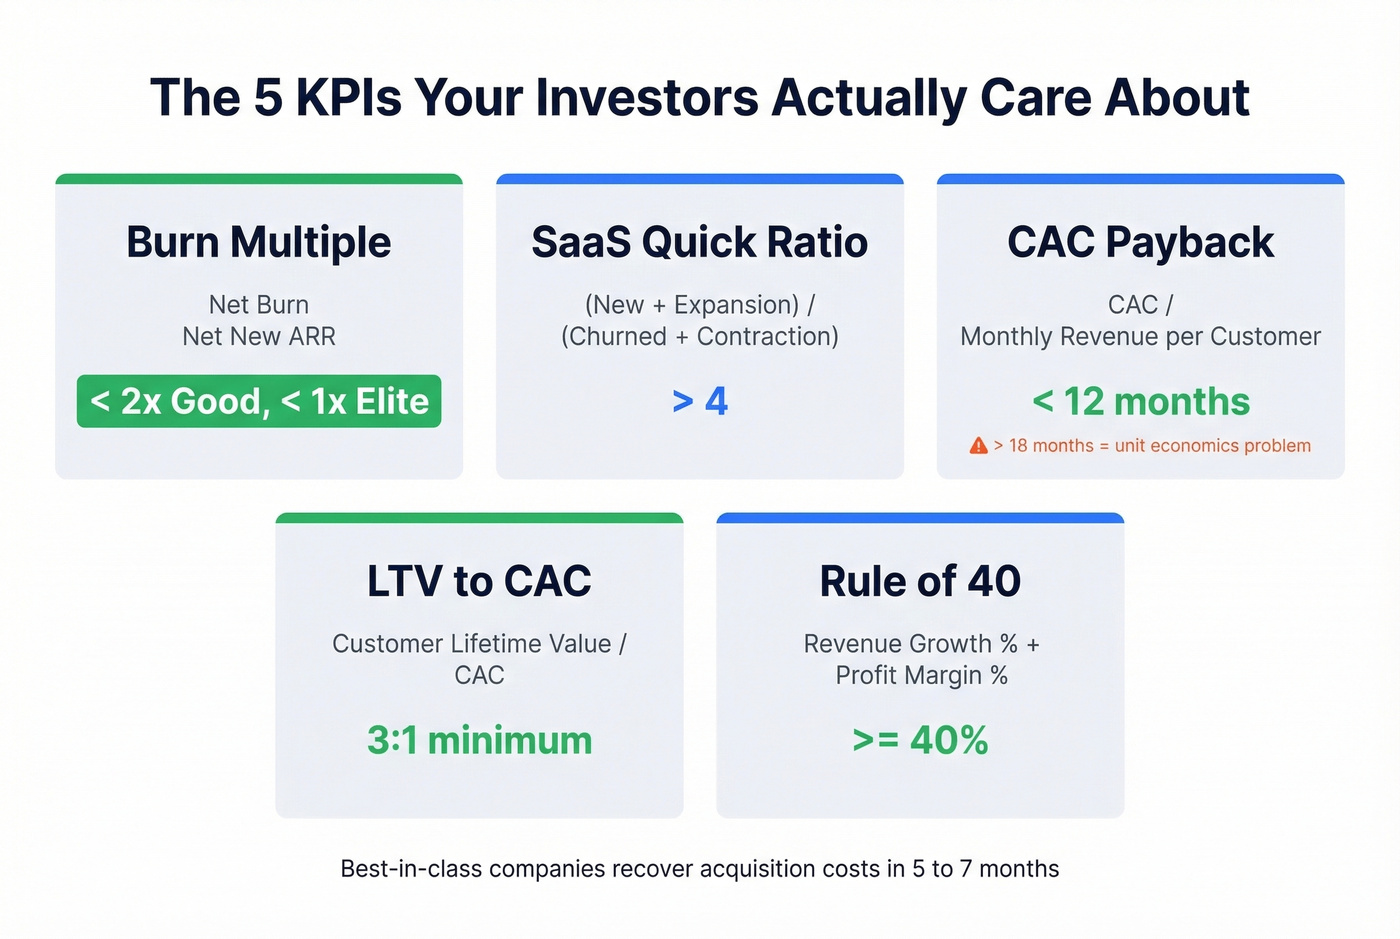
Advanced KPIs for Investors
These are the metrics investors and board members care about once you're past seed stage:
| Metric | Formula | Target |
|---|---|---|
| Burn Multiple | Net Burn / Net New ARR | < 2x good, < 1x elite |
| Quick Ratio | (New + Expansion MRR) / (Churned + Contraction MRR) | > 4 |
| CAC Payback | CAC / Monthly Revenue per Customer | < 12 months; best 5-7 |
| LTV:CAC | Customer Lifetime Value / CAC | 3:1+ |
| Rule of 40 | Revenue Growth % + Profit Margin % | >= 40% |
CAC payback under 12 months is the minimum bar. Best-in-class companies recover acquisition costs in 5-7 months. Above 18 months, you've got a unit economics problem that no amount of growth will fix.
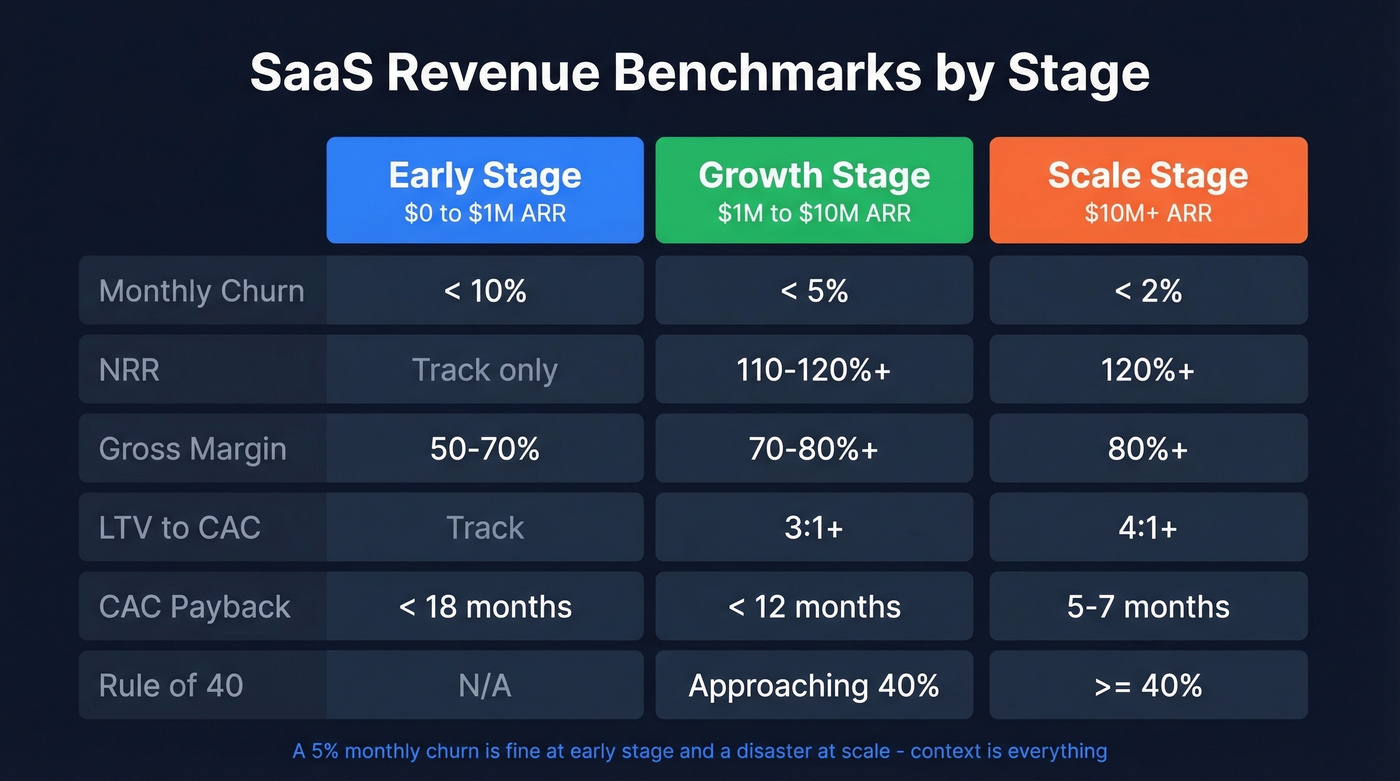
Benchmarks by Stage
Metrics without context are meaningless. A 5% monthly churn rate is fine for a pre-seed startup and a disaster for a $20M ARR company. Here's what "good" looks like at each stage, drawing from Cathcap's CFO guide to SaaS KPIs. This is the table your CFO will bookmark.
| Metric | Early ($0-$1M ARR) | Growth ($1M-$10M ARR) | Scale ($10M+ ARR) |
|---|---|---|---|
| Monthly Churn | < 10% | < 5% | < 2% |
| NRR | Track, don't optimize | 110-120%+ | 120%+ |
| Gross Margin | 50-70% | 70-80%+ | 80%+ |
| LTV:CAC | Track | 3:1+ | 4:1+ |
| CAC Payback | < 18 months | < 12 months | 5-7 months |
| Rule of 40 | N/A | Approaching 40% | >= 40% |
Early-stage companies should focus on MRR, churn, CAC, activation, and burn rate. Growth-stage adds NRR, LTV:CAC, and gross margin. At scale, sales efficiency, predictive churn scoring, and Rule of 40 become the metrics that matter most. A solid reporting framework ties these stage-specific KPIs to the operational decisions they should trigger - not just the numbers themselves.
Contact data decays 30-40% per year - and every stale record poisons your revenue attribution. Prospeo's CRM enrichment returns 50+ data points per contact with a 92% match rate, refreshed every 7 days. Your pipeline numbers finally reflect reality.
Stop building revenue dashboards on top of rotten data.
Revenue Recognition Compliance
ASC 606 and IFRS 15
Revenue recognition isn't optional, and getting it wrong triggers restatements, audit findings, and investor distrust. ASC 606 has been in effect since 2019, and SaaS companies still trip over three areas, per Cohen & Co.'s guidance:
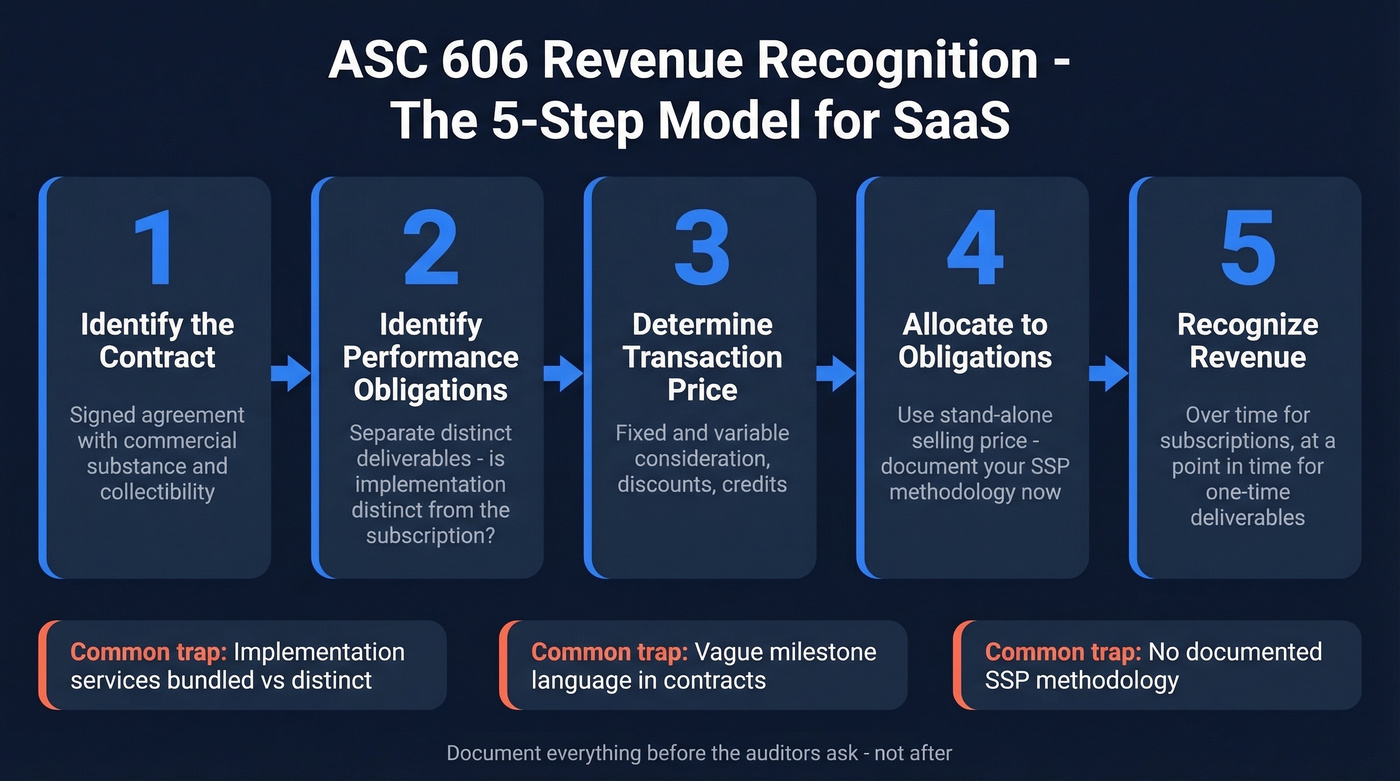
Implementation services. Are they distinct from the software subscription? If a customer can self-implement or hire a third party, the services are distinct and recognized separately. If they're integral to the subscription, they're bundled and recognized over the contract term.
Professional services timing. Milestone-based recognition requires clear evidence of control transfer and an enforceable right to payment at each milestone. Vague contract language here is a common source of audit pushback.
Stand-alone selling price estimation. When you bundle products, you need a systematic methodology for allocating revenue to each performance obligation. Document your SSP methodology before the auditors ask - not after.
Disclosure Checklist
Deloitte's ASC 606 Roadmap outlines the disclosure requirements you should track: disaggregation of revenue by geography and product line, contract balances including receivables and deferred revenue, performance obligations, significant judgments around timing and transaction price allocation, and practical expedients elected.
Practical tips: tighten contract language around service completion and control transfer. Document SSP methodology with actual pricing data. Build an audit trail connecting every recognized dollar to a specific contract.
How to Build a Revenue Report
Step 1: Audit Your Data
Everything downstream depends on this. Contact data decays 30-40% annually. Deduplication, standardization, and enrichment aren't nice-to-haves - they're prerequisites. When a VP of Sales changes companies and your CRM still shows the old title, every deal associated with that contact is misattributed. We've seen teams discover that 15-20% of their "active pipeline" was tied to contacts who'd left the company months ago. (If you're rebuilding your stack, start with contact management software.)

Step 2: Align Metric Definitions
If your sales team defines "revenue" as bookings, finance defines it as recognized revenue, and CS defines it as renewal value, your reports will never agree. Build a data dictionary. Define every metric once, get sign-off from sales, finance, and CS, and enforce it.
Skip this step at your own risk. If your team can't agree on what "revenue" means, your report is fiction regardless of how pretty the dashboard is.
Step 3: Choose Your Framework
Match your stack to your company stage. A $2M ARR company doesn't need Clari at $200-400/user/month. Your framework should define which metrics matter at your stage, which tools feed them, and who owns each data source. (If forecasting is the real pain point, compare sales forecasting solutions.)
Step 4: Integrate Data Sources
The single source of truth principle isn't negotiable. At minimum, CRM + billing system + accounting/ERP feeding into one place. Sync timing matters - if your billing system and CRM are out of sync during close, your MRR numbers will be wrong. (This is also where most sales pipeline challenges show up as "reporting issues.")
Step 5: Build Your Dashboard
A good dashboard passes the actionable test: Is performance good or bad? How good or bad? Why? What should we do about it? If your dashboard only answers the first question, it's a scorecard, not a decision tool.
Step 6: Set a Review Cadence
Monthly reviews for ops teams. Quarterly deep-dives for the board. Annually for compliance and strategic planning. SaaS companies should review MRR weekly - it moves fast enough that monthly surprises are unacceptable. Define who reviews what: the CFO doesn't need weekly MRR, and the SDR manager doesn't need the ASC 606 disclosure checklist.
Dashboard Design
The best revenue dashboards aren't the prettiest - they're the ones that drive action.
| KPI | Healthy Range | Alert Threshold |
|---|---|---|
| MRR Growth | +5-15% MoM | < 3% MoM |
| Monthly Churn | < 5% | > 7% |
| LTV:CAC | ~3:1 | < 2:1 |
| NRR | > 100% | < 95% |
Match the chart type to the question you're answering. Scorecards for current KPI status. Line charts for 6-12 month trends. Waterfall charts for budget-to-actual variance - they're underused but show exactly where the gap came from. Bar charts for OPEX by department.
Executive dashboards need four things: actual vs. budget, variance percentage, growth rates, and gross margin. Everything else belongs in drill-down views. Power BI offers free downloadable templates that include sales funnel, revenue, and financial overview dashboards - a solid starting point if you don't want to build from scratch.
Revenue Reporting Tools
The Five-Layer Stack
This isn't one tool - it's a stack. And in our experience, most teams over-invest in layers 4 and 5 while under-investing in layers 1 and 2.
Layer 1 - CRM. Salesforce, HubSpot CRM, Pipedrive. This is where deal data lives. If this layer is dirty, everything above it is wrong. (If you're standardizing definitions internally, it helps to align on examples of a CRM across teams.)
Layer 2 - Billing/Subscription Management. Stripe Billing, Chargebee, Zuora. Handles subscription logic, invoicing, and payment collection. Recurring revenue tracking breaks when your billing system can't handle phased starts or mid-cycle upgrades.
Layer 3 - Accounting/ERP. QuickBooks, Xero, NetSuite. The system of record for recognized revenue, journal entries, and financial statements.
Layer 4 - BI/Dashboards. Power BI Pro, Tableau, Looker. Visualization and analysis layer.
Layer 5 - Revenue Intelligence. AI-powered platforms that analyze pipeline, conversations, and deal signals to explain why revenue is what it is.
Revenue Intelligence Platforms
The revenue intelligence market is consolidating fast. Gartner published its first Magic Quadrant for Revenue Action Orchestration in December 2025. The Clari-Salesloft merger closed the same month, creating a combined ~$450M ARR platform. Highspot and Seismic announced intent to merge in February 2026.
| Platform | Approx. Pricing |
|---|---|
| Clari | $200-400/user/mo |
| Gong | ~$250/user/mo |
| Salesforce Revenue Cloud | $500-650/user/mo |
| HubSpot Operations Hub | $100-250/user/mo |
| People.ai | $50-100/user/mo |
| BoostUp | ~$79/user/mo |
| 6sense | $60K-300K/yr |
Here's the thing: if your average deal size is under $10K, you probably don't need a revenue intelligence platform at all. For teams under $5M ARR, you need three things - a clean CRM, a billing system that handles subscription logic, and a BI tool. Don't buy Clari at $200-400/user/month when your CRM has 40% duplicate records. Fix the foundation first. Revenue intelligence platforms add value when your data is clean enough to analyze. Before that, they're expensive dashboards showing garbage data with high confidence.
Automating Revenue Reporting
Automation isn't a luxury - it's survival. Leapfin's survey found 73% of businesses are outpacing their finance team's capacity. The manual processes teams most want to eliminate: data reconciliation across systems (28%), journal entries (23%), and revenue recognition schedules (17%).
Currently, 49% of finance teams use AI in some part of their workflow. Revenue recognition and reconciliation (33%) are the hardest processes to scale. Close timing tells the story: 51% of companies close within 1-5 business days, but SaaS companies are slower - 55% take 6-14 days because subscription billing creates reconciliation complexity.
Revenue forecasting is where automation gets interesting. Tools like Gong and Salesforce Einstein go beyond stage-probability models by incorporating historical conversion rates, deal velocity, seasonality, and buying signals. The result is forecasts that actually predict rather than just average.
The broader trend: 75% of high-growth B2B companies are expected to operate with a formal RevOps function by 2026. Organizations with unified revenue operations tools grow up to 19% faster. RevOps isn't just an org chart change - it's the operational layer that makes automated reporting possible by unifying data ownership across sales, marketing, and CS. (If you're hiring for this, start with the RevOps manager role breakdown.)
Revenue reporting breaks when pipeline data is wrong. Duplicate records, outdated job titles, and dead emails make every metric downstream a guess. Prospeo's 98% email accuracy and 7-day refresh cycle keep your CRM clean so finance and sales actually agree on the numbers.
Accurate revenue reports start with accurate contact data - at $0.01 per email.
FAQ
What's the difference between revenue and income?
Revenue is total money earned from sales before any expenses - your top line. Income is what remains after deducting COGS, operating expenses, and taxes. Strong revenue with negative income means expenses outpace sales.
How often should you produce a revenue report?
Monthly for operations, quarterly for the board, annually for compliance. SaaS companies should review MRR weekly - waiting a full month to discover a churn spike means you've already lost the customers.
Who owns revenue reporting in a SaaS company?
Finance owns the numbers, RevOps owns the data pipeline and integrations, and sales and CS own the inputs. When these three groups aren't aligned on definitions, you get three different revenue numbers - the #1 cause of conflicting board reports.
How does CRM data quality affect revenue reports?
Dirty CRM data - duplicates, stale contacts, missing fields - corrupts pipeline metrics and revenue attribution from the ground up. Contact data decays 30-40% annually, so without regular enrichment on a short refresh cycle, your pipeline stage analysis is unreliable. Fix your data first. Then build your reports.