SaaS Sales Efficiency: What Good Looks Like in 2026 (and How to Get There)
The median SaaS company now spends $2.00 to acquire $1.00 of new ARR - up 14% year over year. That's not a rounding error. It's a structural shift forcing every RevOps leader to rethink how they measure and improve SaaS sales efficiency - the return on every go-to-market dollar.
If your Magic Number is below 0.7, you're below median. If your GRR is under 88%, you're filling a leaky bucket no matter how efficient acquisition looks. Here's what the formulas actually are, where the benchmarks sit by stage, the measurement mistakes we see constantly, and the concrete levers that move the needle.
Why GTM Efficiency Is Harder Now
That $2.00 median CAC ratio means the average SaaS company burns twice its new ARR just to acquire it. Fourth-quartile companies fare even worse at $2.82 per dollar.
Revenue multiples keep compressing. The Bessemer Cloud 100 report average dropped to 20x from 23x the prior year and 26x the year before that. Investors aren't rewarding growth at any cost anymore - they're rewarding efficient growth, and the companies generating more revenue per S&M dollar are the ones getting funded, going public, and surviving downturns. Everyone else is cutting headcount and hoping the math works out.
This pressure isn't unique to software. B2B sales efficiency across every sector is under the same microscope as buyers tighten budgets and demand faster time-to-value.
What Is SaaS Sales Efficiency?
SaaS sales efficiency measures how much revenue you generate for every dollar spent on sales and marketing:
Sales Efficiency = New ARR / S&M Spend
It's an operational metric, not just a valuation metric. Your board cares about it, sure, but your RevOps team should care more - because it tells you whether your GTM engine is converting spend into revenue or just burning cash.
Three Ways to Measure It
Gross Sales Efficiency
Formula: Gross New ARR / S&M Expense
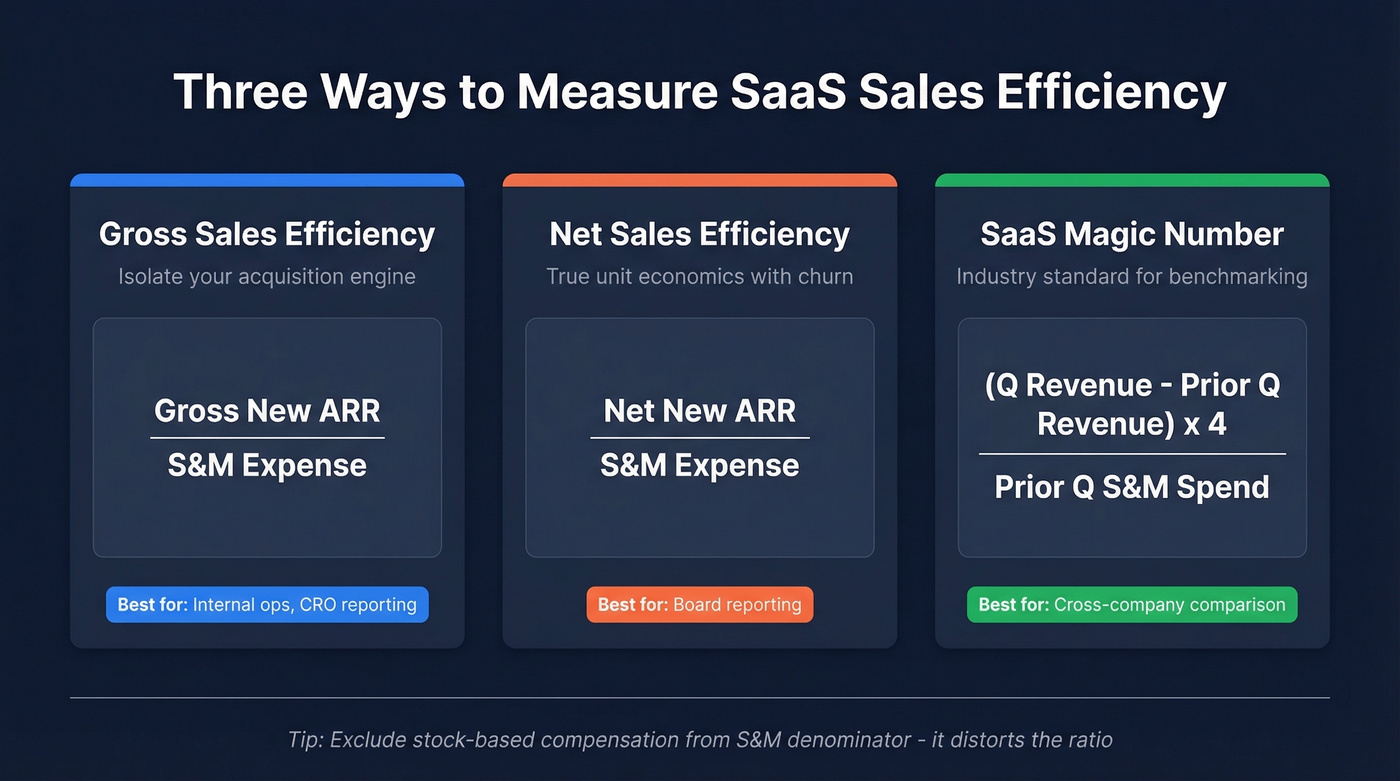
This isolates your acquisition engine. It ignores churn and downsells entirely, so it's useful for internal ops when you want to evaluate how well your team converts spend into new logos. It's not the number you show your board, but it's the number your CRO should obsess over.
Net Sales Efficiency
Formula: Net New ARR / S&M Expense
This accounts for churn and downsells, giving you the true unit economics picture. If your gross efficiency looks great but net efficiency is mediocre, you've got a retention problem masquerading as a sales problem. Use this for board-level reporting.
The SaaS Magic Number
Formula: (Current Quarter GAAP Revenue - Prior Quarter GAAP Revenue) x 4 / Prior Quarter S&M Spend
The SaaS Magic Number is the industry standard for cross-company benchmarking because GAAP revenue makes comparisons easier when ARR components aren't disclosed and revenue recognition differs across companies. Across Scale Studio's dataset of 1,000+ growth-stage companies, the long-term median hovers around 0.7. Exclude stock-based compensation from your S&M denominator - it's a non-cash GAAP expense that distorts the ratio.
Your S&M denominator includes every hour reps waste on bounced emails and wrong numbers. Prospeo delivers 98% email accuracy and 125M+ verified mobiles - so every dollar of sales spend converts into pipeline, not wasted outreach. Teams using Prospeo book 26% more meetings than ZoomInfo users.
Stop inflating your CAC ratio with bad data.
2026 Benchmarks by ARR Stage
Most benchmark articles give you a single number without context. That's useless. The efficiency ratio varies dramatically by ARR band, ACV, and GTM motion.
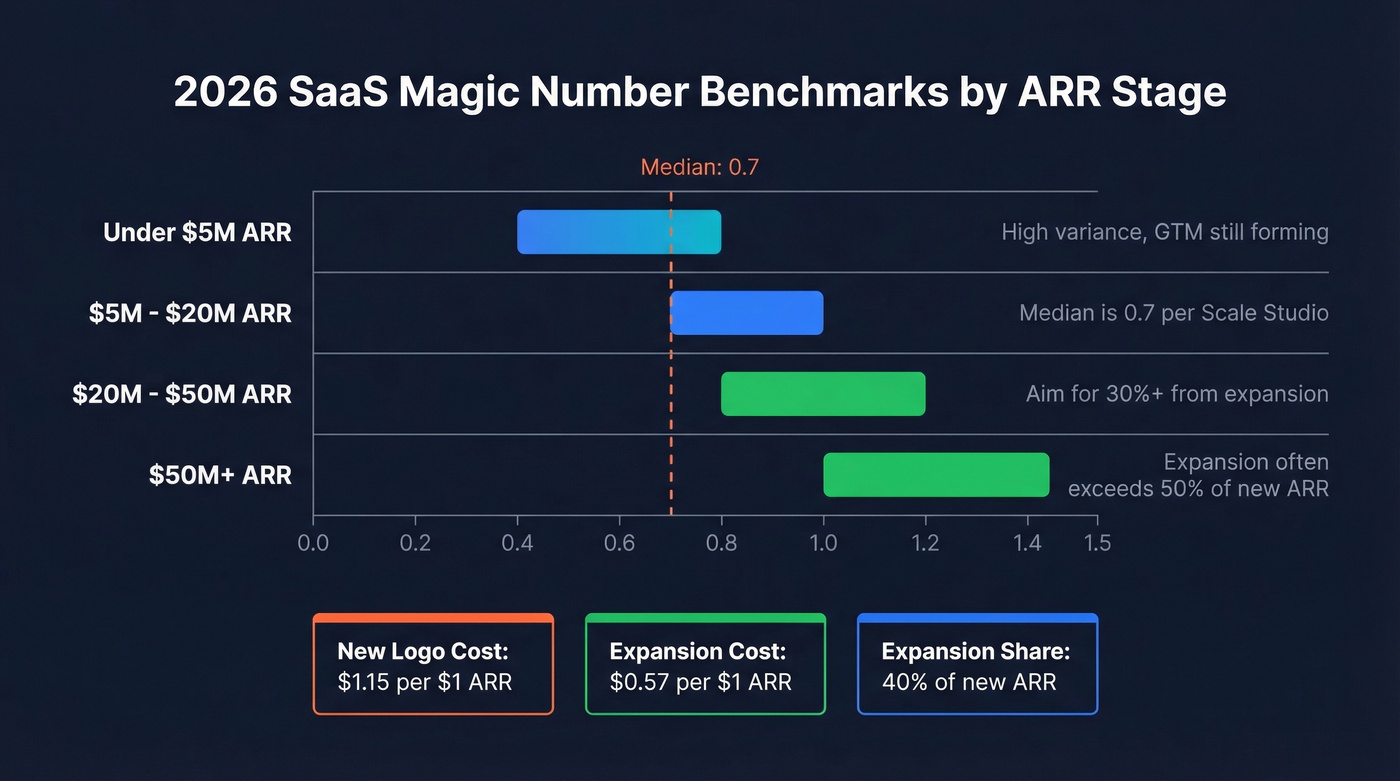
Here are practical Magic Number targets by ARR stage, with Scale Studio's 0.7 median as the anchor for growth-stage SaaS:
| ARR Band | Target Magic Number | Notes |
|---|---|---|
| <$5M | 0.5-0.8 | High variance; GTM still forming |
| $5M-$20M | 0.7-1.0 | Median is 0.7 per Scale Studio |
| $20M-$50M | 0.8-1.2 | Aim for 30%+ of new ARR from expansion |
| $50M+ | 1.0+ | Expansion often exceeds 50% of total new ARR |
A few things jump out from the Benchmarkit data. There's a persistent ACV anomaly: solutions in the $10K-$50K ACV range are actually more expensive to acquire than $50K-$100K deals. That mid-market squeeze catches a lot of scaling companies off guard.
The acquisition cost split tells the story even more clearly. New logo acquisition costs $1.15 per $1 of new ARR, while expansion costs just $0.57. GRR has declined from 90% to 88% over three years, while NRR sits at 101%. Expansion ARR now represents 40% of total new ARR - up 5 percentage points year over year - and at companies above $50M ARR, it's over 50%.
On spend mix, VC-backed companies allocate 47% of revenue to S&M versus 33% for PE-backed. ARR per FTE runs $200K in the $50M-$100M segment and $300K above $100M.
Let's be honest about the PLG vs. sales-led debate: neither is inherently "more efficient." PLG can run lower S&M as a percentage of revenue at low ACV, but it requires significant investment in product-led conversion infrastructure - in-product purchase flows, analytics, billing, and support systems. Sales-led motions add operational complexity around deal desk, approvals, pricing exceptions, and CPQ/CRM workflows, often with longer payback periods at enterprise ACV. It depends entirely on your ACV and market.
Common Measurement Mistakes
Before you benchmark yourself, make sure you're measuring correctly. We've reviewed dozens of board decks where the efficiency numbers looked great on the surface and fell apart under scrutiny.
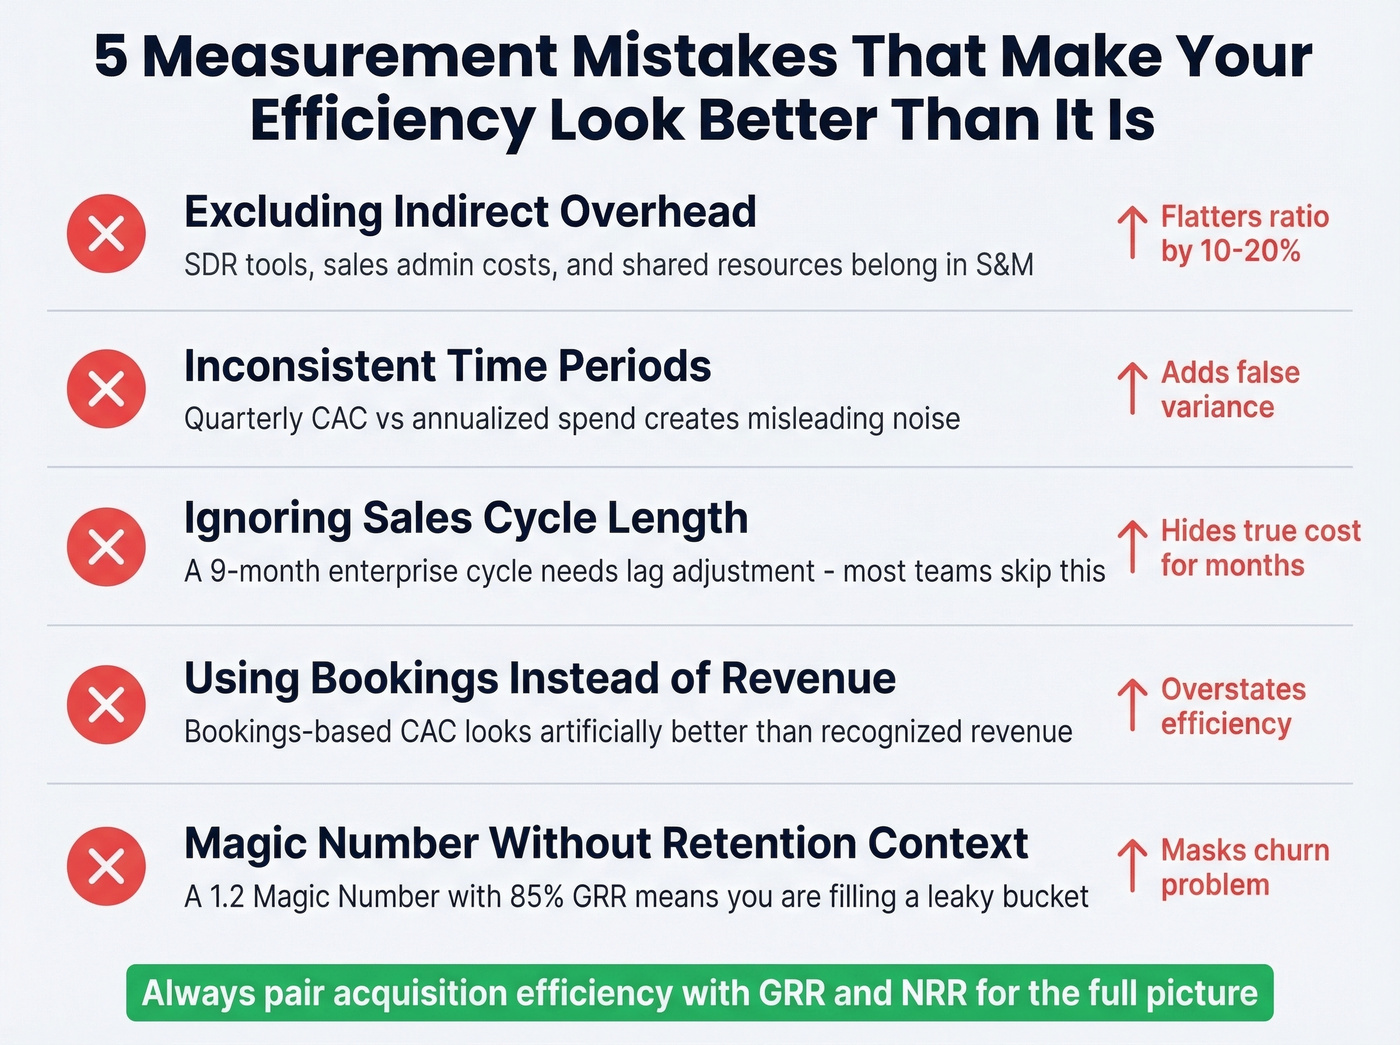
Excluding indirect overhead. If your SDR team uses $2K/month in tools and your sales admin supports 15 reps, that cost belongs in S&M. Leaving it out flatters your ratio.
Inconsistent time periods. Quarterly CAC compared against annualized spend creates noise. Pick a period and stick with it.
Ignoring sales cycle length. A 9-month enterprise cycle means you're nurturing leads far longer than a 30-day PLG conversion. Your efficiency ratio needs to reflect that lag - and most teams don't account for it, which makes their numbers look better than reality until the cohort data catches up.
Using bookings instead of recognized revenue. Bookings-based CAC looks artificially better than revenue-based economics. Use recognized revenue for honest numbers.
Measuring Magic Number without retention context. This is the one that drives us crazy. A 1.2 Magic Number with 85% GRR means you're efficiently pouring water into a bucket with a hole in it. Always pair acquisition efficiency with retention metrics.
How to Improve Sales Efficiency
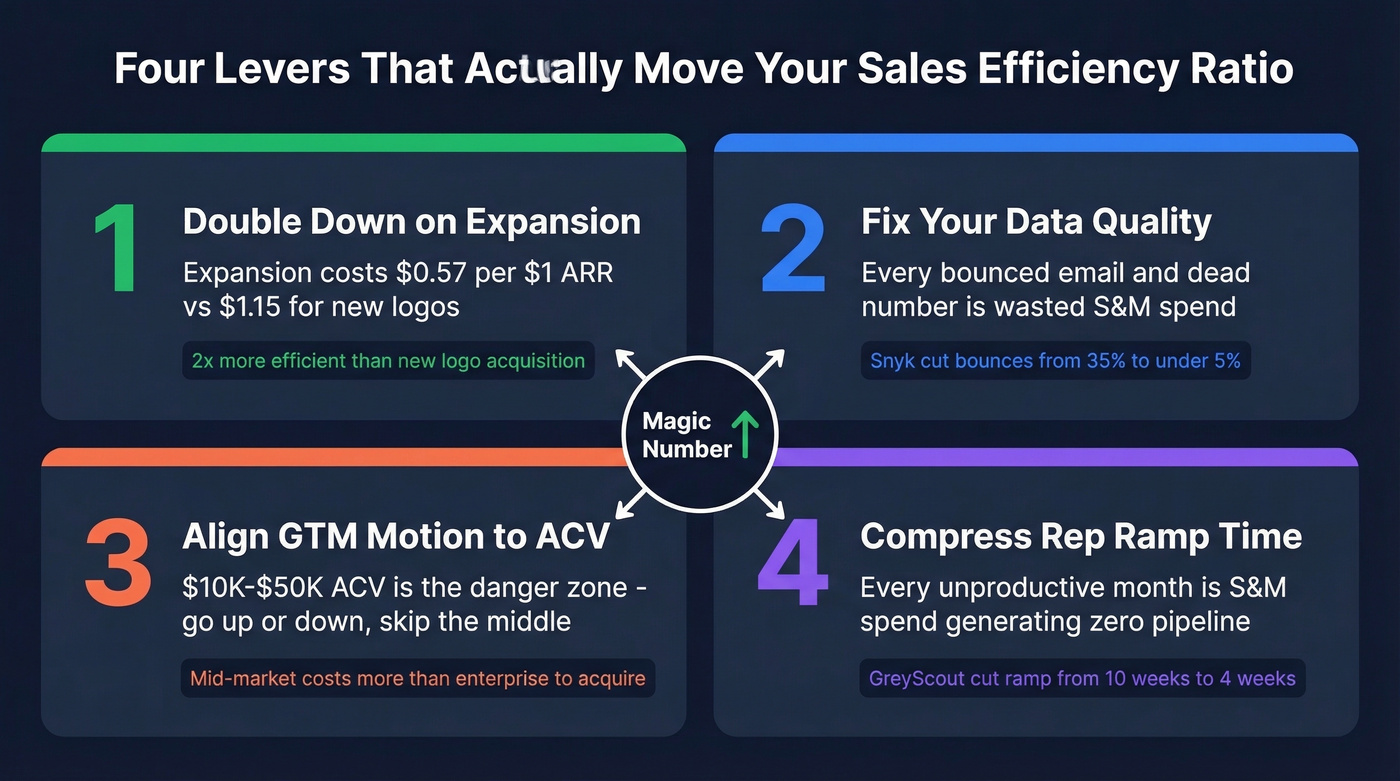
Double Down on Expansion Revenue
Expansion ARR is one of the most capital-efficient revenue streams you can generate. You've already paid to acquire the customer - upsells and cross-sells come in at roughly half the cost of new logo acquisition ($0.57 vs $1.15 per $1 of ARR). If expansion isn't at least 30% of your new ARR, your efficiency ratio will always lag. The median is already 40%.
If you need to formalize the motion, start with upsells and cross-sells and build a consistent renewal rate operating cadence.
Here's the thing: most SaaS companies under $20M ARR are over-investing in new logo acquisition and under-investing in expansion. If your product has any usage-based or seat-based pricing, your fastest path to a better Magic Number isn't hiring another AE - it's building a proper expansion motion for your existing base.
Fix Your Data Quality
Reps are the single most expensive line item in your S&M budget. Every bounced email, every dead phone number, every hour spent researching contacts instead of selling - that's wasted spend that directly tanks your efficiency ratio.
If you're seeing deliverability issues, start by tracking your email bounce rate and tightening your email deliverability fundamentals.

The proof is in the numbers. Snyk's 50-person AE team was dealing with 35-40% bounce rates. After switching to Prospeo's verified contact data, bounces dropped to under 5% and AE-sourced pipeline jumped 180% - 200+ new opportunities per month. That's a direct improvement in revenue per S&M dollar without adding a single headcount.
Data quality is the fastest efficiency lever because it requires zero additional headcount. You're not spending more - you're making existing spend productive. A 7-day data refresh cycle versus the 6-week industry average means reps aren't working stale lists that erode deliverability and waste dials.
Align GTM Motion to ACV
Remember that $10K-$50K ACV anomaly? It's the danger zone. Deals are too complex for pure self-serve but too small to justify a full enterprise sales cycle with deal desk, CPQ, and configuration overhead.
If you're in this range, be ruthless about motion design - either push downmarket with PLG and simpler packaging, or move upmarket where the economics actually work. Skip the middle unless you've got a very specific wedge that makes mid-market deals close fast.
If you’re rebuilding your motion, use a clear ideal customer profile and map the handoffs in your lead generation workflow.
Compress Rep Ramp Time
Every month a new rep isn't fully productive is a month of S&M spend generating below-target revenue. Faster ramp equals more productive months per rep per year equals higher efficiency.
Better onboarding playbooks help, but so does giving new hires verified prospect lists from day one instead of making them build from scratch. GreyScout cut rep ramp time from 8-10 weeks to 4 weeks by equipping new reps with pre-built, verified contact lists - and pipeline grew 140% as a result. That kind of ramp compression compounds fast when you're scaling from 5 reps to 15.
To systematize ramp, build a repeatable 30-60-90 day plan and standardize sales prospecting techniques across the team.
Expansion revenue costs $0.57 per $1 of ARR - but only if your team can actually reach existing accounts with accurate contact data. Prospeo's 7-day refresh cycle means you're never working stale records, and CRM enrichment returns 50+ data points at a 92% match rate. That's how you push expansion past 40% of new ARR.
Refresh your CRM data weekly and watch your efficiency ratio climb.
FAQ
What is a good SaaS Magic Number?
Above 0.7 is median for growth-stage SaaS; above 1.0 is strong. Always pair it with GRR - a high Magic Number with poor retention means you're efficiently filling a leaky bucket. Companies above $50M ARR typically sustain 1.0+ by leaning heavily on expansion revenue.
How often should I measure sales efficiency?
Quarterly at minimum. The Magic Number uses quarter-over-quarter GAAP revenue by design, which smooths out monthly noise. Track monthly internally for trend-spotting, report quarterly to your board.
Does improving contact data really move the efficiency ratio?
Yes. Reps are the largest S&M cost, so anything that increases productive selling time directly improves revenue per S&M dollar. Snyk cut bounce rates from 35-40% to under 5% and grew AE-sourced pipeline 180% without adding headcount. When your reps spend less time chasing bad data and more time in conversations, the math shifts fast.
What's the difference between sales efficiency and sales productivity?
Sales efficiency measures revenue generated per dollar of S&M spend - it's a financial ratio. Sales productivity measures output per rep: calls, meetings, pipeline created. Both matter, but efficiency is the metric investors and boards use to evaluate GTM health because it captures total cost, not just activity volume.
The companies winning in 2026 aren't spending more on sales - they're spending smarter. SaaS sales efficiency separates the companies that scale profitably from those that burn out chasing growth. Start with the benchmarks above, fix the measurement mistakes, and attack the levers in order of impact: expansion revenue first, data quality second, motion alignment third.