The SaaS Sales Funnel Guide With Actual Numbers
Most SaaS companies can tell you how many leads they generated last month. About two-thirds can't tell you where those leads leaked out. The median B2B SaaS company spends $2.00 to generate $1.00 in new ARR - and that ratio is getting worse, not better.
Every stage below gets a benchmark, every benchmark gets a number, and every number comes from current data. No hand-waving.
The Numbers at a Glance
If you already know what a SaaS sales funnel looks like and just want the benchmarks:
- Median CAC: $1,200 (up 60% over five years)
- CAC payback: 15 months
- Lead to MQL: 39%
- MQL to SQL: 38%
- SQL to Opportunity: 42%
- Pipeline velocity: (Opportunities x Avg Deal Value x Win Rate) / Sales Cycle Length
Each gets a full breakdown below. Your funnel doesn't need more stages. It needs measurement.
What Makes a SaaS Funnel Different
The classic AIDA model was built for one-time purchases. You convince someone to buy a mattress, they buy the mattress, you're done.
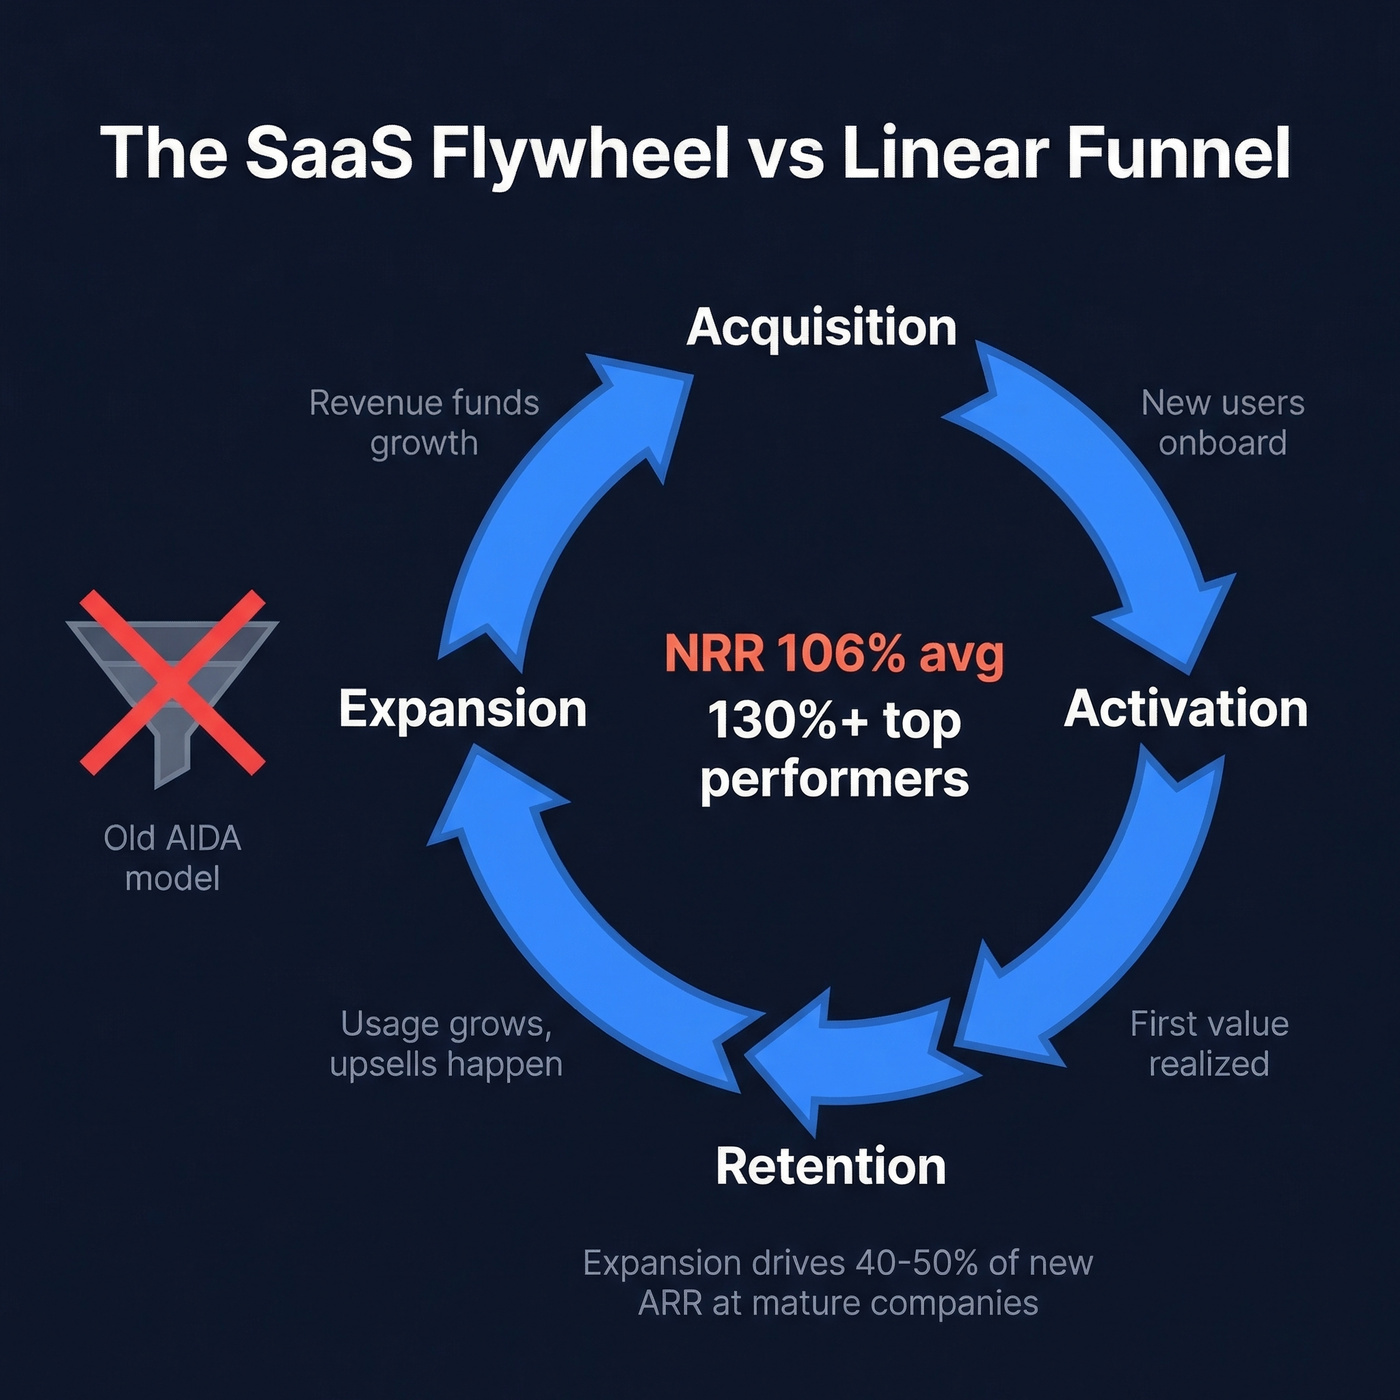
SaaS doesn't work that way. The sale is the beginning of the relationship, not the end. Subscription economics mean retention and expansion are revenue stages, not afterthoughts. Average NRR across B2B SaaS sits at 106%, and top performers hit 130%+. Expansion revenue drives 40-50% of the growth engine at mature companies - that's not a nice-to-have, that's the business model.
The buyer journey is also non-linear and multi-stakeholder. An enterprise deal can involve a product champion, their manager, IT security, legal, and finance - each entering the funnel at different points with different concerns. Modern SaaS funnel models look more like a flywheel: acquisition feeds activation, activation feeds retention, retention feeds expansion, and expansion funds more acquisition.
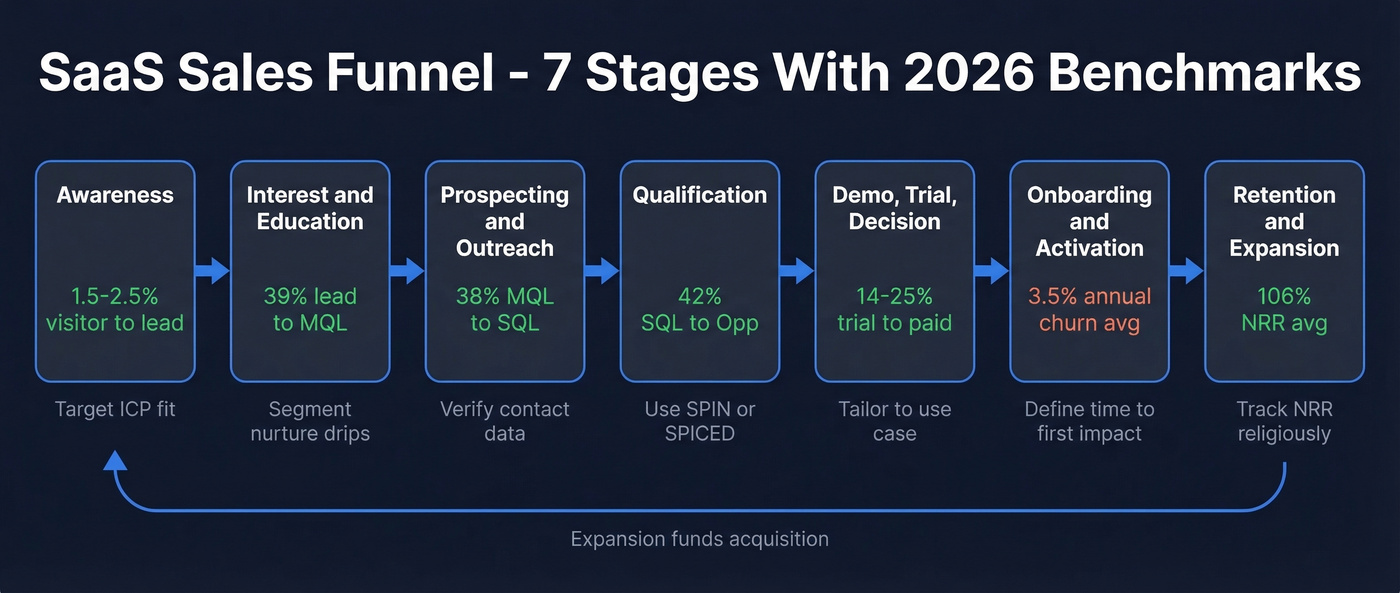
The 7 Stages Explained
Here's the stage-by-stage breakdown. Each stage gets a definition, a benchmark target, and the one mistake that kills conversion at that point.
Awareness
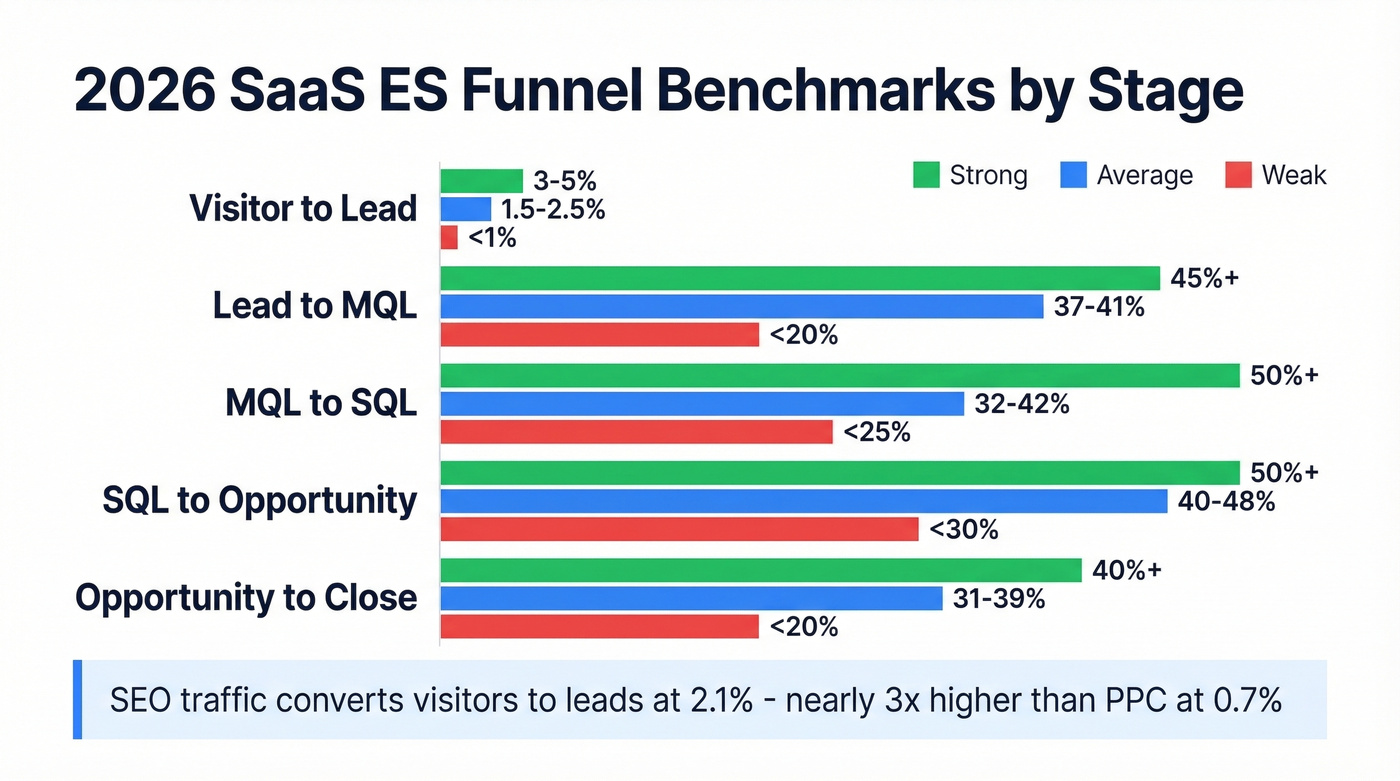
Benchmark first: Visitor-to-lead conversion averages 1.5-2.5%; strong performers hit 3-5%. The blended average hides a massive channel gap - SEO traffic converts at ~2.1%, nearly 3x PPC's 0.7%.
This is where prospects first learn you exist through content, ads, events, or word of mouth. The goal isn't leads yet. It's reaching the right people with the right problem.
Common mistake: Optimizing for traffic volume instead of ICP fit. A thousand visitors from the wrong industry are worth less than fifty from the right one.
Interest and Education
Prospects are now aware of you and exploring whether you solve their problem. They're reading case studies, watching demos, comparing you to alternatives. Gate high-value content like benchmarks and ROI calculators. Nurture with segmented email drips based on behavior - a pricing page visit should trigger a case study, not a generic newsletter. Video-first emails (recorded walkthroughs, not polished marketing videos) can drive 2-3x higher reply rates than text-only sequences.
Benchmark: Lead-to-MQL conversion averages 39% for B2B SaaS.
Common mistake: Sending the same nurture sequence to everyone. A common founder takeaway on r/SaaS is that early-stage teams spend 90% of energy on lead gen and almost nothing on mid-funnel nurturing. We've tested behavior-triggered sequences against time-based drips, and the difference is night and day.
Prospecting and Outreach
This is where outbound meets inbound. Your SDRs are building target lists, enriching contacts, and launching sequences. The quality of your contact data here determines everything downstream.
Bad data at the top of your funnel compounds at every stage. Bounced emails damage your sender reputation. Invalid phone numbers waste rep time. Inflated pipeline metrics give leadership false confidence. Meritt experienced this firsthand - bounce rates above 35% before switching to Prospeo's verified data, then dropping to under 4% after the switch.

Benchmark: MQL-to-SQL conversion averages 38%. SEO-sourced MQLs convert to SQL at 51% vs PPC at 26%.
Common mistake: Treating all leads equally. An inbound demo request and a whitepaper download aren't the same signal - score accordingly.
If you're tightening outbound, start with proven sales prospecting techniques and a clean lead enrichment workflow.
Qualification
The math here is brutal, and it's the single best argument for tight qualification.
At 50% stage progression across four steps, you need 160 pitches to win 10 deals. Drop that progression to 33%, and you need 810 pitches for the same 10 deals. That's a 5x difference in effort for the same outcome. Use frameworks like SPIN or SPICED to structure discovery calls and identify budget, authority, need, and timeline.
Benchmark: SQL-to-Opportunity conversion averages 42%; high performers hit 50%+.
Common mistake: Qualifying loosely "to fill the calendar." Shared MQL/SQL criteria between marketing and sales aren't optional - they're the difference between a healthy pipeline and a vanity one.
To make qualification consistent, implement a simple lead scoring model and standardize your discovery questions.
Demo, Trial, and Decision
The prospect is evaluating your product against alternatives. Whether that's a live demo, a free trial, or a freemium experience, this is where perceived value either clicks or doesn't.
Tailor demos to the prospect's specific use case, not a generic feature tour. For trials, define activation milestones and track them daily. Multi-thread into the buying committee - champion, economic buyer, technical evaluator. If you're only talking to one person, you're one reorg away from a dead deal.
Benchmark: Trial-to-paid ranges from 14-25% average; elite PLG companies reach 56%+.
Common mistake: Running a 14-day trial with no onboarding guidance and expecting users to find value on their own.
If your demos aren't converting, use a tighter product demo checklist and borrow battle-tested software demo tips.
Onboarding and Activation
The deal is closed, but the real work starts now. Define "Time to First Impact" - the moment the customer gets their first tangible win from your product. Assign a CS rep before the contract is signed, not after. Build an onboarding checklist with clear milestones. Early feature adoption in the first 72 hours is the strongest predictor of long-term retention.
| Segment | Churn Rate |
|---|---|
| B2B SaaS average (annual) | 3.5% |
| Voluntary churn | 2.6% |
| Involuntary churn | 0.8% |
| SMB self-serve (monthly) | 3-7% |
| Enterprise $100k+ ACV (monthly) | 0.5-1% |
Common mistake: Losing momentum between close and kickoff. A two-week gap between signing and first login is where churn seeds get planted.
If you're seeing churn early, run a proper churn analysis and track what is churn consistently across segments.
Retention and Expansion
Retention isn't a post-sale afterthought - it's a revenue stage. Expansion revenue accounts for 40-50% of new ARR at mature companies, and NRR averages 106% with top performers hitting 130%+.
Define expansion triggers: high usage, new hires, strong adoption scores, NPS promoters. Assign an expansion owner. Don't leave upsell to chance. Track NRR religiously.
Common mistake: No defined expansion triggers. If you're waiting for customers to ask for more seats, you're leaving revenue on the table.
2026 Funnel Benchmarks by Stage
These benchmarks draw from First Page Sage's conversion report and the 2026 B2B SaaS annual benchmarks.
| Stage | Average | Strong | Weak |
|---|---|---|---|
| Visitor to Lead | 1.5-2.5% | 3-5% | <1% |
| Lead to MQL | 37-41% | 45%+ | <20% |
| MQL to SQL | 32-42% | 50%+ | <25% |
| SQL to Opp | 40-48% | 50%+ | <30% |
| Opp to Close | 31-39% | 40%+ | <20% |
And here's how those numbers shift by company size and channel:
| Segment | Visitor to Lead | MQL to SQL | Close Rate |
|---|---|---|---|
| SMB | ~1.4% | ~40% | ~39% |
| Enterprise | ~0.7% | ~35% | ~31% |
| SEO traffic | ~2.1% | ~51% | ~38% |
| PPC traffic | ~0.7% | ~26% | ~35% |
What Fixing One Metric Actually Looks Like
Say your team generates 500 MQLs per month and your MQL-to-SQL rate is 25% (weak). That gives you 125 SQLs. Improve to 38% - just hitting average - and you're at 190 SQLs. That's 65 more qualified conversations per month without spending a dollar more on lead gen.
At a 35% close rate and $15,000 ACV, that's an extra $341,250 in pipeline per month. The biggest ROI almost always comes from fixing mid-funnel conversion, not generating more top-of-funnel volume.
Pipeline Velocity Formula
The single most useful metric for funnel health:
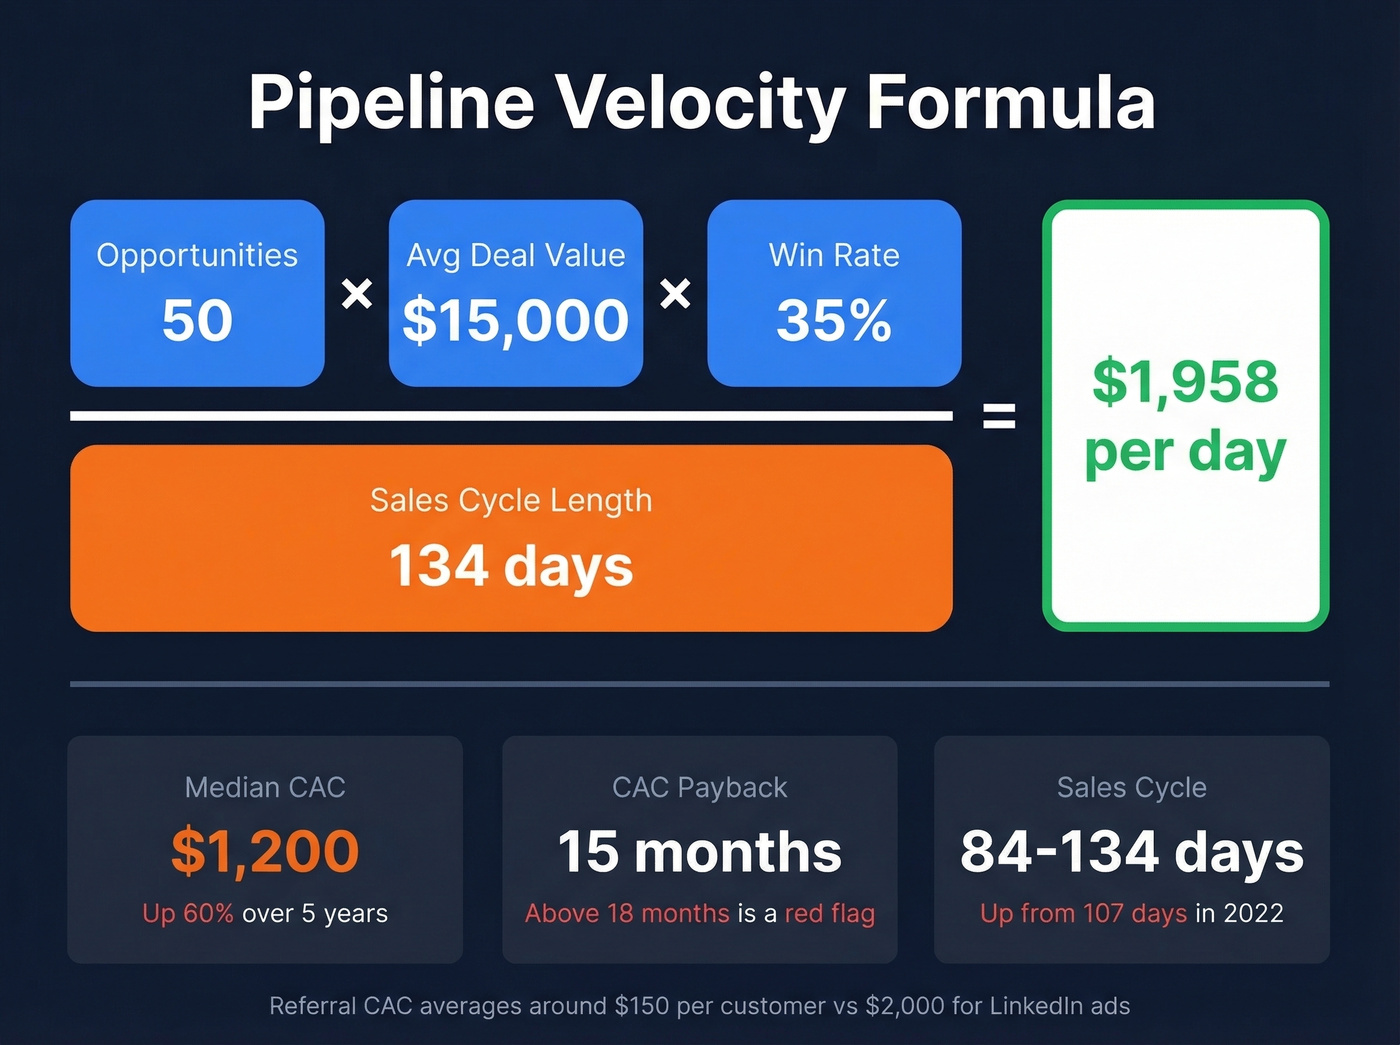
(Opportunities x Avg Deal Value x Win Rate) / Sales Cycle Length
Worked example: 50 opportunities x $15,000 deal value x 35% win rate / 134 days = $1,958/day in pipeline velocity.
Median sales cycles range from 84 to 134 days depending on ACV and segment - the 134-day figure reflects enterprise-weighted data, up from 107 days in early 2022. Deals are taking longer, which makes every other lever in the formula more important.
Median CAC sits at $1,200 per customer - a 60% increase over five years. Efficiency is getting harder, not easier. Channel matters too: referrals average ~$150/customer vs ~$2,000 for LinkedIn ads. CAC payback is 15 months. If your payback period is stretching past 18 months, your funnel has a leak or your pricing does.
These aren't just operational targets. Investors evaluate funnel conversion rates during diligence. A CAC payback under 15 months signals capital efficiency; anything above 18 months raises red flags.
Bounce rates above 35% don't just waste rep time - they compound through every funnel stage, inflating CAC and killing pipeline velocity. Prospeo's 98% email accuracy and 7-day data refresh cut bounce rates to under 4%, so every SQL your team qualifies actually reaches a real inbox.
Stop leaking pipeline to bad data. Start with verified contacts.
PLG vs Sales-Led: Pick Your Model
The choice between product-led growth and sales-led isn't binary anymore. It's a spectrum, and the right position depends on your ACV and product complexity.
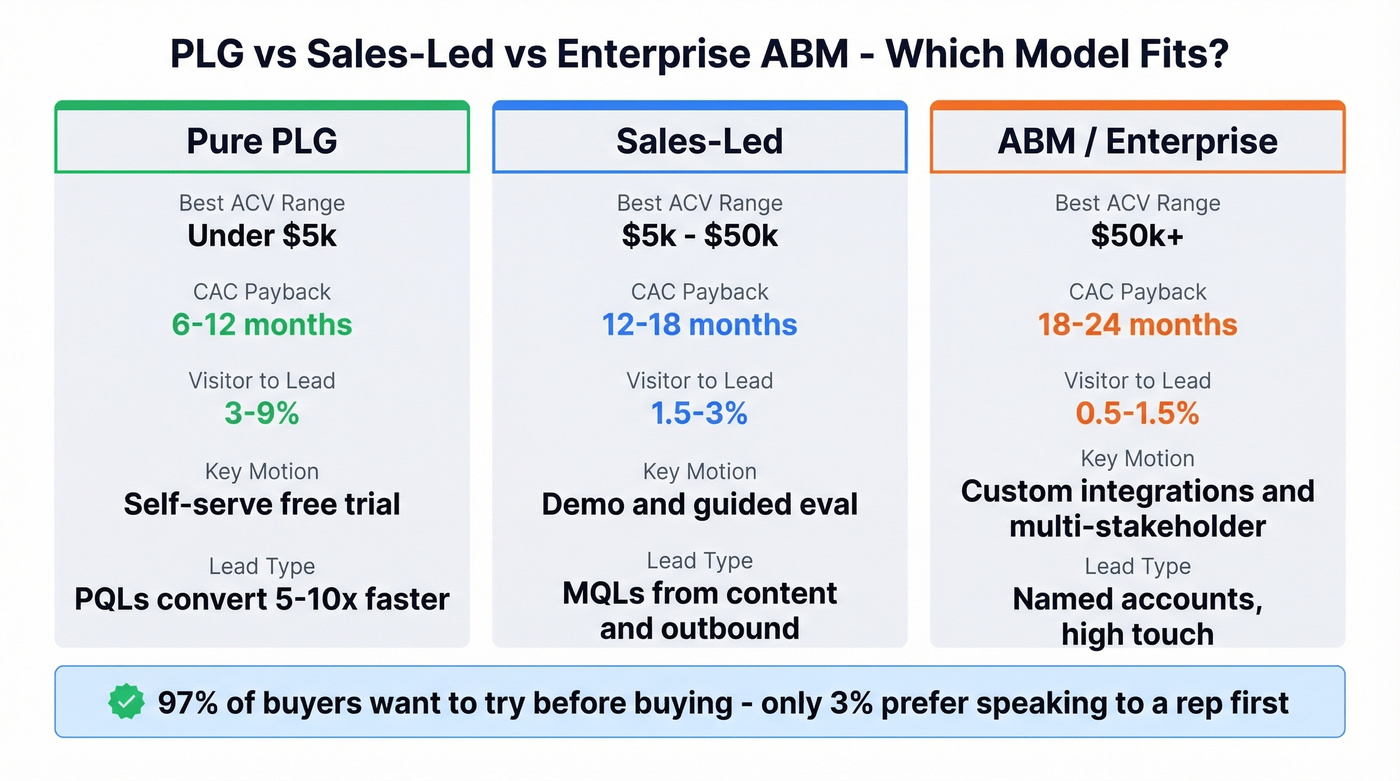
| Model | Best ACV Range | CAC Payback | Visitor to Lead |
|---|---|---|---|
| Pure PLG | <$5k | 6-12 months | 3-9% |
| Sales-led | $5k-$50k | 12-18 months | 1.5-3% |
| ABM / Enterprise | $50k+ | 18-24 months | 0.5-1.5% |
97% of buyers want to try before buying; only 3% prefer speaking to a rep first. PQLs (product-qualified leads) convert 5-10x faster than MQLs, and launching a free offer typically drives 20-30% more signups.
That doesn't mean every company should go PLG. If your product requires significant configuration, multi-department buy-in, or custom integrations, a pure self-serve motion will frustrate prospects. The hybrid model - free trial or freemium for discovery, sales assist for expansion - is where most B2B SaaS companies between $5k and $50k ACV land in 2026.
Here's the thing: if your deal size is under $10k, you probably don't need a sales team at all. We've seen teams force a sales-led motion onto simple products because "that's how B2B works." It rarely does. Match the motion to the buyer's decision complexity, not to what looks good on a pitch deck.
Optimizing Your Trial Stage
Your trial model has a massive impact on conversion. Here are the benchmarks from First Page Sage's dataset of 80+ SaaS companies:
| Model | Visitor to Trial | Trial to Paid |
|---|---|---|
| Freemium | 13.7% | 3.7% |
| Opt-in trial | 7.8% | 17.8% |
| Opt-out trial (card required) | 2.4% | 49.9% |
Opt-out trials - where the credit card is required upfront and billing starts automatically - convert at nearly 50% but attract far fewer signups. Freemium casts the widest net but converts at under 4%. The right choice depends on your activation complexity.
For simple products where value is obvious quickly, freemium works. Users self-select, and the ones who upgrade are genuinely sticky. For complex products that need guided setup, an opt-out trial with strong onboarding creates urgency and commitment.
Trial length matters too. Trials of 7 days or fewer drive ~40% immediate conversion through urgency, while longer 30-day trials increase trial adoption by 11% and delayed conversion by 42%. But the key variable isn't length - it's activation speed. Users who interact with core features in the first 3 days are 4x more likely to convert regardless of trial duration. Build your onboarding around getting users to that first "aha" moment as fast as possible.
Five Funnel Mistakes That Kill ARR
1. TOFU obsession. Teams pour 90% of their energy into lead generation and neglect everything after the first form fill. Allocate at least 30% of marketing effort to mid-funnel nurturing - behavior-triggered sequences, not just time-based drips.
2. Wide funnel, weak qualification. At 33% stage progression, you need 810 pitches to close 10 deals. At 50%, you need 160. Disqualify early and invest saved time into high-value pipeline.
3. No shared MQL/SQL definition. Marketing calls it qualified because they downloaded a whitepaper. Sales calls it unqualified because they have no budget. Define shared criteria with specific scoring thresholds that both teams agree on before the quarter starts.
4. Onboarding momentum loss. The deal closes, everyone celebrates, and then the customer sits in limbo for two weeks waiting for a kickoff call. Define Time to First Impact for every customer segment and assign CS before the contract is signed.
5. No expansion triggers. Expansion revenue should be a massive chunk of new ARR, but most teams don't have defined triggers for upsell conversations. Set usage thresholds, headcount growth alerts, and NPS scores that automatically flag expansion-ready accounts.
The Funnel Tech Stack
You don't need fifteen tools. You need the right tool at each stage, and you need them talking to each other.
| Stage | Category | Examples | Price Range |
|---|---|---|---|
| Prospecting | Data platform | Prospeo, Apollo, Lusha | Free-$500/mo |
| Outreach | Engagement | Instantly, Lemlist | $30-$200/mo |
| CRM | Pipeline mgmt | HubSpot, Salesforce | Free-$300/user/mo |
| Analytics | Behavior | Crazy Egg, Mouseflow | $30-$300/mo |
| Onboarding | CS platform | Intercom | $74-$500+/mo |
| Intent | Buyer signals | Bombora (15,000 topics) | $5k-$30k/yr |
| Scheduling | Meetings | Calendly | Free-$20/user/mo |
For mid-funnel nurturing, look at HubSpot's workflow builder or Encharge for behavior-triggered sequences. The key is connecting your CRM data to your engagement tools so a pricing page visit actually triggers something useful - not just another generic drip email.
Skip the enterprise-tier tools if you're pre-Series A. A free CRM, a solid data provider, and a sequencing tool will get you further than a $50k/year tech stack you don't have the headcount to operate.
If you're auditing your stack, start with a shortlist of SDR tools and compare options across sales funnel automation tools.
MQL-to-SQL conversion jumps when reps reach the right buyers on the first touch. Prospeo gives your SDRs 30+ filters - buyer intent, technographics, headcount growth - to build ICP-perfect lists at $0.01 per email. That's the 160-pitches-to-10-deals math working in your favor.
Tighten every stage of your SaaS funnel with data that actually connects.
FAQ
How do I build a SaaS sales funnel from scratch?
Define your ICP, then map seven stages - awareness, interest, prospecting, qualification, demo/trial, onboarding, and retention - with conversion metrics between each. Start by benchmarking your current rates against the averages in this guide, then focus optimization on the two or three stages with the steepest drop-off.
What's a good trial-to-paid conversion rate?
The average trial-to-paid rate falls between 14-25%. Opt-out trials (credit card required) average 49.9%, while freemium-to-paid sits at 3.7%. Elite PLG companies reach 56%+. Freemium attracts far more signups, so total paid conversions can be comparable despite the lower percentage.
How is a B2B SaaS funnel different from B2C?
B2B SaaS funnels include retention and expansion as revenue stages because subscription economics make customer lifetime value dependent on keeping and growing accounts. Sales cycles run 84-134 days with multi-stakeholder buying committees, making qualification and demo stages far more complex than a typical consumer purchase.
What's the best free tool for SaaS funnel prospecting?
Prospeo's free tier includes 75 verified emails and 100 Chrome extension credits per month - enough to validate your ICP targeting before scaling spend. HubSpot CRM (free) handles pipeline management, and Calendly's free plan covers scheduling. Together, these three tools cover prospecting through close at zero cost.
What is pipeline velocity and why does it matter?
Pipeline velocity measures how fast revenue moves through your funnel: (Opportunities x Deal Value x Win Rate) / Cycle Length. A healthy B2B SaaS benchmark is $1,500-$2,500/day for mid-market teams. Improving any single variable - more opportunities, bigger deals, higher win rates, or shorter cycles - directly accelerates revenue.